Don’t be fooled by the risk reward ratio — it’s not what you think.
You can look for trades with a risk reward ratio of 1:2 and remain a consistent loser (and I’ll prove it to you later).
Similarly:
You can look for trades with a risk-reward ratio of less than 1 and remain consistently profitable.
Why?
Because the risk-reward ratio is only part of the equation.
But don’t worry.
In this post, I’ll give you the complete picture so you’ll understand how to use the risk-reward ratio (aka risk return ratio) the correct way.
You’ll learn:
- What is risk-reward ratio — and the biggest lie you’ve been told
- The secret to finding your edge (hint: risk-reward ratio isn’t enough)
- How to set a proper stop loss and define your risk
- How to set a proper target and define your reward
- How to analyze your risk-reward ratio like a pro
- Your risk-reward ratio doesn’t give you an edge. Here’s what you must do…
And after reading this guide, you’ll never see the risk-reward ratio the same way again.
Ready?
Then let’s begin…
What is risk-reward ratio — and the biggest lie you’ve been told
The risk-reward ratio (or risk return ratio) measures how much your potential reward (or return) is, for every dollar you risk.
For example:
If you have a risk-reward ratio of 1:3, it means you’re risking $1 to potentially make $3.
If you have a risk-reward ratio of 1:5, it means you’re risking $1 to potentially make $5.
You get my point.
Now, here’s the biggest lie you’ve been told about the risk reward ratio
“You need a minimum of 1:2 risk reward ratio.”
That’s bullshit.
Why?
Because the risk-reward ratio is meaningless on its own.
Don’t believe me?
Here’s an example:
Let’s say you have a risk reward ratio of 1:2 (for every trade you win, you make $2).
But, your winning rate is 20%.
So out of 10 trades, you have 8 losing trades and 2 winners.
Let’s do the math…
Total Loss = $1 * 8 = -$8
Total Gain = $2 * 2 = $4
Net loss = -$4
By now I hope you understand the risk reward ratio by itself is a meaningless metric.
Instead, you must combine your risk-reward ratio with your winning rate to know whether you’ll make money in the long run (otherwise known as your expectancy).
The secret to finding your edge (hint: the risk-reward ratio isn’t enough)
Do you want to know the secret?
Here it is…
E= [1+ (W/L)] x P – 1
Where:
W means the size of your average win
L means the size of your average loss
P means winning rate
Here’s an example:
You made 10 trades. 6 were winning trades and 4 were losing trades.
This means your percentage win ratio is 6/10 or 60%.
If your 6 winners brought you a profit of $3,000, then your average win is $3,000/6 = $500.
If your 4 losers were $1,600, then your average loss is $1,600/4 = $400.
Next, apply these figures to the expectancy formula:
E= [1+ (500/400)] x 0.6 – 1 = 0.35 or 35%.
In this example, the expectancy of your trading strategy is 35% (a positive expectancy).
This means your trading strategy will return 35 cents for every dollar traded over the long term.
So here’s the truth:
There’s no such thing as… “a minimum of 1 to 2 risk reward ratio”.
Because you can have a 1 to 0.5 risk reward ratio, but if your win rate is high enough… you’ll still be profitable in the long run.
So…
The most important metric in your trading is not your risk reward ratio or winning rate.
It’s your expectancy.
How to set a proper stop loss and define your risk
Now, you don’t want to place a stop loss at an arbitrary level (like 100, 200, or 300 pips).
It doesn’t make sense.
Instead, you want to lean against the structure of the markets that act as a “barrier” that prevents the price from hitting your stops.
Some of these market structures can be:
If you want to learn more, go watch this training video below:
Next, you must have the correct position sizing so you don’t lose a huge chunk of capital when you get stopped out.
Here’s the formula to do it:
Position size = Amount you’re risking / (stop loss * value per pip)
Let’s say…
Your risk is $100 per trade
Your stop loss is 200 pips
Your value per pip is $10 (this number changes according to the currency you trade)
Plug and play the numbers into the formula and you get…
100 / (200 * 10) = 0.05 lots
This means if your risk is $100 per trade and your stop loss is 200 pips, then you’ll need to trade 0.05 lots.
If you want to learn more on risk reward ratio Forex and Forex risk management, then go read The Complete Guide to Forex Risk Management.
How to set a proper target and define your reward
This is one of the most common questions I get from traders:
“Hey Rayner, how do I set my target profit?”
Well, there are a few ways to do it…
But generally, you want to set a target at a level where there’s a good chance the market might reverse from — which means you expect opposing pressure to come in.
Here are 3 possible areas to set your target profits:
- Support and Resistance
- Fibonacci extension
- Chart pattern completion
Let me explain…
1. Support and Resistance
Here’s a quick definition of Support and Resistance…
Support – An area where potential buying pressure could come in.
Resistance – An area where potential selling pressure could come in.
This means…
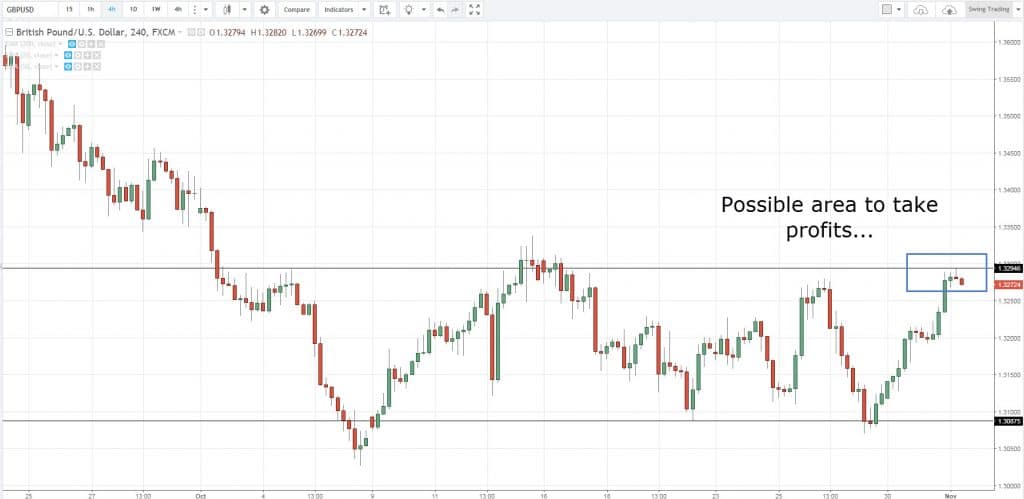
If you’re in a long position, then you can consider taking profits at Resistance.
If you’re in a short position, then you can consider taking profits at Support.
This technique is useful if the market is in a range or a weak trend.
An example:
Pro tip:
Don’t aim for the absolute highs/lows for your target because the market may not reach those levels, and then reverse.
So, be more conservative with your target profits and exit a few pips “earlier”.
2. Fibonacci extension
A Fibonacci extension lets you project the extension of the current swing (at the 127, 132, and 162 extension).
This technique is useful for a healthy or weak trend where the price tends to trade beyond the previous swing high before retracing lower (in an uptrend).
So…
Won’t it be great if you can “predict” how high the price will go — and exit your trade before the price retraces?
That’s when Fibonacci extension comes into play.
Here’s how to use it…
- Identify a trending market
- Draw the Fibonacci extension tool from the swing high to swing low
- Set your target profits at the 127, 138, or 162 extension (depending on how conservative or aggressive you are)
And vice versa for an uptrend.
Here’s an example:
TradingView’s Fibonacci extension tool doesn’t come with 127 and 138 levels.
So, you must tweak the settings to get those levels.
Here’s how the settings will look like:
3. Chart pattern completion
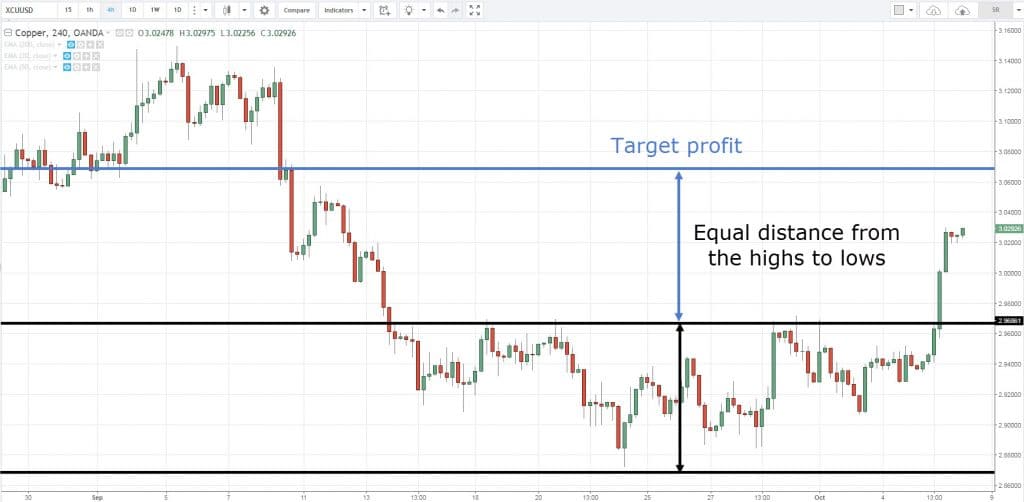
This is classical charting principles where the market tends to find exhaustion when a chart pattern completes.
You’re probably wondering:
“How do you define complete?”
Well, if the price moves an equal distance from the chart pattern, it is considered complete.
An example:
Does it make sense?
Good.
Because in the next section, you’ll learn how to analyze your risk to reward like a pro.
Let’s move on…
How to analyze your risk reward ratio like a pro
So… you’ve learned how to set a proper stop loss and target profit.
Now it’s easy to calculate your potential risk reward ratio.
Here are 3 simple steps to do it:
- Find out the distance of your stop loss
- Find out the distance of your target profit
- Distance of target profit/distance of stop loss
An example:
Let’s assume your stop loss is 100 pips and target profit is 200 pips.
Apply the formula and you get…
200/100 = 2
This means you have a potential risk reward ratio of 1:2.
Alternatively, you can look for a risk reward ratio calculator to intuitively tell you the numbers.
How to use TradingView to calculate your risk reward ratio easily
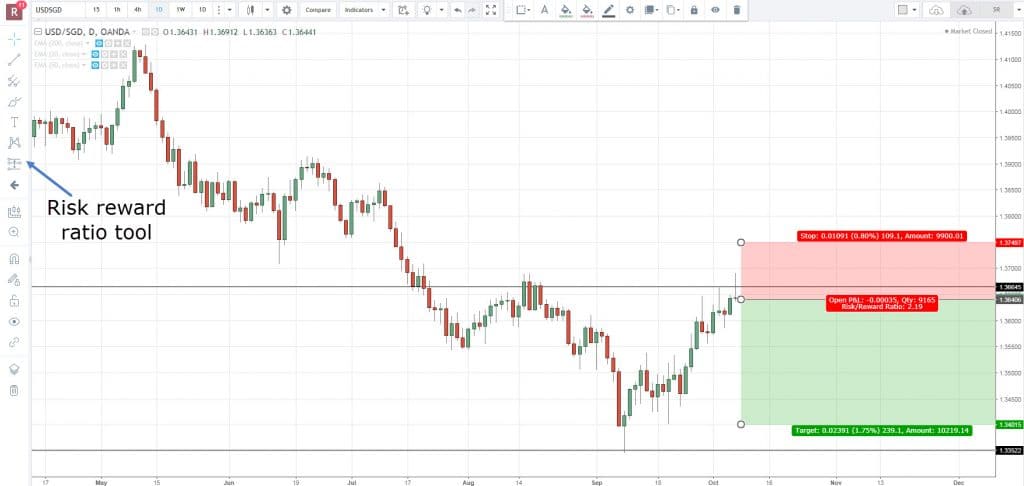
Now, if you use TradingView, then it makes it’s easy to calculate your risk to reward ratio on every trade.
Here’s what you need to do:
- Select the risk reward tool on the left toolbar
- Identify your entry, stop loss and target profit
And it’s like a risk reward ratio calculator, which tells you your potential risk to reward on the trade.
An example:
Also…
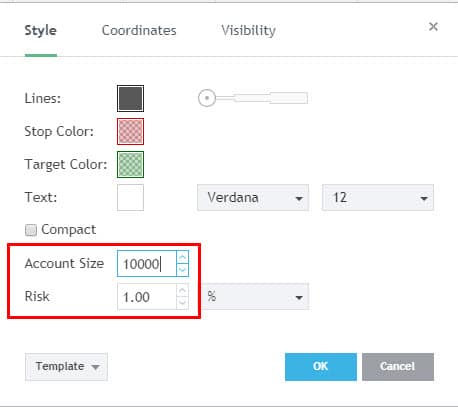
The risk reward ratio tool tells you what your position size should be given the size of your account and your risk per trade. Here’s how…
Double click the risk reward ratio tool on the chart, and you can change the settings…
Pretty convenient “risk reward ratio calculator” in a sense, right?
You risk reward ratio doesn’t give you an edge. Here’s what you need do…
Now, remember this one thing.
Your risk reward ratio is a meaningless metric by itself.
You must combine your risk reward ratio with your winning rate to quantify your edge.
And the way to do it is to execute your trades consistently and get a large enough sample size (of at least 100).
You might be wondering:
“But what if after 100 trades, I’m still losing money?”
Don’t be disheartened.
It’s not the end of your trading career.
In fact, you’re probably ahead of 90% of traders out there as you clearly know what’s not working.
Now…
If your trading strategy is losing you money, here are four things you can do to fix it…
- Trade with the trend
- Set a proper stop loss
- The “highway” technique
- Trade the juiciest levels
Here’s how to do it…
1. How to trade with the trend and improve your winning rate
It’s a no-brainer that trading with the trend will increase the odds of your trade working out.
So here’s a guideline for you…
If the price is above the 200-period moving average, look for long setups
If the price is below the 200-period moving average such as 10-day, 20-day, or 100-day, look for short setups.
And if you’re in doubt, stay out.
2. How to set a proper stop loss so you don’t get stopped out unnecessarily
Here’s the thing:
You don’t want to be a cheapskate and set a tight stop loss… hoping you can get away with it.
It doesn’t work that way.
If your stop loss is too tight, then your trade doesn’t have enough room to breathe. And you’ll probably get stopped out from the “noise” of the market — even though your analysis is correct.
So, how should you place your stop loss?
Well, it should be at a level where it will invalidate your trading setup.
This means:
If you’re trading chart patterns, then your stop loss should be at a level where your chart pattern gets “destroyed”.
If you’re trading Support and Resistance (SR), then your stop loss should be at a level where if the price reaches it, your SR is broken.
Let’s move on…
3. The highway technique that improves your risk to reward
Here’s the deal:
When you enter a trade, you want to have little “obstacles” so the price can move smoothly from point A to point B.
But the question is:
How do you find such trading opportunities?
Let me introduce to you the highway technique because this is like driving on a highway where you have little to no traffic in your way.
Here’s how it works:
Before you enter a long trade, make sure the market has room to move at least 1:1 risk reward ratio before approaching the first swing high (and vice versa for short).
Why?
Because you have a good chance of getting a 1:1 risk reward ratio on your trade as there are no “obstacles” nearby (till the first swing high).
Now…
If you want to further improve your risk to reward, then look for trading setups with a potential 1:2 or 1:3 risk reward ratio before the first swing high.
However, this reduces your trading opportunities as you’re more selective with your trading setups. Thus, you’ll need to find a balance to it.
4. Trade the juiciest levels
You’re probably wondering:
“What do I mean by juiciest?”
Well, you want to trade Support and Resistance levels that are the most obvious to you.
Why?
Because these are levels that attract the greatest amount of order flows — which can result in favorable risk to reward ratio on your trades.
Here’s how to find the juiciest levels:
- Zoom out the chart of your trading timeframe
- Mark out the most obvious levels
- Trade those levels only
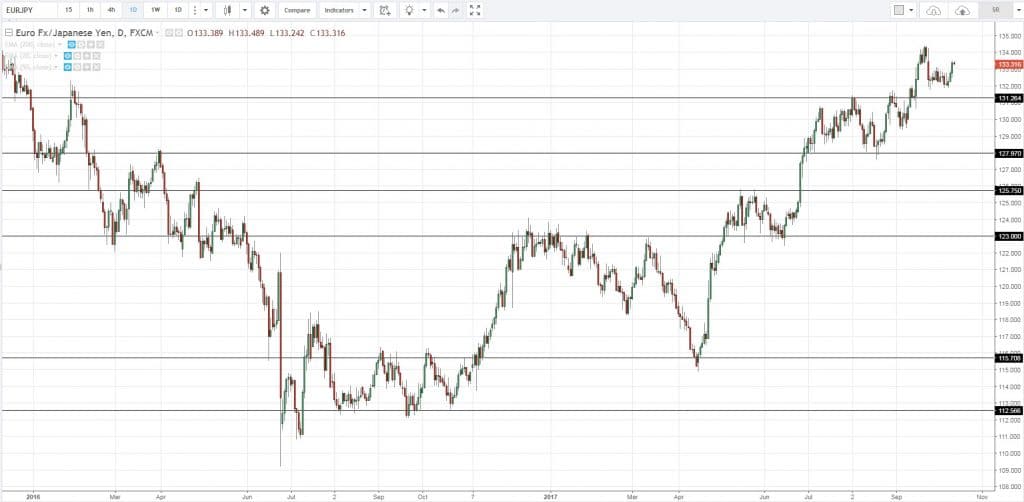
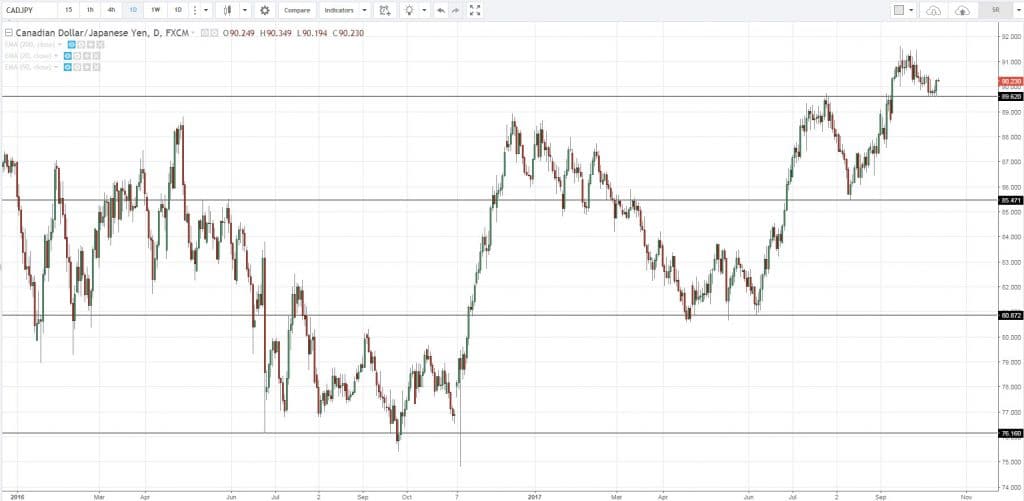
Here are a few examples:
Pro tip:
A level is more significant if there is a strong price rejection.
This means the price spent only a short time at a level before moving away (and it looks like a spike).
Conclusion
So in this post, you’ve learned:
- The biggest lie you’ve been told about the risk reward ratio
- How to combine your risk reward ratio and win rate to find your edge in the markets
- How to set a proper stop loss and define your risk
- How to set a proper target and define your reward
- How to analyze your risk reward ratio like a pro
- 4 practical tips that can turn your losing strategy into a winner
Now here’s what I would like to know…
“How do you use the risk reward ratio in your trading?
Leave a comment below and let me know your thoughts…




Hmmm.
Winning ratio is fine but Risk:Reward is very important.
And for stop loss, I think volatility based stoplosses are the best.
Thank you for sharing bud.
I used a 1:3 risk to reward but the price always reversed on the next swing before hitting my target
Hey Edwin,
I’m sorry to hear that,
I believe this video would help.
https://youtu.be/LBQIkLkU8WY
Cheers.
Very nicely said!
I always tell people RRR is not something you can use as a singular matrix; must be combined with winning rate.
Well said, Dom!
I never use risk to reward ratio myself. My system tells me which way the market is going and I do not trade unless my set up is confirmed. Then I lock in profits as soon as possible with a trailing stop and let the trade run its course.
Do you mind sharing your system?
I’ve shared the core principles of my trading approach in my weekly videos. You can have a look at it.
Thanks for sharing, Karol.
I understand risk you have defined it consistently in all your presentations. I’m having issue defining Reward; since I will let trend as long as possible. I generally use dynamic Stop Loss have a few static Stop Loss (3 ATR) So question is “How to determine Reward” ? Using you advice and making profit. As always many thanks!
Hey Tom
That’s a good question.
For trend following, you can’t predetermine your reward since you don’t have a target.
What you can do is to record your trades and look at your average R multiple of your trades. That’s how you get your average r:r on your trades.
Hey Rayner, there’s another way to get the
Fibonacci extension tool to get the extension levels. It’s the tool right below the “Fibonacci retracement” tool on TradingView.
It’s called the “Trend-Based fib extension”.
One way to use it is to plot from the swing low to the swing high, and then back down onto the swing Low. U will sure to get the extension levels.. it works vice versa. (Swing high to swing Low,then back to the swing high)
Hey Daniell
Thank you so much! I didn’t know that, cheers
Another excellent post Rayner, thanks a lot.
You’re welcome, Nayan!
Hey
As you said. Even if i look for 1:2 risk/reward i still have more losers then winners. I will certainly try a bit different approach after reading your article.
Thank you again Rayner
The pleasure is mine, Zla.
Hi Rayner,
I’ve always benfited from your non-conventional approach to trading forex.
I personally dislike “textbook” theories and concepts which have been over-used such that
they become cliches but do not work well in real life.
I agree totally its not the 1:2 RRR because I’ve tried it after attending an expensive forex
course and also every “textbook” on forex say that. But the truth is that as you mentioned, my winning rate is so low I ended up losing money at the end of every month.
It’s frustrating. So I’ve turned to “volunteer gurus” like your good-self who are willing to
impart to us workable techniques based on your own experiences and I like trainers
who dare to break ‘conventional rules’ which do not work.
Let’s face it. At the end of the day, all of us are in this ‘game’ to make money.
If a textbook theory not properly expounded or used in conjunction with other equally
important strategies, then it’s just a textbook theory. Period.
Thanks Rayner. I’ve enjoyed and benefited from your weekly sharing.
Have a great day and successful trading week !
Yo Joseph
Thank you for sharing your experience and your kind words.
I’m glad to hear that.
Don’t hesitate to let me know if you’ve got any questions, I’ll be glad to help.
As always Rayner, I am very grateful with your blogs. I learned a lot from it. Through constant practice with these techniques would surely improve my winning rate 🙂
Harold
You’re welcome, Harold.
Hope to hear about your progress! cheers
Prior to reading this post I put a lot into risk, reward thinking that was the key to being profitable.
Now I can see it’s better to have a winning edge with little profit overall than trying to achieve a risk, reward level and miss out. That has happen to me quite a bit I would have a set R:R level and wait until it was achieve only sometimes to lose in the trade.
Sure risk, reward is important, but I will now look at it different.
Thank You
God Bless
You’re welcome, William.
Cheers
everybody asking for win rate min 50% and risk reward ration 1 : 1.5 then only we can make profit but in reality it is tough to maintain for each trade . for few trades if we can not maintain then what should we do ? Should we book profit in less than 1:1.5 RR or book loss in case stock moves in opposite direction ? can we maintain RRR on average of all my trades ?
There’s no way to tell for sure what’s your risk to reward will be in the long run.
What you can do is to have a consistent approach for exits, journal your trades and see where that number lies over time.
From then on, you can work on ways to improve your expectancy.
Good stuff bro,esp in tweaking d strategy if win rate not good, I would like to suggest if u have time, playing with variable of loss in a row,1of 9 variable to look into in strategy,u can put much risk in a trade if loss in a row less than x Num,cheers
Thanks for sharing, Qara.
The risk/reward tool in Trading View has been very helpful in formulating and refining my strategy. I am a visual learner so it’s one of my favorite tools.
Awesome to hear that, Denver!
Excellent Training Rayner!
Would love it if you brought out a definitive guide to using Fibonacci
Thank you, Elijah!
Thank you soo much
You’re welcome!
now i can say I UNDERSTAND..thanks a lot Teo
Awesome!
Where did you get the expectancy rato formula?
Isn’t it: (Reward to Risk ratio x win ratio) – Loss ratio = Expectancy Ratio?
There are different ways to calculate it, you can google it and see different approaches.
Idiot, tell me, how can your expectancy be positive if your R:R is less than 1, without increasing your hit rate more than 100%???
“Because you can have a 1 to 0.5 risk reward ratio, but if your win rate is high enough… you’ll still be profitable in the long run.” …………..
Man you know nothing about trading, your expectancy can’t cross 0<, unless hit rate is 100 or more!!!!!!!!
Stop humiliating yourself.
If you wobble into a trade taking multiple trades with 3 pip target and 30 pip stop then you end up with a very high win rate. And before taking 30 pip stop you can close it hedge it or start wobbling the other way as well. Risk reward theoretically very low win rate incredibly high! Expentamcy ration may also get screwed up but still making money. It’s a technique of trading and scaling in as an institution may do to eventually get in a trend taking profits as you go and eventually leaving some winners open trailing stops to get some bigger profits on the breakout etc. But it is not an easy technique and many lose their pots with it by not measuring the risk and entries and loading up a position too quickly
Hi Rayner,
I would like to clarify one point in position sizing. The amount of capital consumed by each pair in Forex is different. For example, for EURUSD my broker consumes $2.2 per 0.01 lot while for pairs with high spreads it can go up to $4 or $5 dollars per 0.01 lot. How do we know the amount of capital consumed per trade when we are placing multiple trades from different currency pairs and how do we calculate Position Sizing in these scenarios?
Thanks for the usual perfect materials!
My pleasure!
[…] Risk Reward Ratio (RRR) […]
hey rayner.i’m following u since few days.and i read carefully which u post.and this post is really very helpful for me.thanks for ur appreciating works.welldone
Thank you, Navdeep!
It is very useful
Awesome to hear that!
new trader and am loving this…keep it up
Cheers!
Pls I have been following you since a month but I want to know which trading app or website you are using and how can I apply the stop loss accurately Pls help us with a video
am stil confused vonnrisk to reward ratio most especially on lot size calculation please help me out
thanks Ryner I would like u to guide me on lot size calculation
You can use a position size calculator to make your life easier. There are many out there, just google and see if that helps.
Rayner,
What an eye opener, this explain why I keep losing money to a reasonable degree. Thumb up bro.
Never too late, Samson. cheers!
In many blog I learned following formula here it is different, why?
Expectancy = (Probability of Win * Average Win) – (Probability of Loss * Average Loss)
Great advice. Please consider someone who only trades stocks. Pips is not in my vocabulary. Most of your examples are in non stocks markets. When giving an example please include stocks. Thank you very much.
thanks a lot
Hi Mutuza,
Thank you!
Cheers.
Is it possible to use the ATR Indicator to set R:R?
Yes!
Hi Rayner. Thanks for this article its very informative. Quick question… do you include brokerage costs in your R:R? I’m trying to intraday Aus stocks with CFD’s at present but the brokerage runs at ~0.08% of value. Given it’s percentage based a 1:5 R/R inclusive of brokerage added to the potential loss, and deducted from the profit brings the R:R back to 1:1. In short I’m having to adjust my strategy of scalps/chops to longer runs. Interested in your thoughts, Thx 🙂
Hi Rayner! Thanks for the teaching, I set my risk reward ratio using 1:1, I mostly put it below my retracement (vice versa).
Rayner… I appreciate my colleague who introduced me to your videos and articles… As for what to tell you, I lack words… You’re already too good! In Nigeria, we say “doh”.
I’m so glad to hear that. Omo!
hello thanks
You are most welcome. Egyhm!
Always finding great tips and advice in your analysis. Thank you so much!
You are most welcome, Dev!
Thank you Rayner .every time I read your post, I experience progress toward consistent trader. I like the way you took me out of trading illusions.
Now I’m growing mature.
You are welcome, Felix!
Thanks for the enlightening read! You never hear about the importance of E/Expectancy in trading. Like you said, it’s always R:R only. I have probably given back a small fortune in profits by insisting on waiting for at least 2R to take profits, since I started trading 8 months ago. This is exciting information that I’m looking forward to implementing. I will be staying tuned in to your channels.
Awesome, Drew!
i haven’t used , till now and lost 100% twice.
[…] unknown because you know what’s your maximum drawdown, average winning rate, losing rate, risk to reward, […]
[…] You have a logical place to set your stop loss (below the low of the build-up), and this offers a more favorable risk to reward. […]
Thank you Rayner! I use chandelier stop loss and rsi of between 25-50 to gain max profit. It’s astounding I ran trades from $1000 to $19000 in less than 10 days averagely. You’re a beast master!
That’s Awesome, Ed!
Hello Rayner.. I did a back test on my strategy.
I want you to confirm the result and give me your advise.
Total trades= 100
Total win= 38
Total loss= 62
Risk :Reward= min 1:3
Capital=50000
Profit=61100
loss= 1800
Percentage win: 38/100= 0.38%
Avg win ratio: 61100/38=1608
Avg loss ratio: 1800/62=290
Expectancy rate:
E=[1+(1608/290)]*0.38-1
E= 1.109 or 110.9%
In your opinion is this a good strategy?
Yes
Hey Rayner
My name is Bernardo I live in South Africa your materials. Are really helpful I hope you will help in my trading journey. I watch allots of your contents on YouTube
We’re glad you find our materials useful, Bernardo!
If you are a beginner in trading, you might wanna check our free course in our Academy. Here is the link:
https://www.tradingwithrayner.com/academy/
Cheers!
Hey hey wasup my freind …thanks with the information all your guide are awesome for me i dont have a fixed risk to forward ratio it depends on the markert structure of the PAIR Im trading as well as my equity profit making potential differs each time …thanks a lot rayner learnerd alot from you
We’re happy to help, Godfrey!
Cheers!
Thank you, Rayner!
RISK: (a)1, (b)1, (c)1, (d)1, (e)1, (f)1, (g)2, (h)3, (i)5, (j)10, (k)50,
REWARD: (a)50, (b)10, (c)5, (d)3, (e)2, (f)1, (g)1, (h)1, (i)1, (j)1, (k)1
BREAKEVEN WIN RATE %: (a)2%, (b)9%, (c)17%, (d)25%, (e)33%, (f)50%, (g)67%, (h)75%, (i)83%, (j)91%, (k)98%
You are most welcome, Fido!
good
Thanks, Bhawani!
Great content received. I and other Kenyans say thank you.
You are most welcome, John!