
If you’ve been following other traders’ technical analysis for a while…
You’ve most likely heard alien terms like bullish divergence, hidden divergence, reversal divergence, and bearish divergence.
You might be thinking:
“Woah, what the *beep* is a divergence!”
“Look how cool the indicators look on a chart with a divergence plot on it!”
“So, how does a divergence cheatsheet work?”
And yes, I must admit…
It’s not an easy topic to learn and apply.
At the same time, it’s a topic often not well-explained!
Sure, other traders will tell you:
“Ah if the chart does this and an indicator does that, then you should sell.”
But that’s not what this training guide is all about.
Instead…
I will go in-depth and teach you:
- What are all the different trading divergences and how to spot them with pinpoint accuracy
- How exactly a divergence cheatsheet works (aside from telling you when to buy or sell)
- The different indicators you should use when trading divergences
- How to trade with the divergence cheatsheet and how to incorporate it into your trading
Now…
It doesn’t matter whether you’ve been learning trading divergences for weeks or months.
This guide will be essential and straight to the point!
So, are you ready?
Then let’s get started.
Divergence cheatsheet: What is it and the REAL reason on how it works
Now, to save you the hassle…
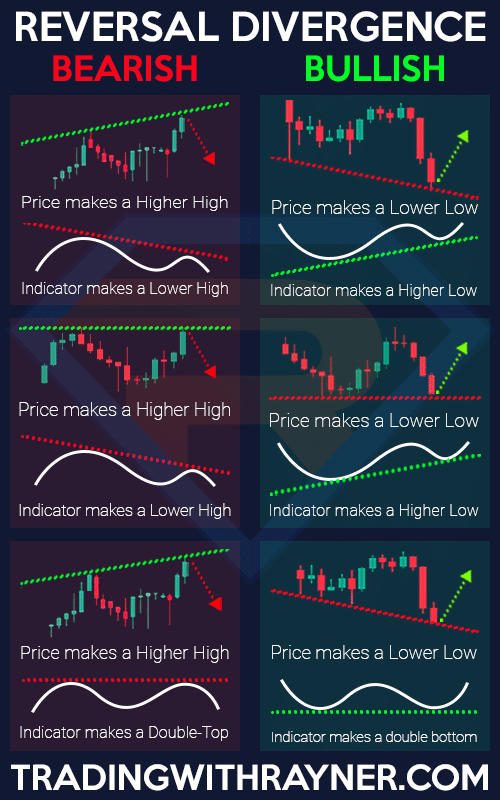
Here’s what the divergence cheatsheet looks like:
Sure…
Save it!
Make it your computer wallpaper!
Print it!
However, how do you exactly know when one out of the six divergences happen in real-time markets?
Aha, that’s the tricky part!
And that’s why you’d want to stick around.
But now that you’ve seen the divergence cheatsheet, let’s get back to the basic question…
What is a trading divergence?
To put it simply:
A trading divergence occurs when the direction of your indicator is different from the direction of the market price.
In other words…
The indicator is “diverging” from the market price!
It’s moving away like a cone!
Get it?!
So now…
I just shared with you WHAT a divergence is.
But let me ask you.
HOW does a divergence work?
What is the logic behind it?
Let me tell you…
How does the divergence cheatsheet work
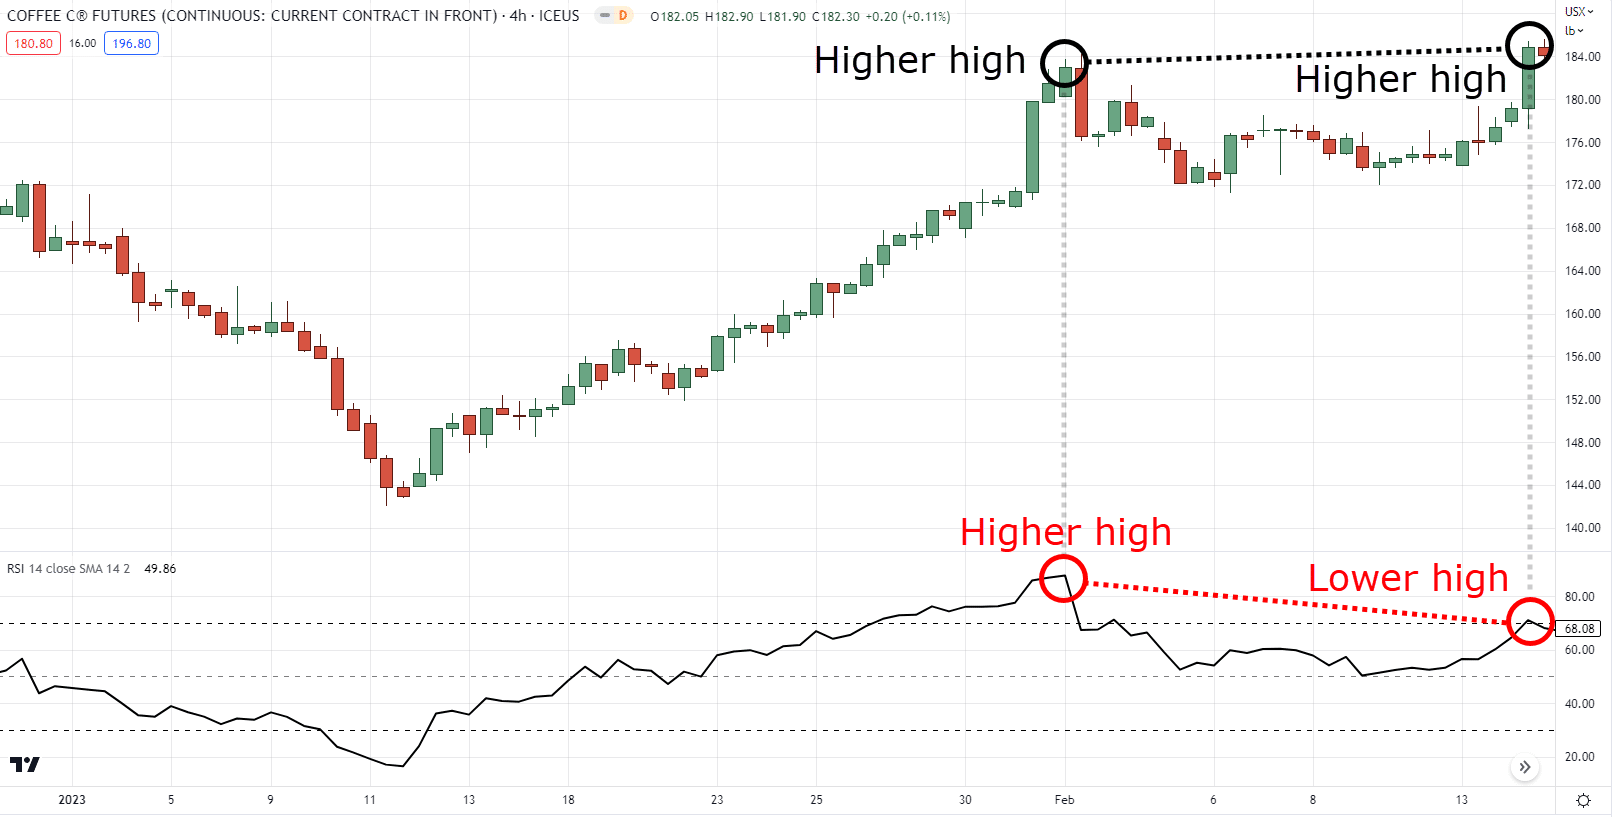
Take a look at this breakout…
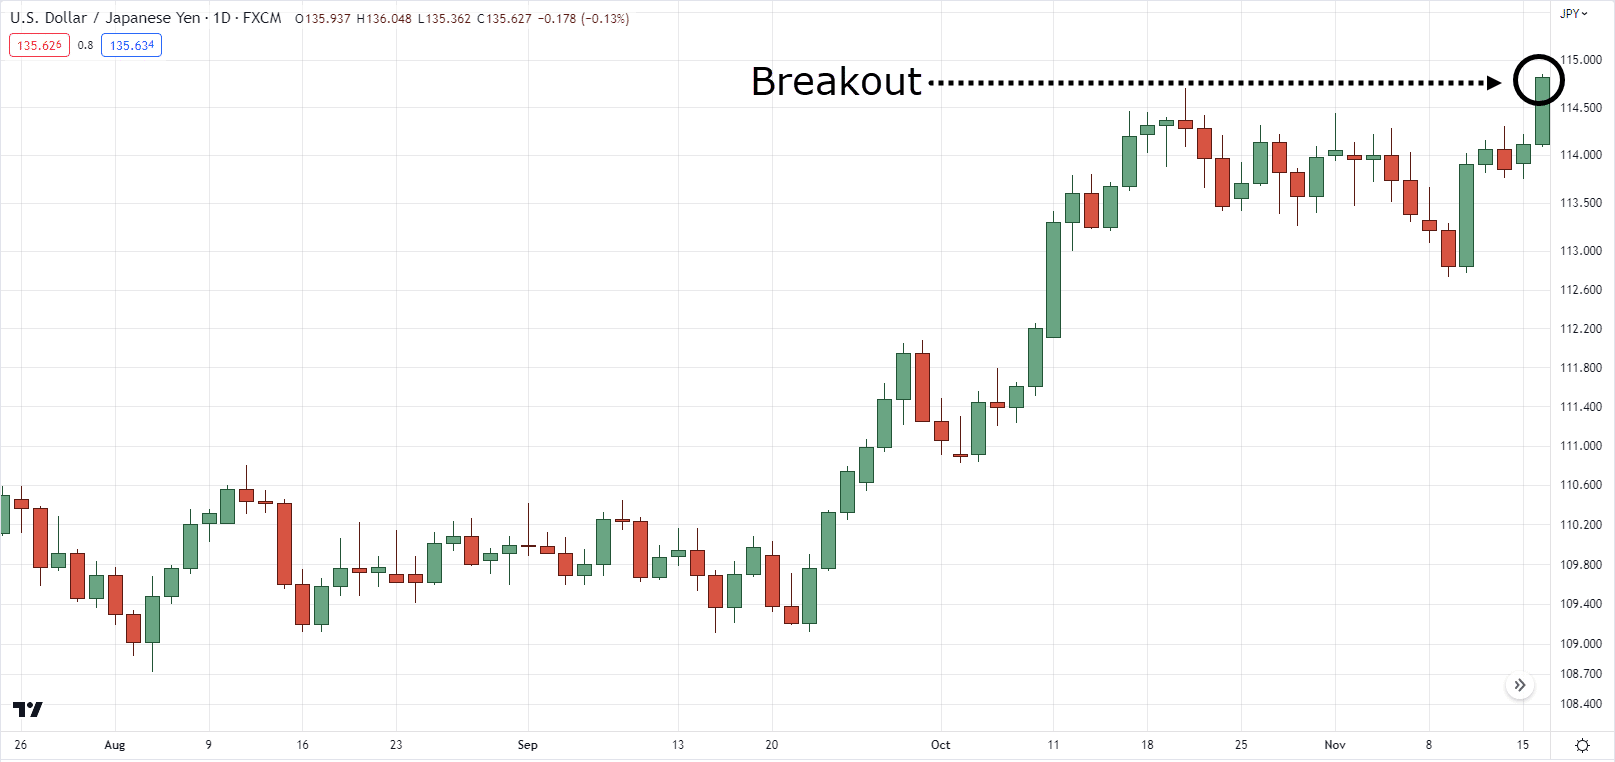
Looks pretty strong, right?
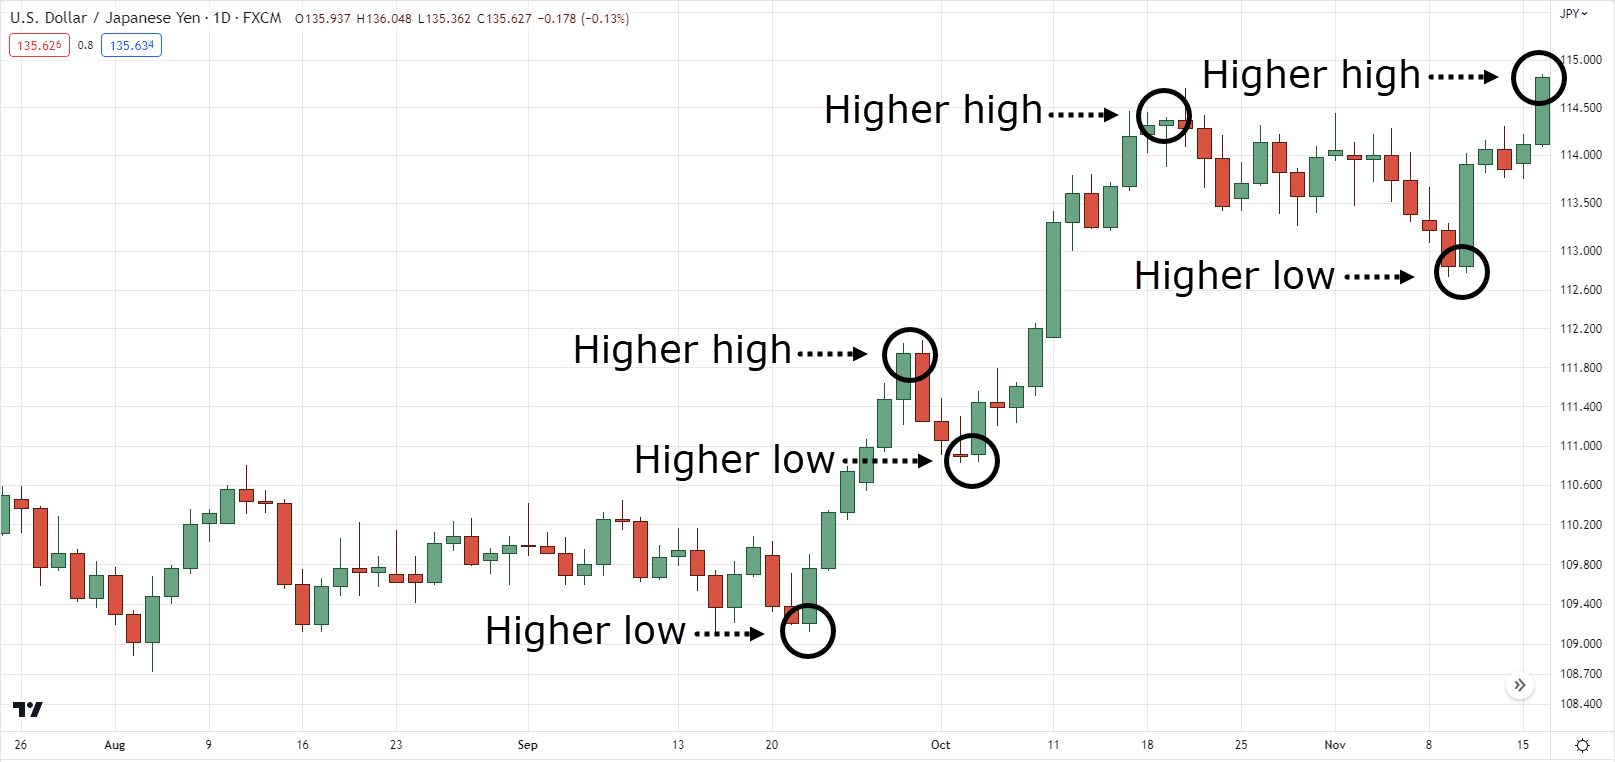
Not only that, but this market also shows a nice trend with higher highs and higher lows!
You can see it with your own eyes!
Now…
What does our indicator see?
Hmm, it seems to imply that the momentum is decreasing!
Recall…
A divergence happens when the direction of the perceived price is different from the indicator!
So, based on the last example…
You see a strong breakout and a good trend!
But your indicator is telling you:
“Hey boss, it’s a nice trend, but based on our calculations, the trend is weakening!”
Aha, a discrepancy!
So, who do you believe?
Your eyes, or the indicator?
Of course, in your mind you’d probably say:
“Screw that indicator, I know what I’m seeing!”
“I’m the trader here, the indicator is just a mathematical equation!”
But here’s the truth…
Your eyes can fool you as all charts can be manipulated!
Let me prove it to you.
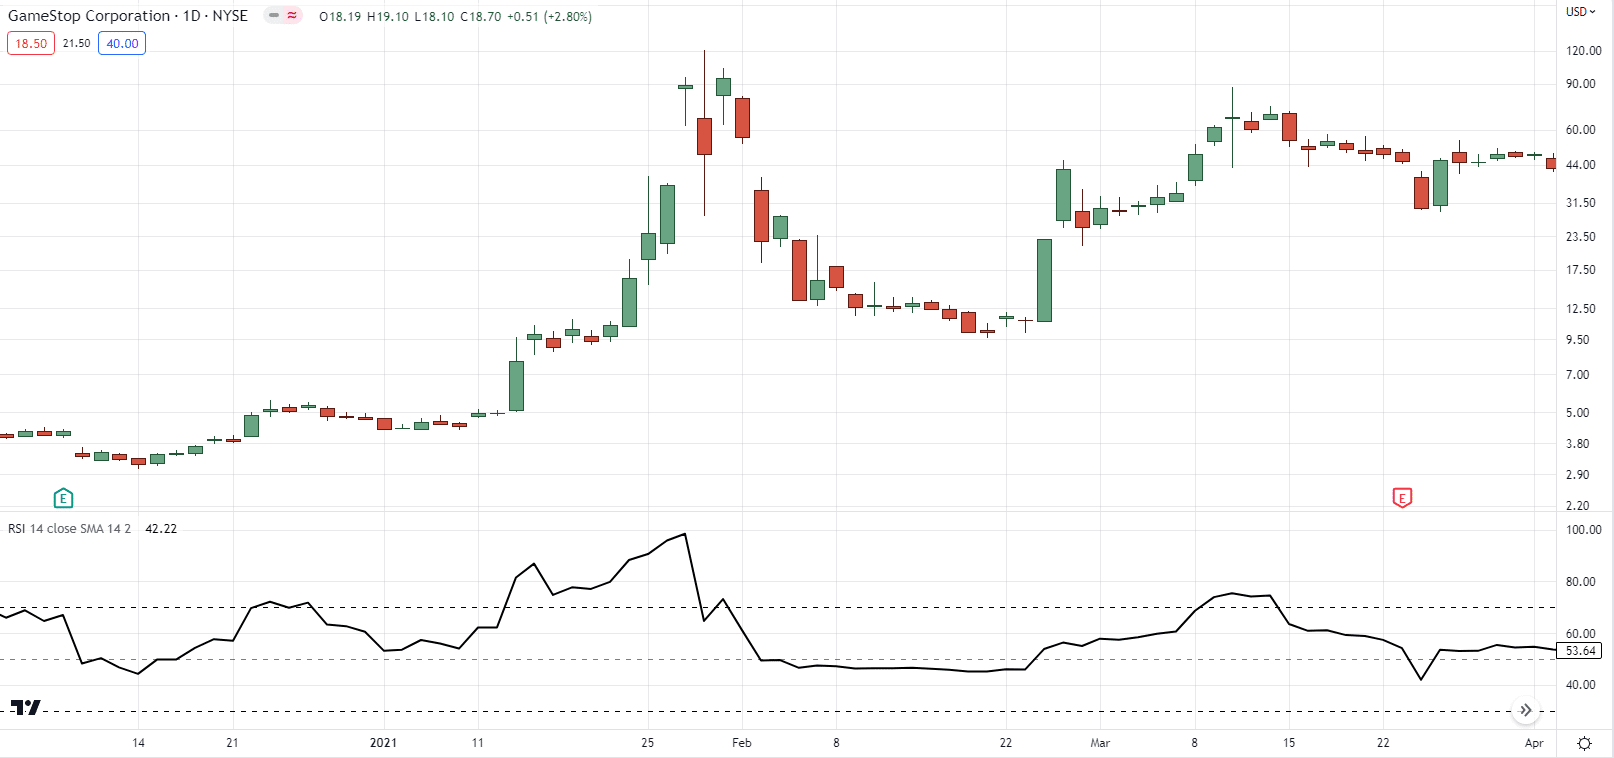
See this price of GME?
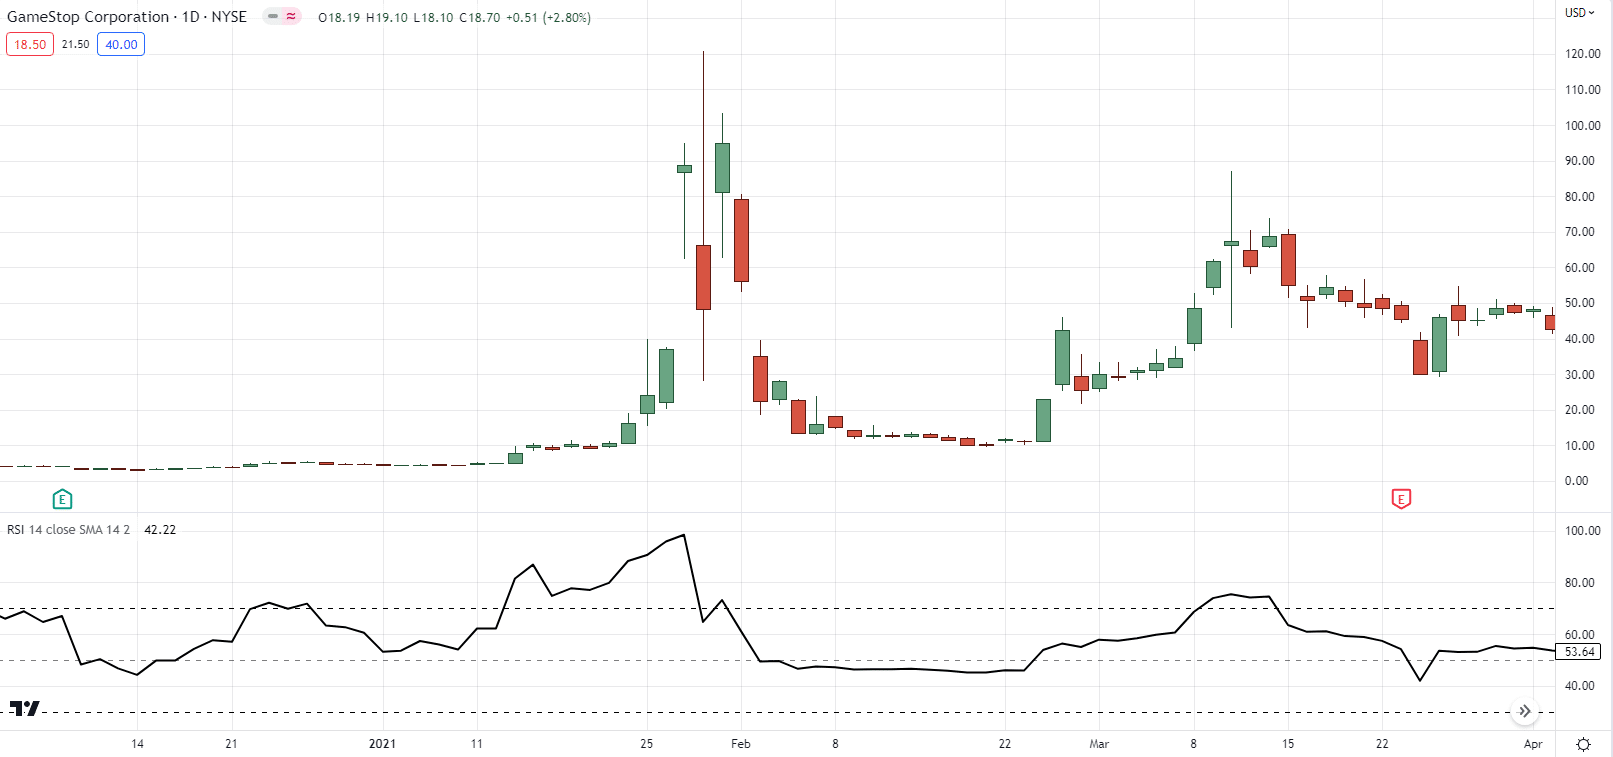
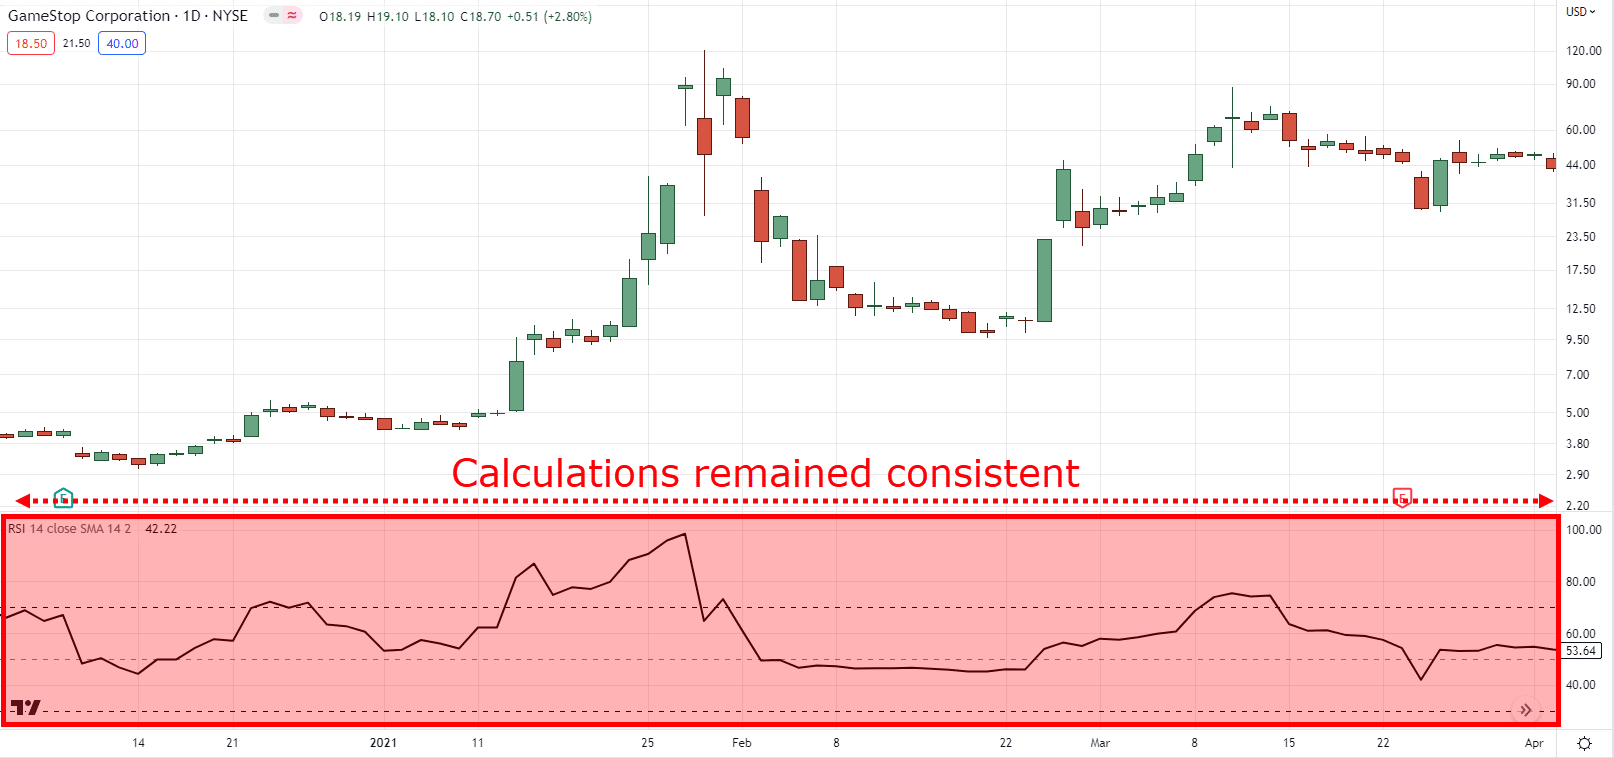
Now, what would happen if I switched it to a logarithmic chart?
Damn, just like regular price action, right?
I didn’t even move anything!
I just turned on the logarithmic chart option!
So, if you saw that chart, your judgment would change!
But the RSI indicator, however, remains the same no matter how much you change your chart…
Not only that!
Your chart can be manipulated in different ways such as looking at your mobile phone which has a smaller screen!
So you see my friend…
The purpose of having a divergence cheatsheet is for your indicator to support your judgment; to see through chart discrepancies, and to determine whether the buyers or sellers are weakening.
Makes sense?
Now, we’ll get to the types of indicators you should use when dealing with the divergence cheat sheet.
But for now…
How do you specifically identify a divergence?
Like, in real-time markets and not just cherry-picked charts?
Well, the key to identifying one of those types in the divergence cheatsheet is to…
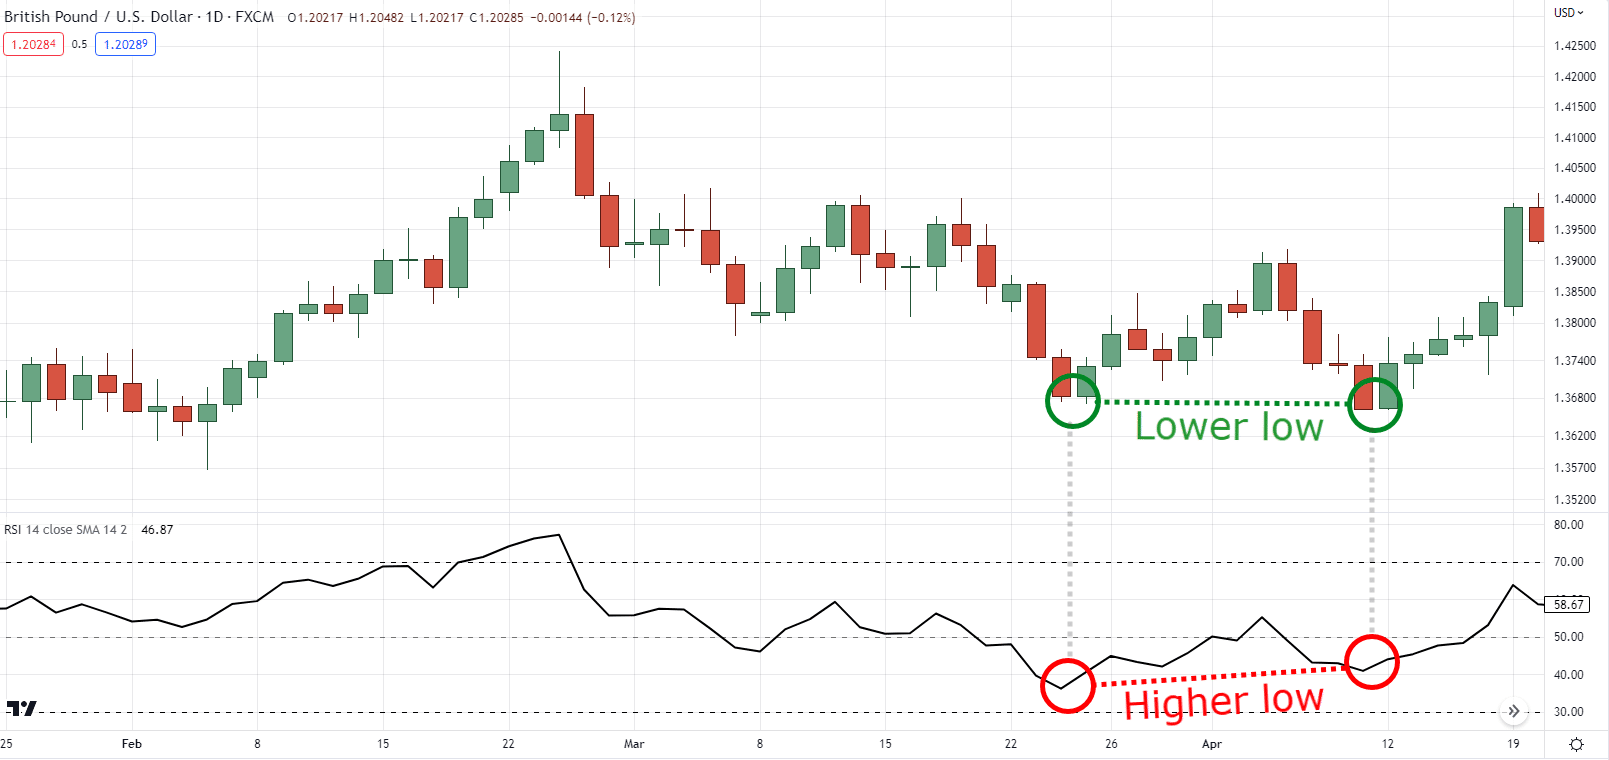
Watch the swing highs and lows of both the chart and the indicator.
Let me explain in the next section…
A simple way to read the divergence cheatsheet accurately
As you know…
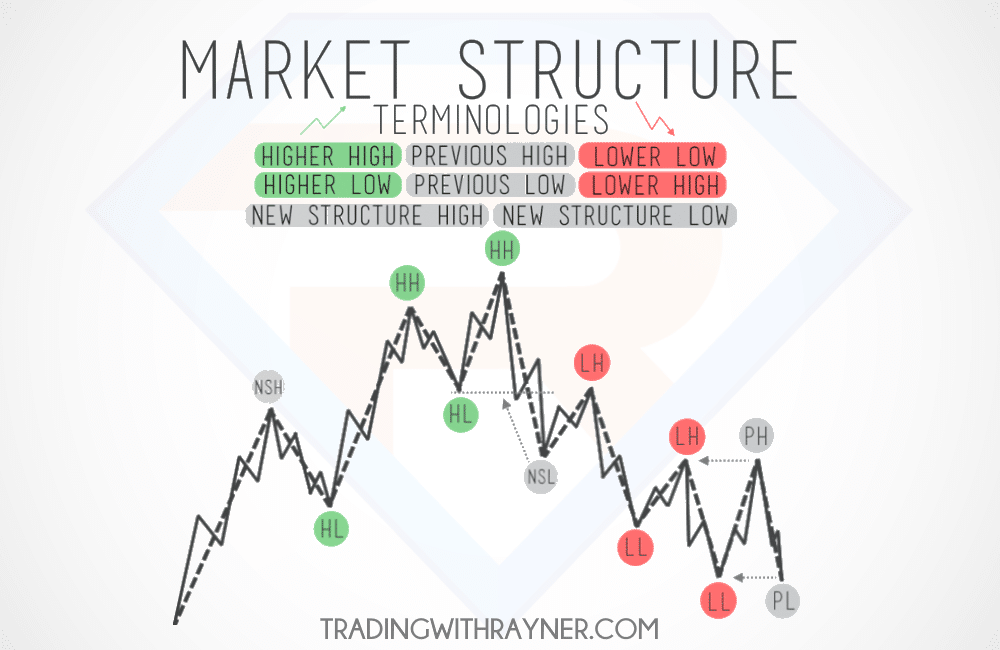
There are different types of market structures out there such as:
- Higher Highs
- Higher Lows
- Lower Highs
- Lower Lows
Familiar?
No?
Ah, then no worries.
I have just the right cheatsheet for you as a bonus.
P.S. If you want to learn how to read price action like a pro you can check this out.
And yes, the sequence of these happening can vary from one market to another:
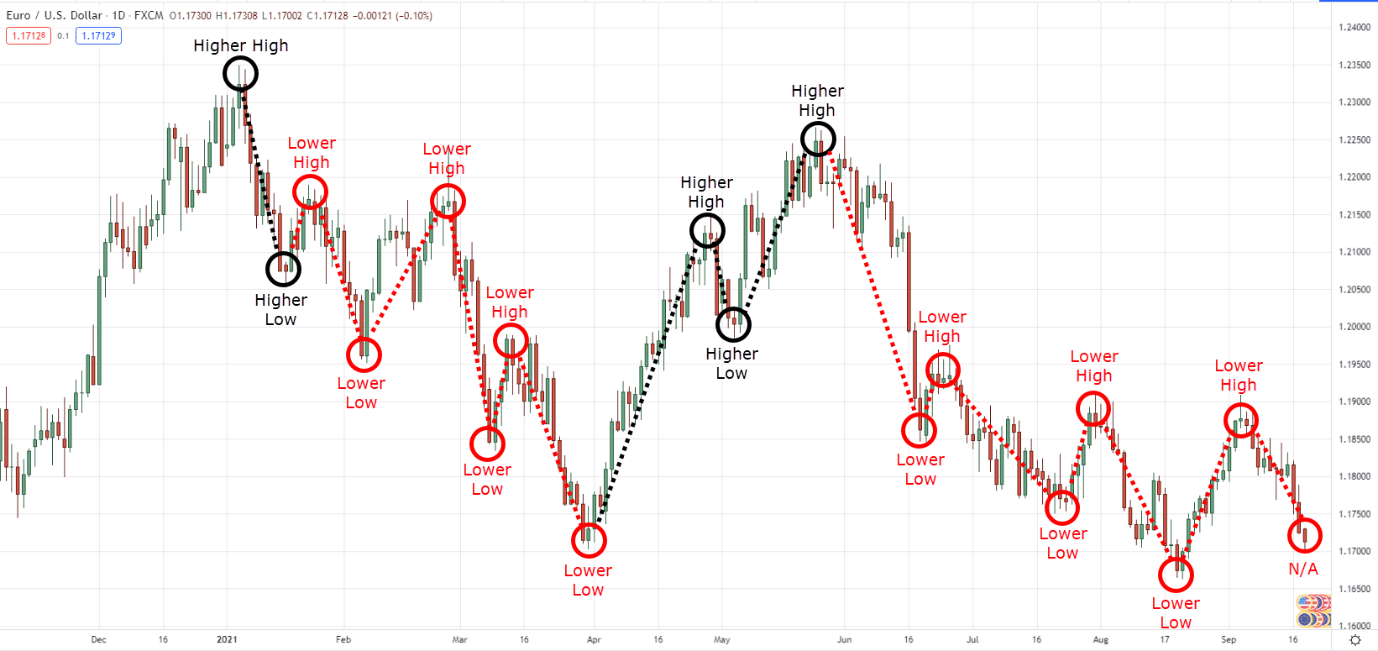
But since we’re here to identify not only market structures but also divergences…
What you need to focus on are the first two market structures.
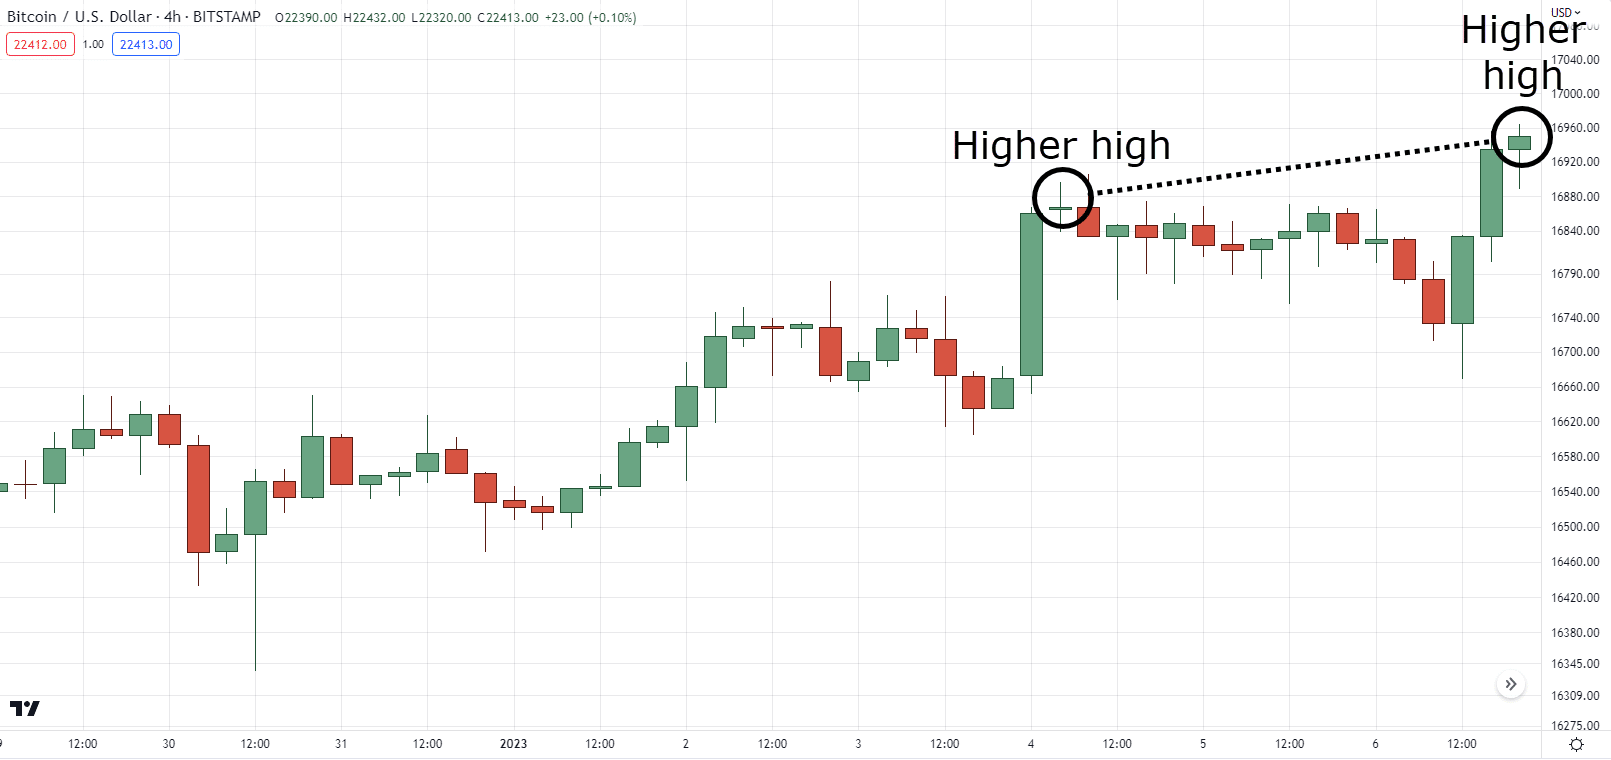
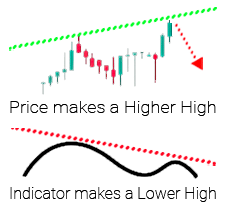
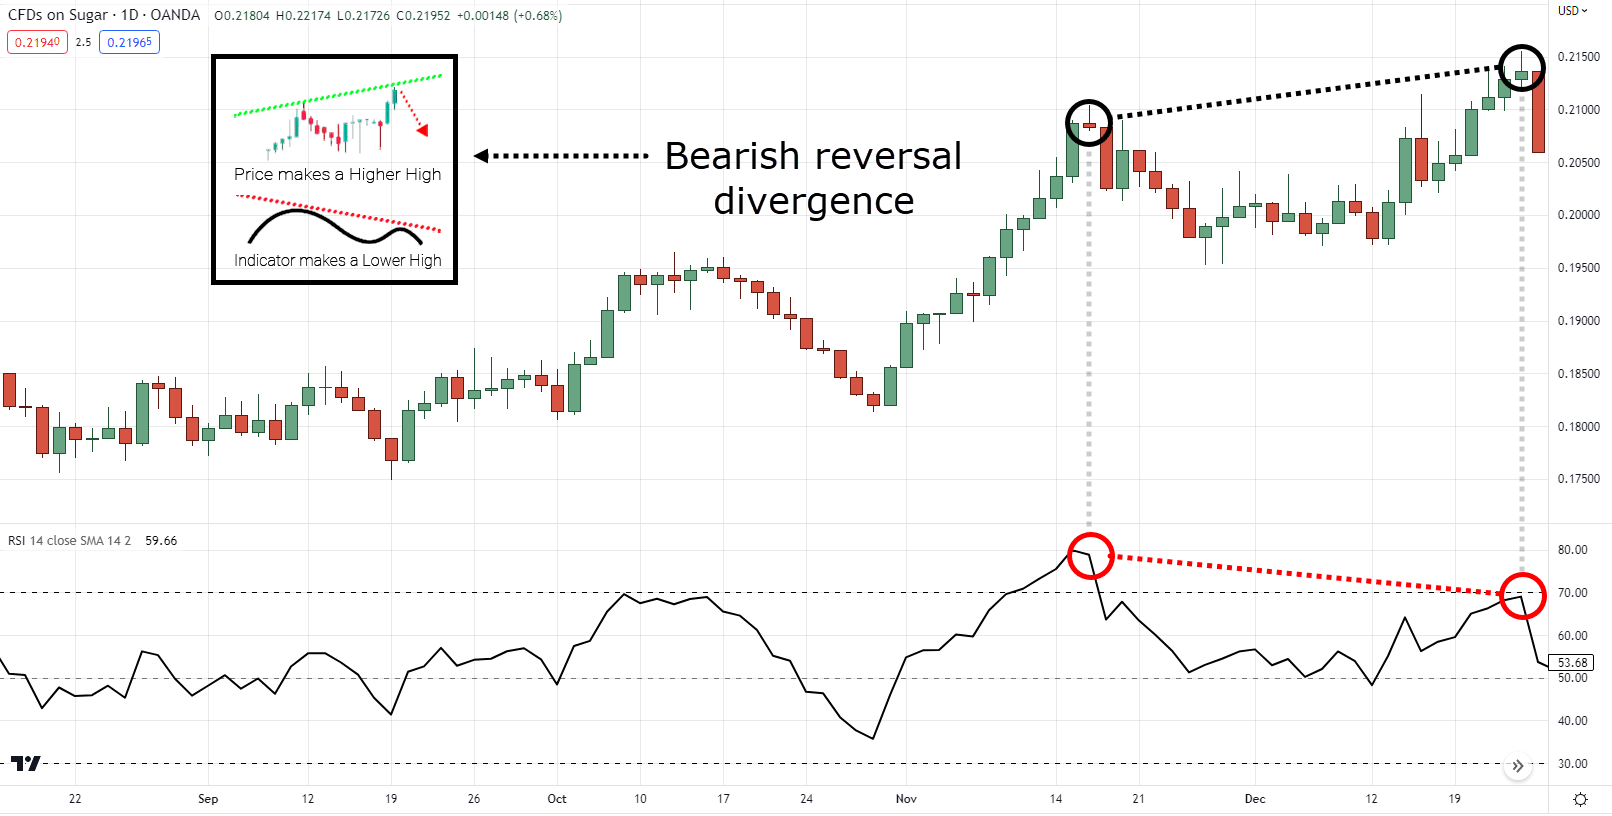
What do you see?
That’s right.
A high, and then another higher high.
Following so far?
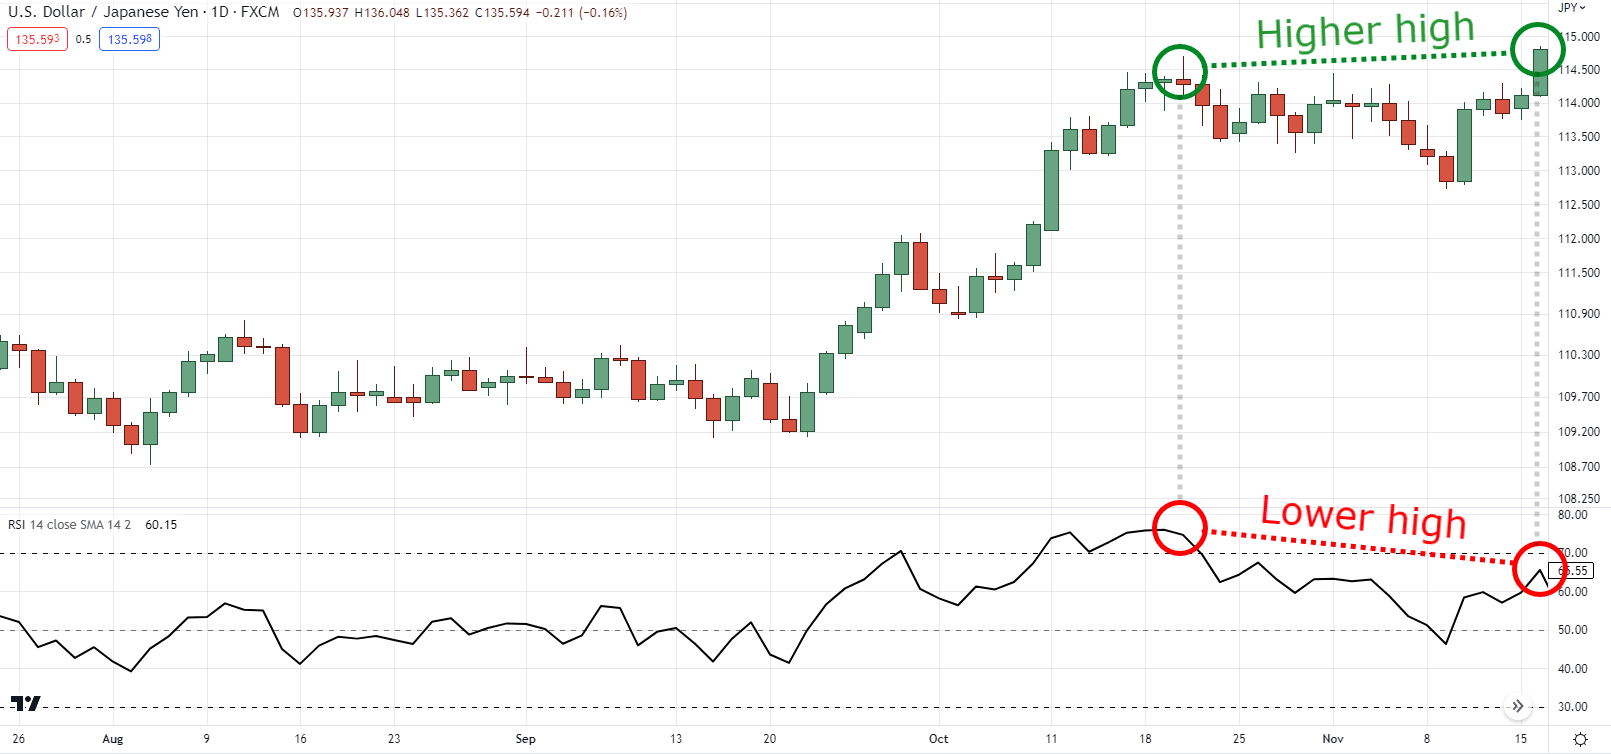
So how about the indicator?
What’s the market structure of the indicator relative to the price?
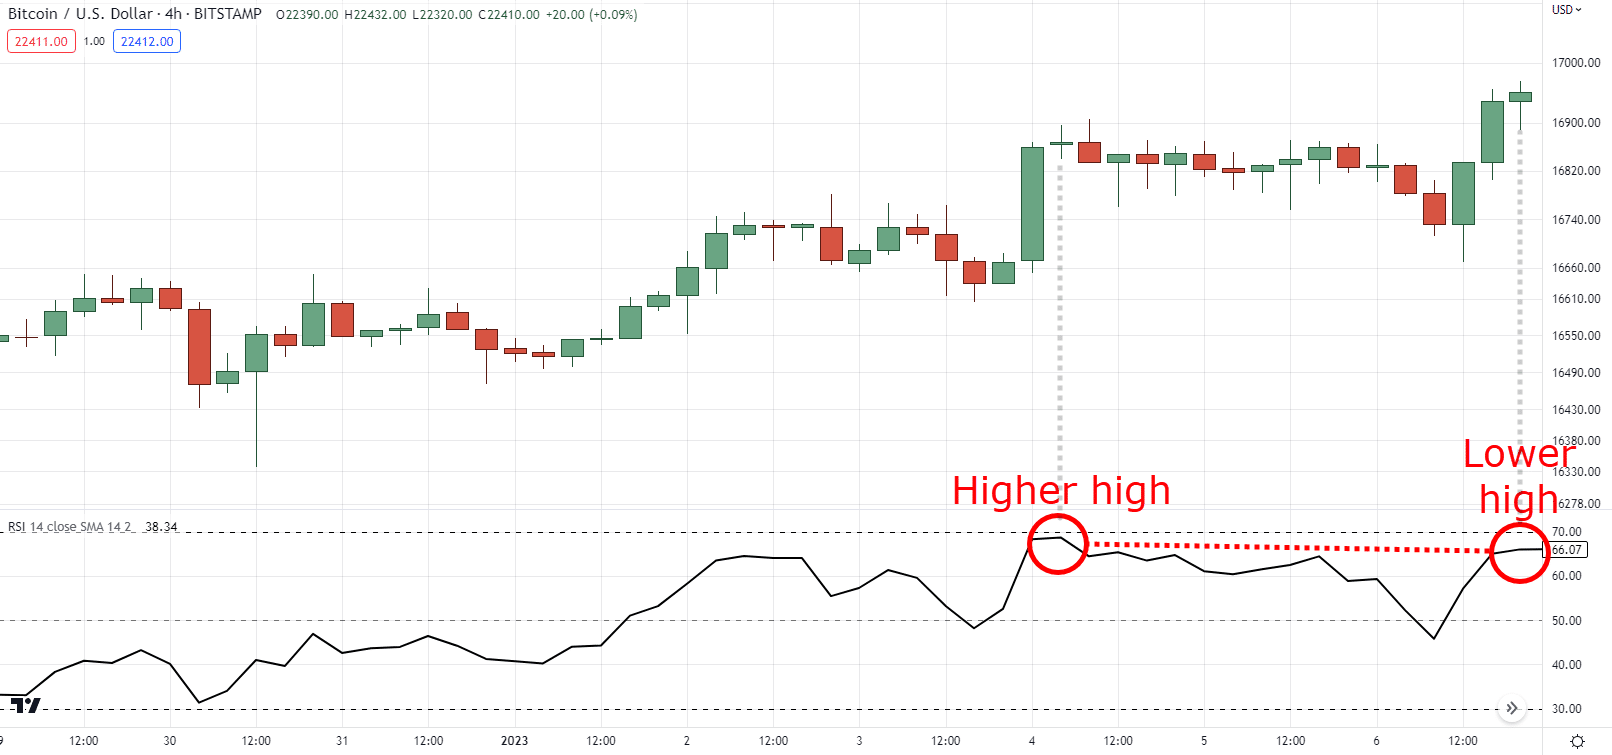
That’s right!
A higher high, and a new lower high!
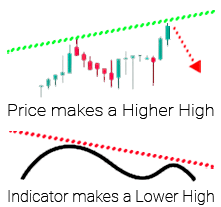
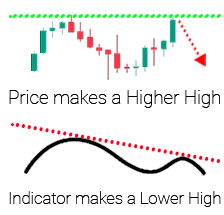
So, now that you have these two pieces of information wherein the price makes a new higher high and the indicator makes a new lower high…
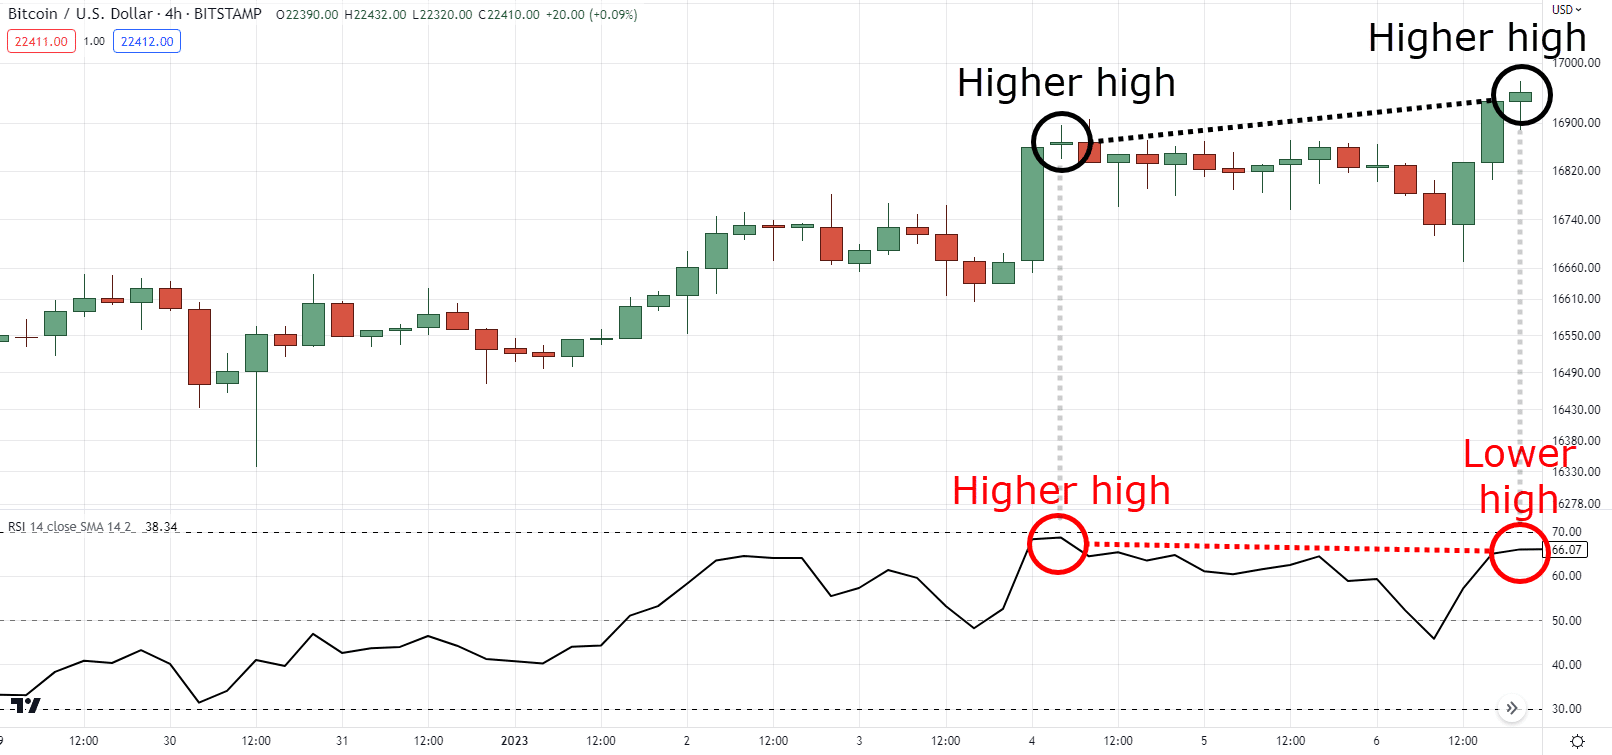
Where does it belong?

Found the answer yet?
…
…
…
That’s right!
A bearish reversal divergence!
Pretty easy, right?
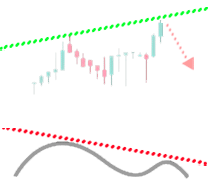
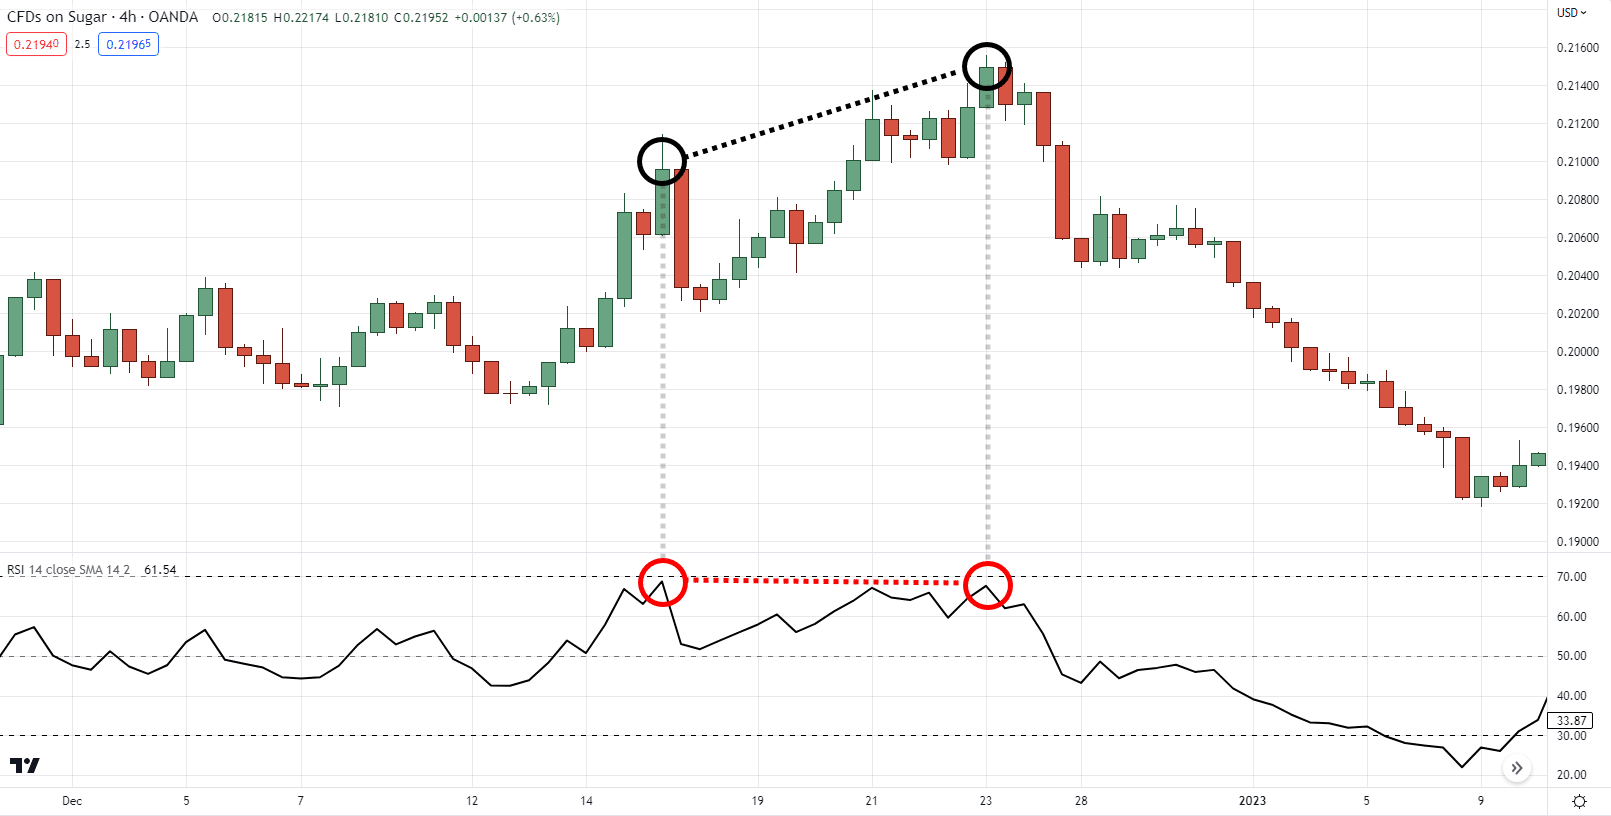
How about this one?
That’s right!
Another bearish reversal divergence!
Now, when it comes to dealing with the divergence cheatsheet…
You must always focus on what the current market structure is doing.
The current price!
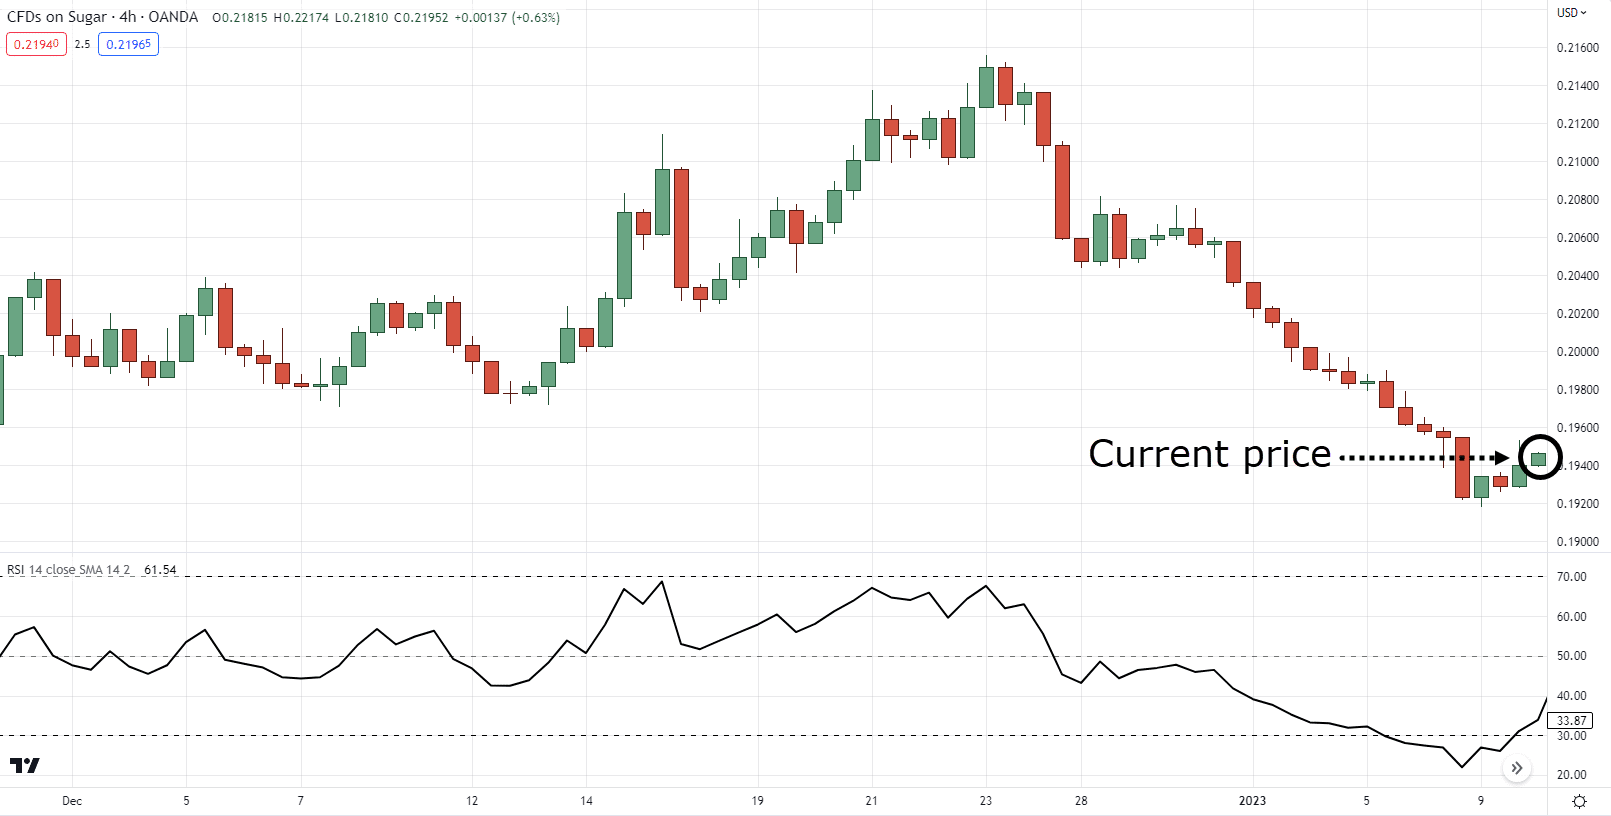
And not what has happened already!
As this might lead to inaccurate plotting of these divergences.
So, if you don’t see anything, don’t do anything.
Trade what you see!
Makes sense?
So, by now you must be wondering:
“Alright, so what the heck is the indicator you used on the example?”
“What’s the period?”
“Is the stochastic indicator okay?”
“Is the MACD okay to apply this concept?”
“Is the RSI okay?”
I know that you might be confused about having those questions in mind.
But take a deep breath… exhale… relax.
As I will make sure to enlighten you in the next section…
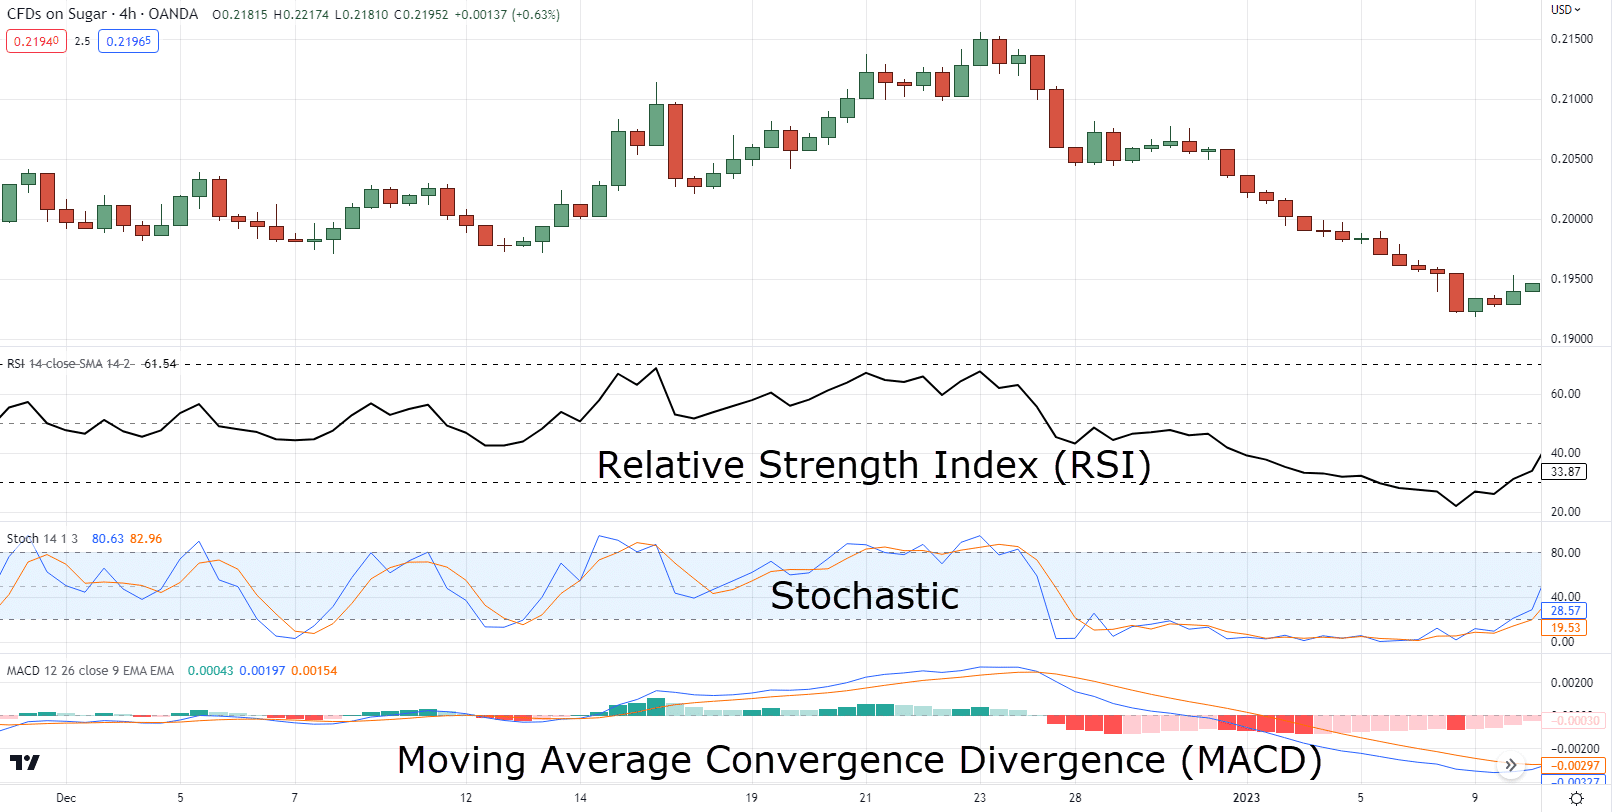
Which indicator should you use when trading the divergence cheatsheet?
Knowing which indicator to use must fall into two criteria:
- The indicator must be an oscillator
- You must have a full understanding of the indicator
The second one is the most important, but let me explain…
1. The indicator must be a momentum oscillator
What is an oscillator indicator you may ask?
An oscillator indicator is a tool that forms “waves” or bands that bounce off between extreme numbers such as from 0 to 100 for example.
In layman trader’s terms…
If it’s an indicator that doesn’t overlap or display on your chart, it’s an oscillator!
Examples of the oscillator indicator include:
- Relative Strength Index a.k.a. RSI (the indicator we’ll use in this guide)
- Stochastic Indicator
Makes sense?
Now, here comes the important part…
2. You must have a full understanding of the indicator
This is where most traders fall short.
Remember, when you are trading…
You’re not just hitting buy and sell buttons.
You are putting your hard-earned money on the line at risk so that you could grow it.
So, don’t you think it’s important to know how exactly your indicators work?
Whether or not you can trust those indicators with your hard-earned money?
Of course, it is!
That’s why when choosing an indicator, it’s crucial to know how the numbers are calculated.
(By the way, this applies to any indicator out there.)
So…
How is the RSI indicator calculated?
RSI = 100 – [100 / [1 + RS]]
Where RS = Average Gain / Average Loss
Now as much as I’d love to share how it works in-depth and the logic behind the calculation…
This article would do more justice to help you truly understand the indicator:
The Essential Guide To RSI Indicator
But essentially…
The principle of the RSI indicator is that it systematically gauges the momentum of both buyers and sellers.
That’s right.
We’re not just talking about oversold or overbought here.
We’re talking about the behaviors of buyers and sellers themselves!
Because that’s what the market is made of!
So, now that you understand the indicator we’ll use…
Let me show you how you can use the divergence cheatsheet to trade and profit from
The markets.
Shall we?
The divergence cheatsheet strategy (the right way to trade it)
Whenever I see traders making their analysis using the divergence cheatsheet…
I always notice something:
They only use it to call the direction of the market but never actually use it to enter trades!
So yes, while it’s right to use it as a “confluence” to your market analysis…
That’s not what I’m going to show you today.
I’ll teach you how to “trade” the divergence cheatsheet!
Because what’s the use of learning something if you can’t make a profit from it in the markets, right?
Now…
Trading the divergence cheatsheet comes only with three simple steps:
- Spot a reversal divergence
- Go into the lower timeframe
- Wait and trade the flag pattern
- Go back into the higher timeframe and use the indicator to manage your trade
Spotting a divergence can be tricky enough at times.
This is why I will keep the trading aspect of it as simple as possible!
So, let me show you how it’s done…
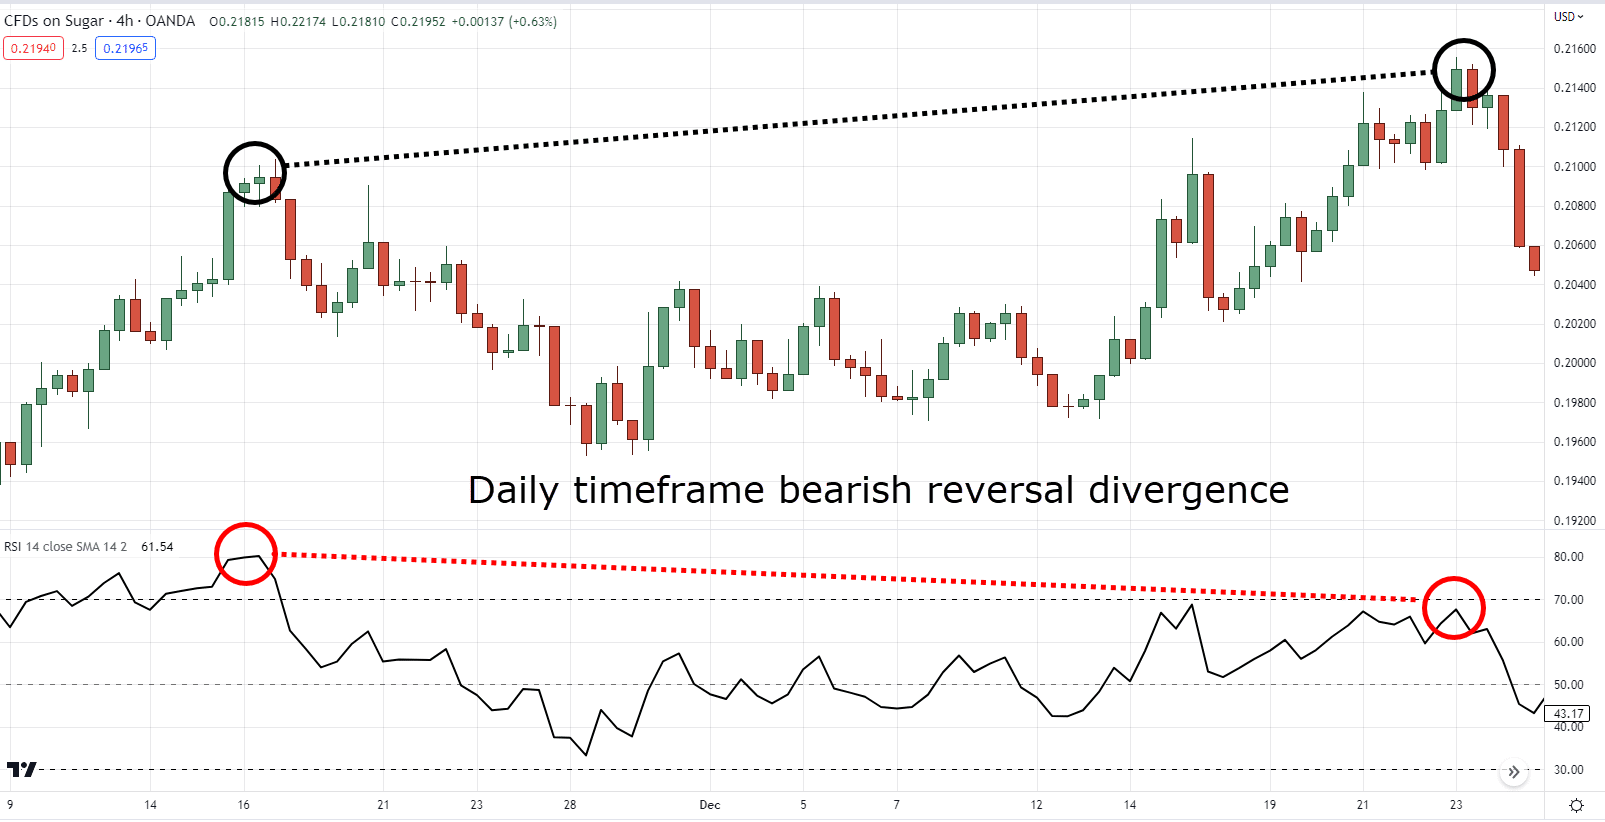
1. Spot a reversal divergence
With the help of the divergence cheatsheet, this step is just a walk in the park!

Yes, there are about six variations in this cheatsheet.
But remember, what makes a divergence is the difference between the direction of the price and the indicator.
So if we look at this chart:
You can see that there is a bearish reversal divergence.
What do we do next?
2. Go into the lower timeframe
You’re probably wondering:
“Why do we need to go down into the lower timeframe?”
You see, just because we spot a bearish divergence doesn’t mean it will go down instantly!
The price can still continue to go up!
This is why we go down the lower timeframe, to wait for extra “confirmation.”
Got it?
Now, choosing which timeframe is another topic of its own.
So I suggest you check this out:
The Essential Guide To Trading Multiple Timeframes
But for this example…
We will go down into the 4-hour timeframe coming from the daily:
Now that we are in the lower timeframe what do we do?
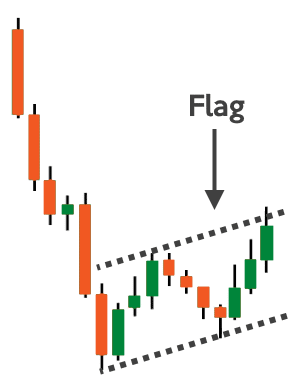
3. Wait and trade the flag pattern
Just in case you don’t know yet, a flag pattern looks like this:
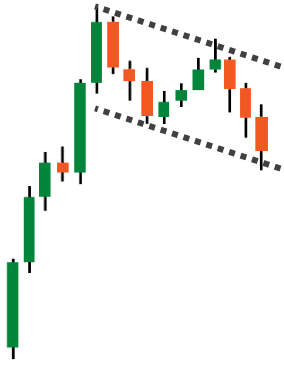
But for this example, we’re looking for a bear flag pattern!
Now, what makes a flag pattern powerful are its two components!
The pole, and the flag:
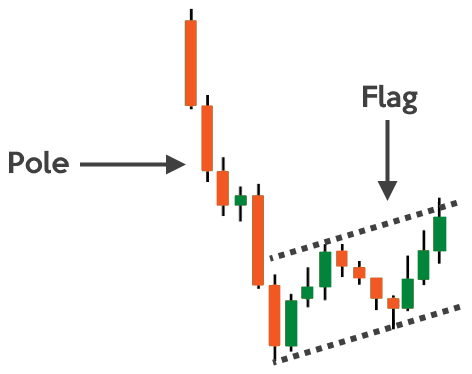
Why, you may ask?
The pole means that the sellers have made an explosive move downwards!
A clear direction to the downside!
However, explosive moves are not sustainable, and it often “snaps” back in the opposite direction.
But if it makes a flag?
Now that changes things!
It shows that the buyers are “sustaining” the upward move as the sellers can’t push it lower!
Now with all that said…
A flag pattern will only be valid once the sellers decide to break out again, which also gives us an entry opportunity:
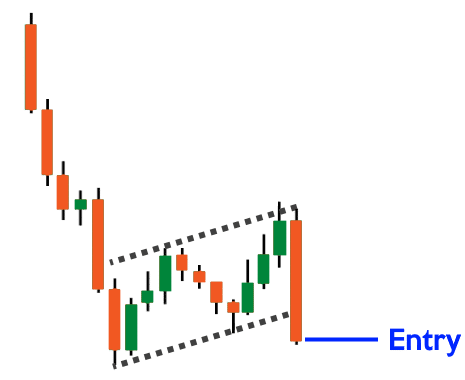
And it’s the same thing for this chart example here!
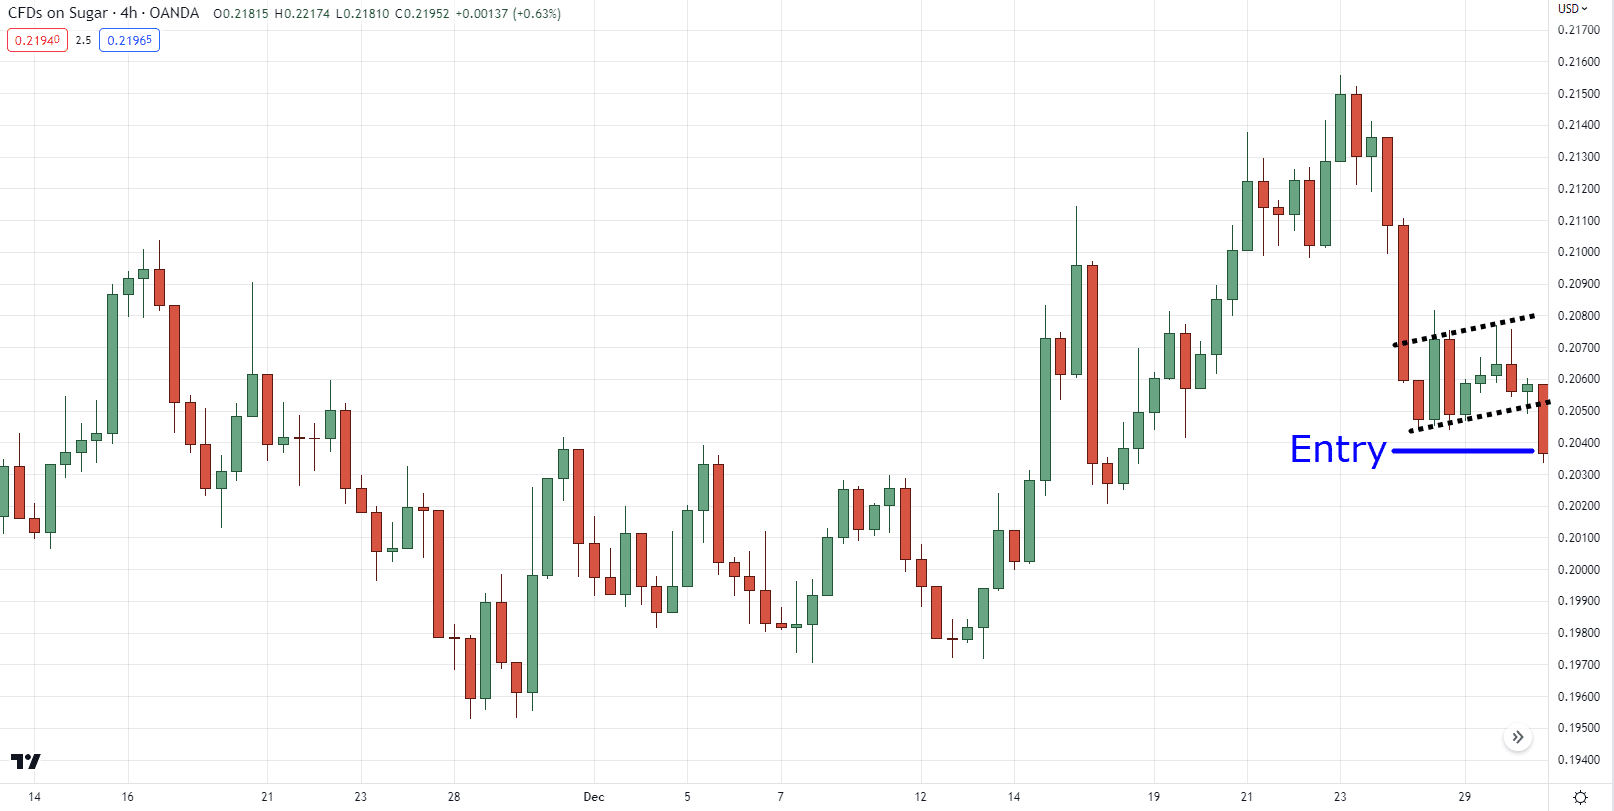
(And yes, I’ve removed the RSI since we won’t need it in the 4-hour timeframe.)
So, after spotting a bullish reversal divergence on the daily timeframe…
We’ve drilled down into the 4-hour timeframe to look for a bull flag to time our entries (and also be confident of it after multiple confirmations).
So, what’s next?
Do I say bye bye and let you figure out the rest?
Of course not!
Because once you’re in the trade you’d want to…
4. Go back into the higher timeframe and use the indicator to manage your trade
This one is more of a bonus as we are using a concept called transition trading.
Where we enter on the lower timeframe and manage our trades on the higher timeframe!
So now that you’ve entered the 4-hour timeframe through the flag pattern…
We’ll be using the indicator again on the higher timeframe:
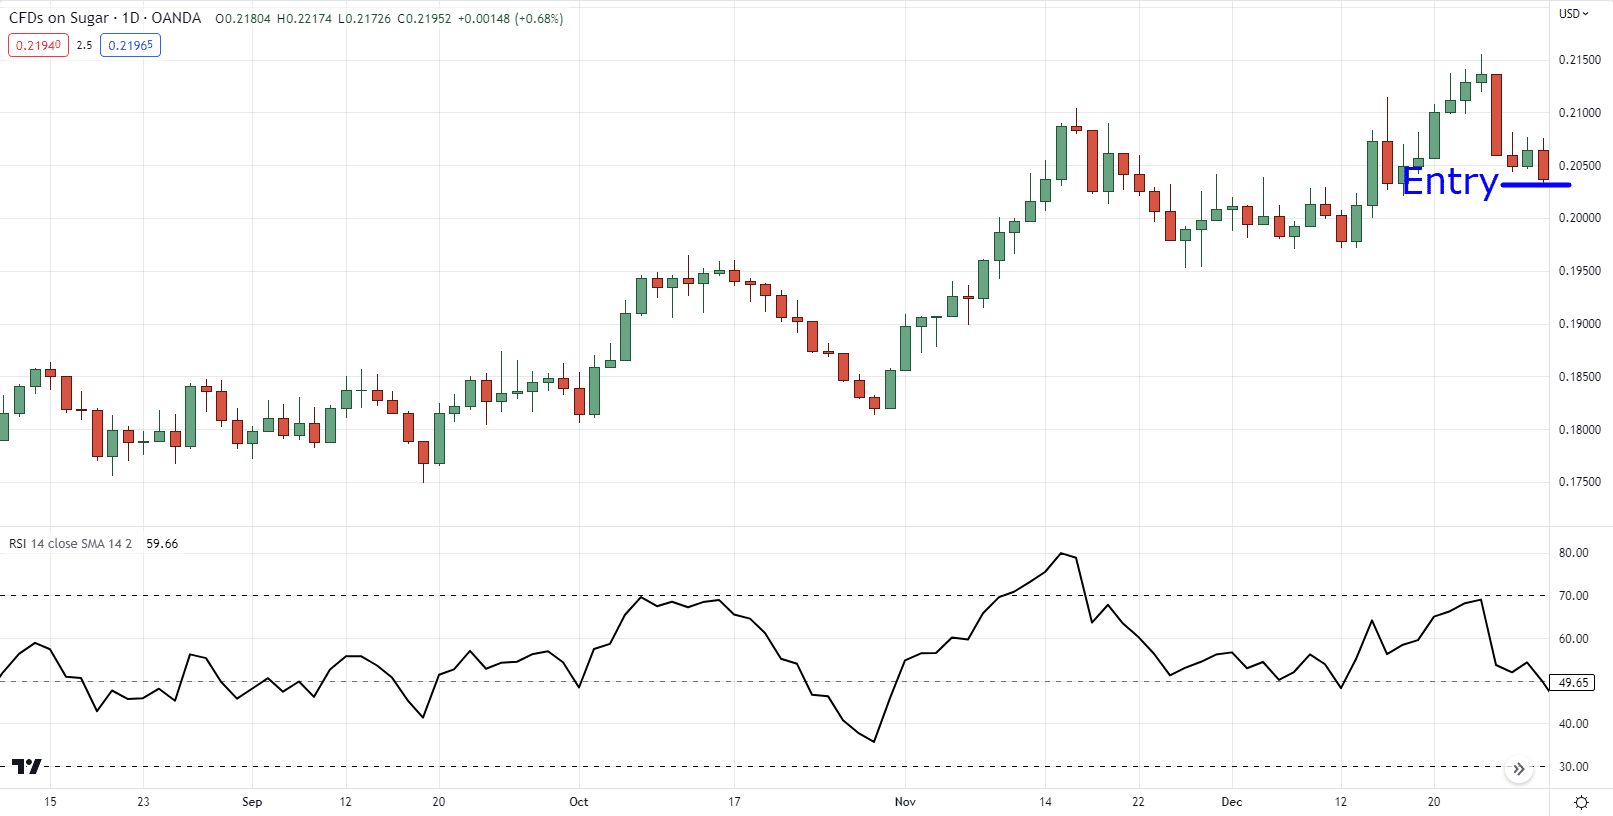
And the exits for selling short are simple!
Once the price approaches RSI 50, then you’d want to consider taking half of your profits and then take the rest of your profits if it reaches RSI 30.
The opposite is the same for bullish trades!
Except that you’ll take the rest of your profits when it reaches RSI 70.
But what if you entered the trade in this state?

As you can see, it’s already at RSI 50 where you should take partial profits.
What do you do then?
Well, we take one less step!
Once it “approaches” the RSI 30 then we take full profits!

Now…
There will be times when the price doesn’t reach extreme levels such as in this case.
So, what do you do?
If the price makes a strong candlestick against you (such as a bullish engulfing in this case), then you exit your trades.
I know…
It isn’t as simple as it seems in this example.
But I want to make sure I prepare you for different scenarios when trading the divergence cheatsheet.
So that you’re prepared to manage your trade in any scenario!
There you go!
So, just a recap of this strategy…
- Use the divergence cheatsheet to spot a reversal divergence
- Go into the lower timeframe to look for entries
- Wait and trade the flag pattern’s breakout
- Scale out once the price reaches RSI 50 and trail the remaining half to RSI 30 or exit the trade prematurely if a strong candlestick pattern is formed against you
With that said…
Here’s something to keep in mind…
Despite the strategy that I’ve shared with you, there are different ways how to use divergences to your advantage.
As well as different forms, which is the “hidden” divergence that I have not discussed.

Why?
Well, the reversal divergence is when the indicator aims to look for the discrepancy in the price’s momentum on the chart.
But the hidden divergence is the opposite, which doesn’t fit with the principles I shared today!
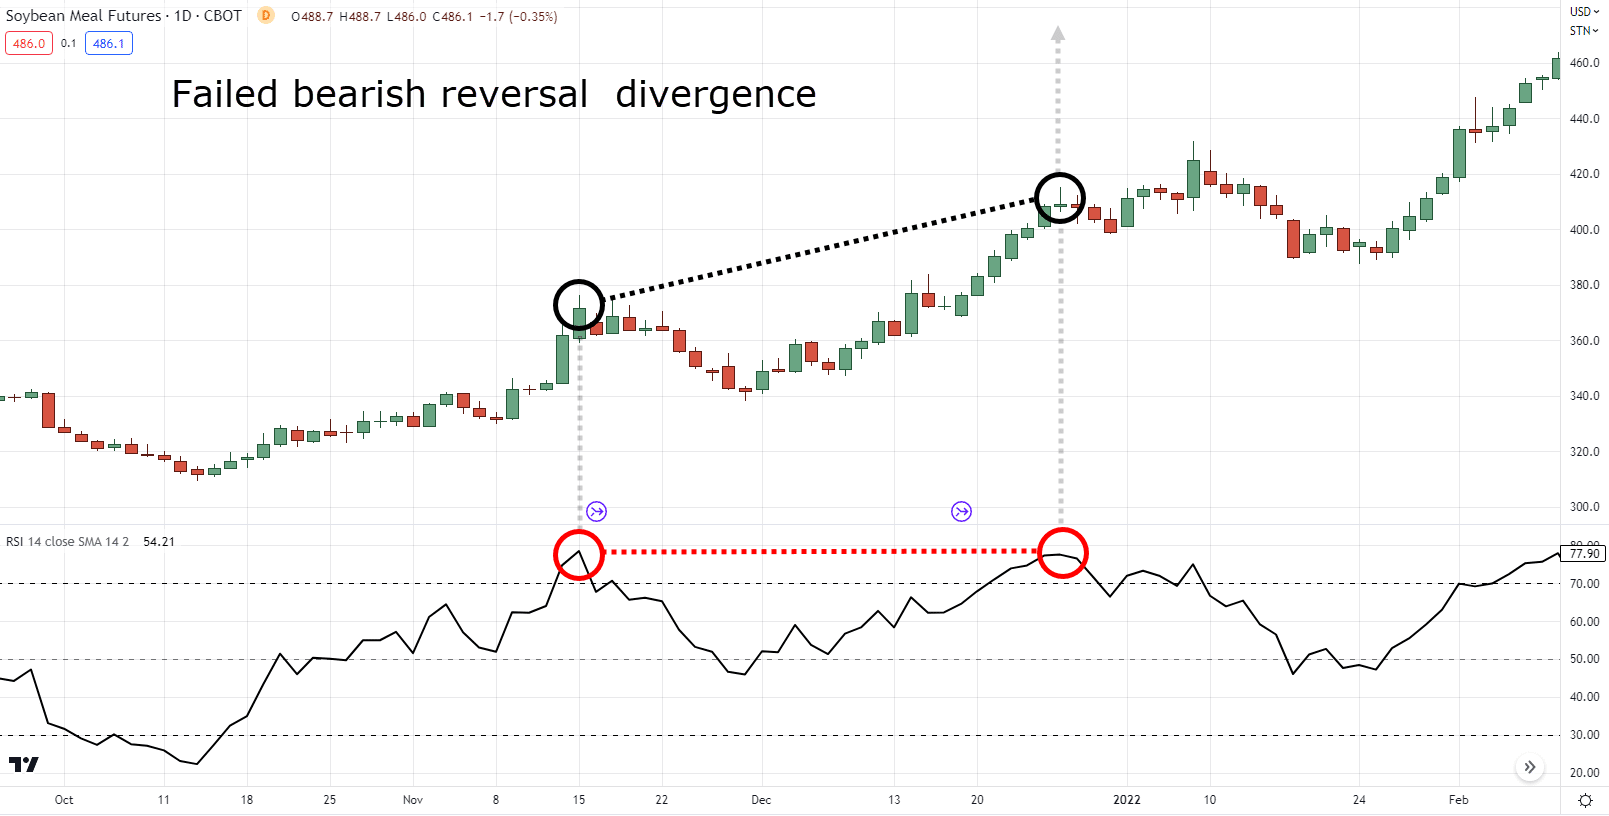
Finally, do know that trading divergence is not the holy grail and they will fail at times.
This is why I suggest you build up your skill in managing your risk through these guides as well:
Forex Risk Management and Position Sizing (The Complete Guide)
The Complete Guide to Stop Loss Order
The Monster Guide to Candlestick Patterns
Great?
Then let’s do a quick recap on what you’ve learned today!
Conclusion
In today’s guide…
I’ve not only shown you how the divergence cheatsheet works but also the principles behind it in terms of the dynamics between buyers and sellers.
So as a quick recap, here’s what you’ve learned in today’s guide:
- A divergence happens when the direction of the indicator (which aims to determine buying or selling momentum) is different from the direction of market price
- Referencing the highs and lows of both the chart and indicator is the easiest way to spot divergences
- Indicators such as the RSI and Stochastic can be used with trading divergence, but understanding how they work is crucial
- Trading divergences can be traded by timing entries into the lower timeframe and managing that trade into the higher timeframe
And there you go!
An in-depth guide on how a divergence cheatsheet works!
Now over to you…
What are some of the indicators have you tried successfully trading divergences?
What are some of your experiences trading divergences?
Perhaps you’ve stopped for a time and you’re considering using it once again?
Let me know in the comments below!
Just one thing that am not satisfied with is that why can’t we get Rayner Teo’s books in India?
Hey there, unfortunately we cannot ship to India as of the moment due to shipping problems we’ve had in the past where the books just kept on getting returned to us, but rest assured that this may change in the near future!!
very nice understanding regarding divergences. I also follow you on youtube. Your candle stick cheatsheet really made my trading better. regards
Great to hear that, Manish!
Hi, Manish!
Jarin here from TradingwithRayner Support Team.
Glad that Rayner’s Candle stick cheatsheet made your trading better.
We wish you the best!
Plz makes video in this strategy thanks
We will make more articles regarding divergence soon!!!
Excellent approach to teaching important concepts, thanks!
Thank you for the kind words, Eric!