
Technical analysis is a methodology to trade the markets.
It uses historical price (or volume) to help you make a trading decision.
There are hundreds of technical analysis tools available, but most of them fall into one of these categories…
- Volume
- Indicators
- Chart patterns
- Support & resistance
But here’s the thing…
Despite having an abundance of these tools (like RSI, MACD, Stochastic, Fibonacci, etc.), most traders lose money with technical analysis.
Why?
It’s often because they’re making one of these mistakes…
No trading plan (bringing “nasty surprises”)
Let me ask you…
Which is more important, entry or exit?
Most traders focus heavily on entry, believing a good entry guarantees profit.
As a result, they use technical analysis mainly to time their entries.
But perfect entries are impossible to find for every trade.
Without a plan, crucial questions remain: What if the market moves against you? What do you sell if it reverses after a gain? What if an accidental profitable trade happens?
Clearly, trading needs more than just the best entries.
To be a profitable trader, you must have a trading plan that tells you what to do, no matter what happens.
The next mistake is…
No edge (masking consistent losses)
What’s the true purpose of technical analysis, then?
It’s to help you develop a trading system to gain an edge in the markets.
So, what is an edge?
An edge (aka expectancy) means your trading activity, over time, yields a net positive result.
The mathematical formula is as follows:
E= (Winning % x Average Gain) – (Losing % x Average Loss)
Let me give you a few examples to show how this works…
Example 1
- Winning Rate: 70%
- Average Gain: $80
- Losing Rate: 30%
- Average Loss: $100
E = (0.7 × 80) – (0.3 × 100) = $26
This means you can expect to earn an average of $26 per trade. So after 100 trades, you can expect to earn around $26 × 100 = $2600.
You might be thinking…
“So I need to have a high winning rate to be a profitable trader?”
Nope.
Here’s another example with a high winning rate, but having a negative expectancy…
Example 2
- Winning Rate: 70%
- Average Gain: $10
- Losing Rate: 30%
- Average Loss: $100
E = (0.7 × 10) – (0.3 × 100) = -$23
This means you can expect to lose an average of $23 per trade.
What this shows is that on its own, your winning rate or risk-to-reward ratio is a useless number.
Both are needed to confirm an edge.
Technical analysis helps you develop a trading system that aims for this crucial edge.
So, be honest…
…does your trading system have an edge?
If you don’t know the answer, that’s because you have…
No data (leading to a lack of discipline)
Without data, defining your edge, verifying if your trading system works, or maintaining the discipline to follow the rules becomes impossible.
In fact, it usually leads to abandoning a system after only a few losses.
So, for starters, these are the data you must track…
- Annual return %
- Number of trades
- Maximum drawdown %
- Winning rate %
- Losing rate %
- Average gain $
- Average loss $
Now you’re probably thinking:
“How do I get access to such data?”
There are two approaches.
First, you can journal your trade and accumulate this data over time. However, it’s time-consuming, and you’ll need months or even years to get a decent sample size.
The other approach is backtesting (and it’s the one I prefer). I’ll go into more details later…
But for now, another reason why most traders fail is that they have…
No risk management (blowing up multiple accounts)
Imagine there are two traders, John and Sally.
- They have a $1,000 account
- They have a 50% winning rate
- They have an average of a 1 to 2 risk-reward ratio
- John risks $250 per trade
- Sally risks $20 per trade
The outcome of the next 8 trades is as follows…
Lose Lose Lose Lose Win Win Win Win.
Here’s the outcome of both traders…
John’s result: -$250 -$250 -$250 -$250 = BLOW UP
Sally’s result: -$20 -$20 – $20 -$20 +$40 +$40 +$40 +$40 = +$80
Can you see the importance of risk management?
As a trader, you’ll encounter losses regularly, guaranteed.
But proper risk management contains them, making them manageable.
Breaking it down…
Most traders lose money with technical analysis because they have…
- No trading plan
- No edge
- No data
- No risk management
These issues all point to the same root cause: a lack of a proven, quantifiable trading system backed by data.
But once you have it, all of these problems will go away.
Now you’re probably wondering:
“So, how do I develop a trading system that works?”
Here’s my answer to it…
The RETT Technique
This is the technique I’ve used to develop multiple trading systems so I can profit in bull & bear markets, even during a recession.
Here’s the proof…
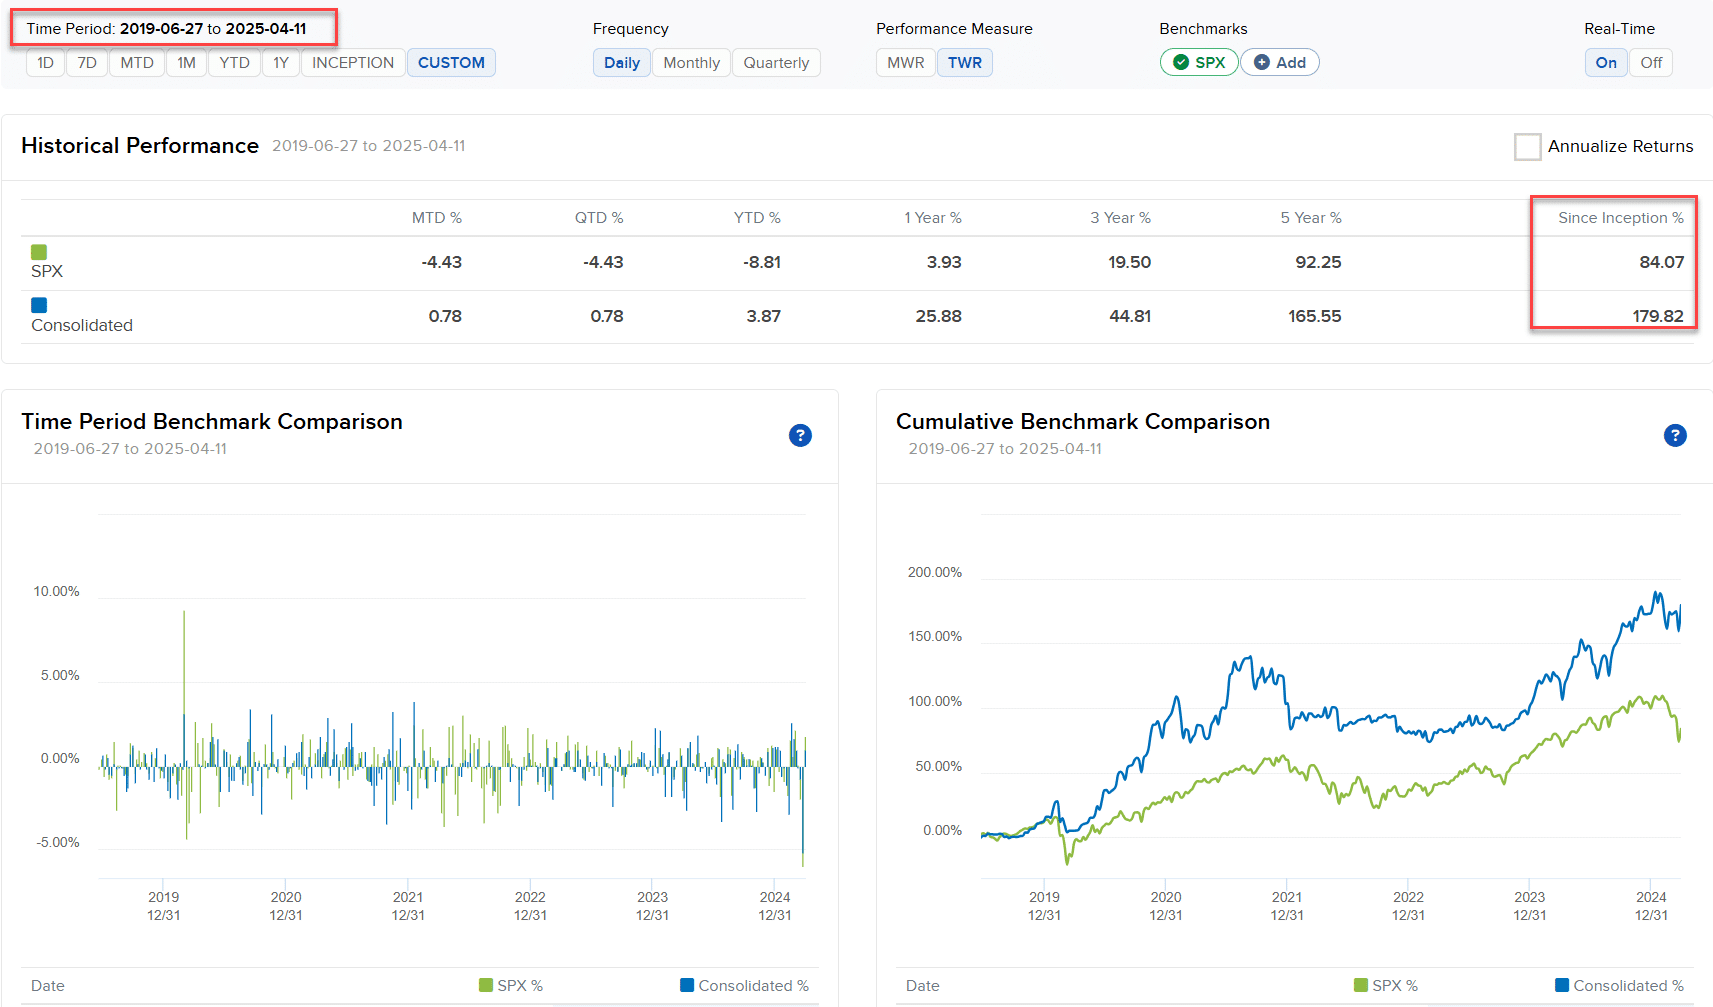
As you can see, from 2019 to 2025, my trading account was up 179% (compared to 84% for the S&P 500).
So, how does The RETT Technique work?
It can be broken down into four parts…
- Read trading books with backtested results
- Extract the concepts
- Test the trading system
- Tweak the trading system
Let me explain…
Read trading books with backtested results
You want to read trading books that give you the rules of a trading system and the backtest results. Here are 3 reasons why…
- You have a framework to start with, so you can save time
- The backtest result gives it more credibility, and you can use it to compare it against your result
- The author’s reputation is at stake, which means the trading systems are likely to work
Once you read a few of these books, you’ll notice most profitable trading systems have similar characteristics. That’s when you move on to the next step…
Extract the concepts
Concepts are the underlying principles driving a trading system’s performance.
For example…
The concept of breakout means you’ll buy after the price has moved in your favour.
The concept of counter-trend means you’ll buy in a downtrend (and go short in an uptrend).
The concept of a trailing stop loss means you’ll give your trade “breathing room” with the hopes of riding a trend.
Every profitable trading system combines a few core concepts. Understanding these allows you to develop multiple trading systems.
To extract the concepts of a trading system, ask yourself these questions…
- What’s the characteristic of the trading system?
- What type of market conditions does it work best in?
- What type of market conditions does it underperform in?
- What’s the trading setup?
- What’s the exit signal?
From these questions, you’ll understand the concepts behind the trading system, how it works, why it works, and how to develop one for yourself.
Next…
Test the trading system
To test a trading system, you can run a backtest on it.
This means executing trades on past data so you can see how the trading system has performed over time.
For example, here’s the result of a Bollinger Band trading system…
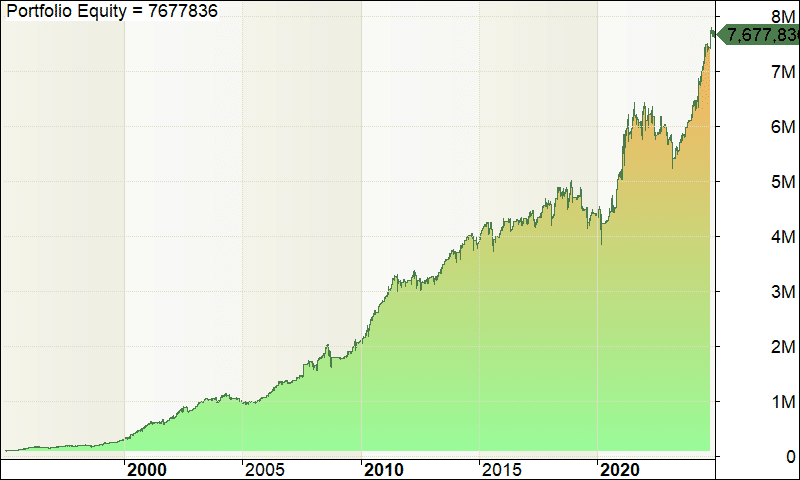
If you saw these kinds of results, would you have the confidence to trade the system in live markets?
Possibly!
This is the power of backtesting. It tells you whether a trading system works or not, saving time and money, and builds confidence, especially during a drawdown.
Now you might be wondering:
“Why do I need to backtest the trading system if the result is provided in the book?”
That’s because you’ve no idea if the backtest result is accurate or not. You have to validate it yourself.
And finally…
Tweak the trading system
Now, if you’re happy with the backtest results, then you can test the system in the live markets (or with a small account).
But if you want to improve things like…
- Reduce the maximum drawdown
- Improve the risk-adjusted returns
- Make it less correlated with your existing systems
Here are some things you can do to achieve it…
Reduce the maximum drawdown
Most stock trading systems go into a deep drawdown because they are going against the overall market trend. So by having a trend filter, you can reduce the maximum drawdown.
E.g. Only buy stocks when the S&P 500 is above the 200-day moving average. Otherwise, remain in cash.
Improve the risk-adjusted returns
To improve the risk-adjusted returns of a trading system, you can test the parameters over a range of settings and see which works best.
E.g. A trading system goes long when the stock price makes a 5-day low. What if you test the 10, 20 or even 50-day low? What’s the impact of it? Are the risk-adjusted returns getting better when the duration is increased, or does it perform worse?
Make it less correlated with your existing systems
Here’s a little-known fact…
When you trade multiple trading systems that have little to no correlation, you will improve your risk-adjusted returns, reduce your maximum drawdown, and have a smoother equity curve.
So, how do you reduce the correlation between trading systems?
One way is to test the trading system on different markets. E.g., instead of the US stock market, you can test it on the Canadian or the Australian stock market.
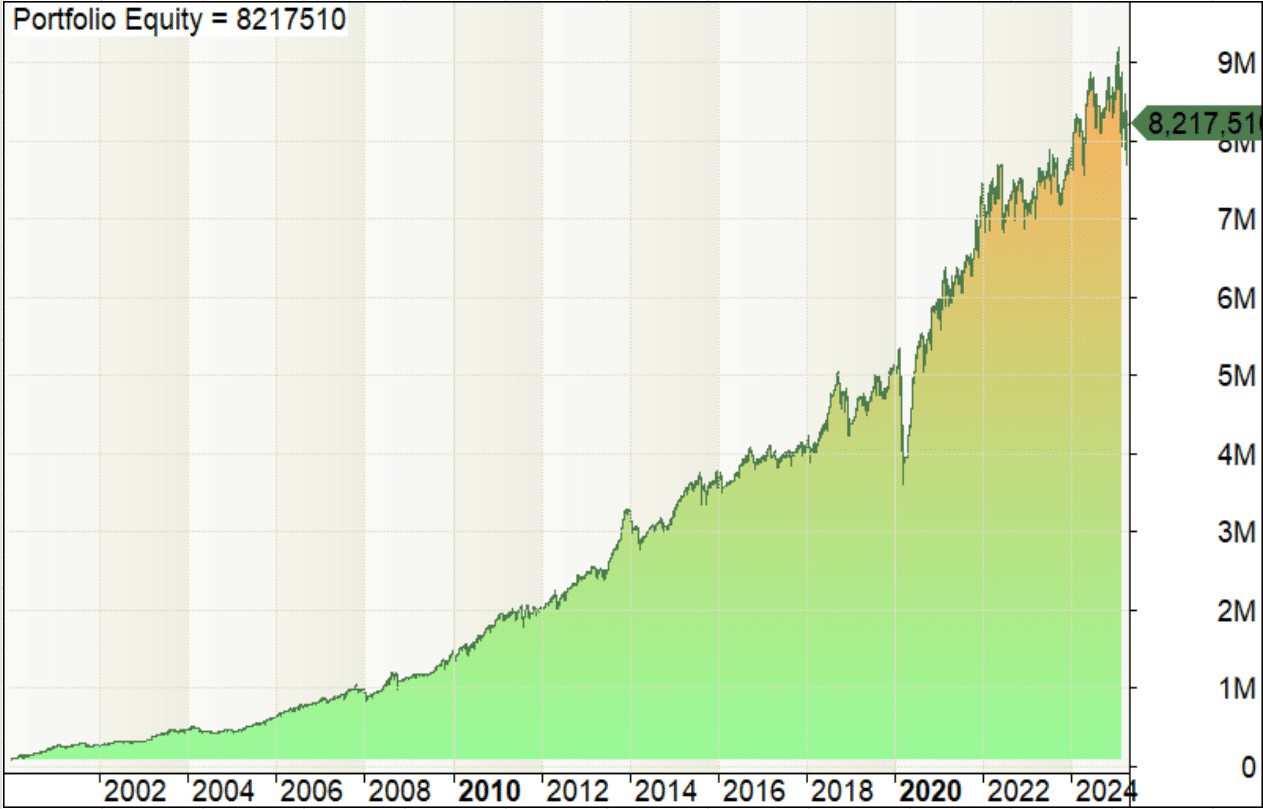
Using the RETT formula, I’ve developed multiple trading systems over the years.
For example, a mean reversion trading system that has generated an average of 18.69% over the last 29 years…
If you want to learn more, you can grab a copy of Trading Systems That Work.
You’ll discover 3 proven trading systems that work so you can profit in a bull market, a bear market, or even during a recession.
Conclusion
So here’s what you’ve learned today:
- Most traders lose money with technical analysis because they have no trading plan, no edge, no data, or no risk management.
- To solve these issues, you need a trading system that works, something that’s quantifiable and backed by data.
- One way to develop a profitable trading system is to use the RETT technique: 1) read trading books with backtested results 2) Extract the concepts 3) Test the trading system 4) tweak the trading system
Now here’s what I’d like to know…
What’s your struggle when it comes to technical analysis?
Leave a comment and let me know your thoughts!
I tend to think that my analysis is not right when the trade hit my stop loss, even though I understand now that I’m not supposed to win on every trade.
If you can do a detailed guid on backtesting on TradingView, I believe that would help.
A big salute to Rayner my friend, Jet and tradingwithrayner.com
Thanks for your kind words and great suggestion, Mohammed!
we truly appreciate it and will keep it in mind for future content!
Cheers!