In today’s video…
You’ll discover the 10 biggest trading lessons that I’ve learned right over my trading career.
Interested?
Then watch the video below:
Video Transcript
Unlike other trading educators who teach you based on theory, I put my money where my mouth is right.
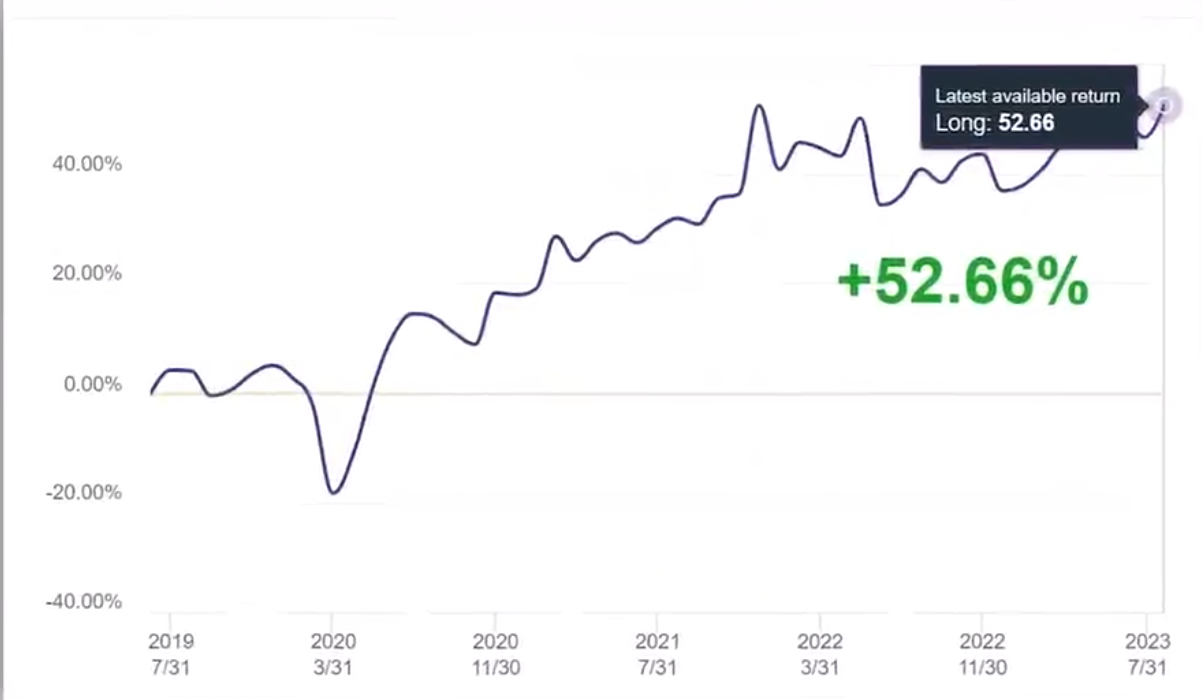
You can see my live trading results on the screen over here:
What I’m about to share with you is so important that if I had learned these lessons earlier, I would have saved at least six figures or more.
So, if you don’t make the same costly mistakes that I’ve made, then today’s training is for you.
Trade in the path of least resistance
Often a mistake that many traders make this mistake, and I’m guilty of this too. I used to trade based on what I think not what I see.
I look at the chart and I think…
“Oh man, look how high the price is, it looks really expensive time to sell”
I do just that, I short the market next thing you know the market continues up even higher.
How about this the stock price is in a downtrend and I’m thinking to myself
“Man look how cheap this stock is it can go down let me buy and dabble a little bit”
Next thing you know the stock price got even cheaper.
The mistake I made is because I trade based on what I think not what I see.
This is where I want you to trade along the path of least resistance trade based on what you see and not what you think and to do that is very simple.
Look at this.
If the market is in an uptrend, you look for buying opportunities, and if the market is in a downtrend, you look for selling opportunities and that’s it.
If you’re an expert trader and you do counter trend trading and stuff like that all the fancy stuff, go ahead.
But if you’re a new trader, if you’re struggling to make a profit I recommend trading along the path of least resistance.
This is where trading becomes easier for you.
Examples
You might be wondering…
“Rayner, the market is in an uptrend, but where exactly do I buy?
Good question.
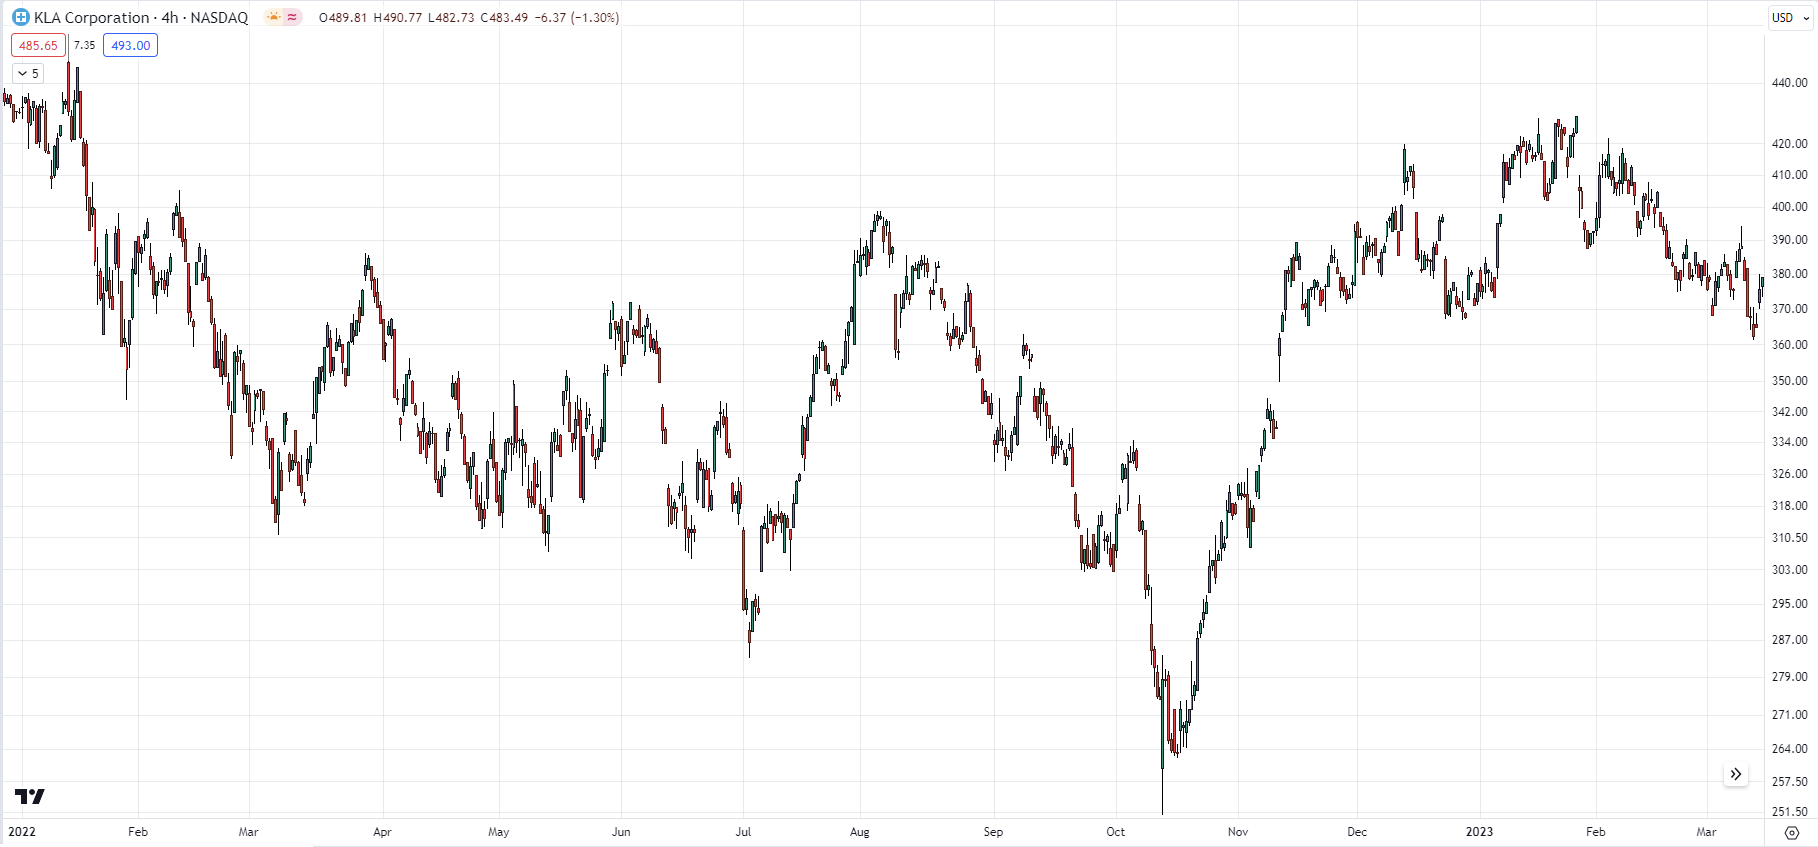
If we look at this chart over here:
You can see that this stock is in an uptrend, you might be wondering…
“Rayner, where exactly do I buy now that this stock is in an uptrend?
One thing to share with you is that I like to look for buying opportunities right in the area of support.
The area of support is an area on the chart where the market prices reverse up higher.
Here is what I mean:
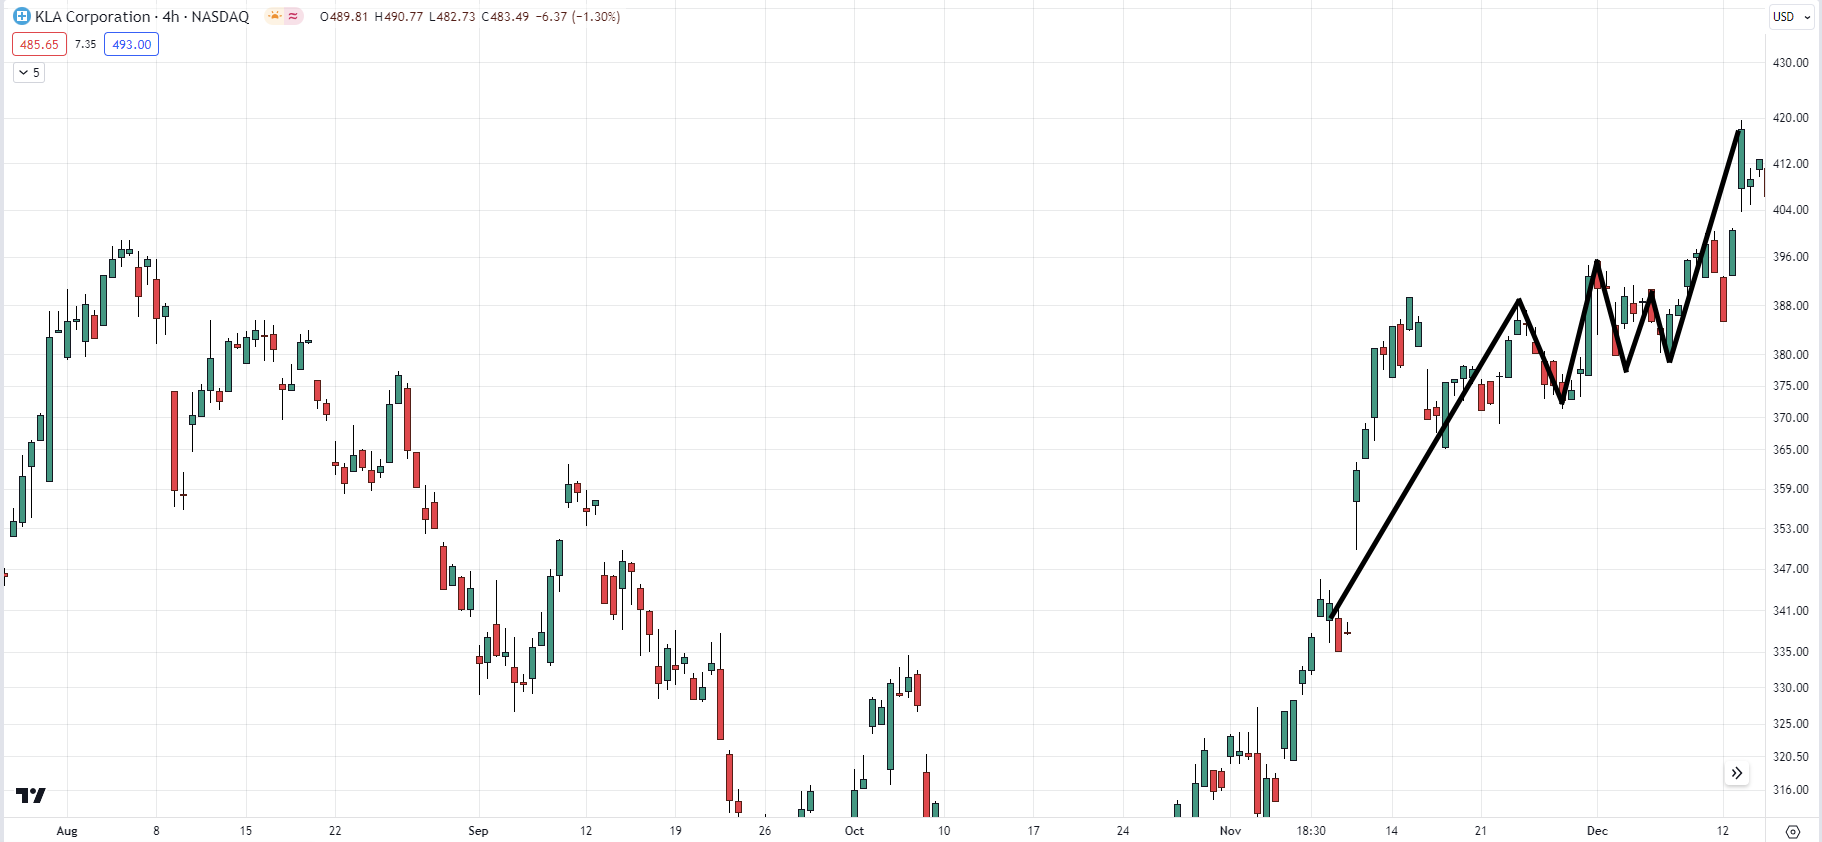
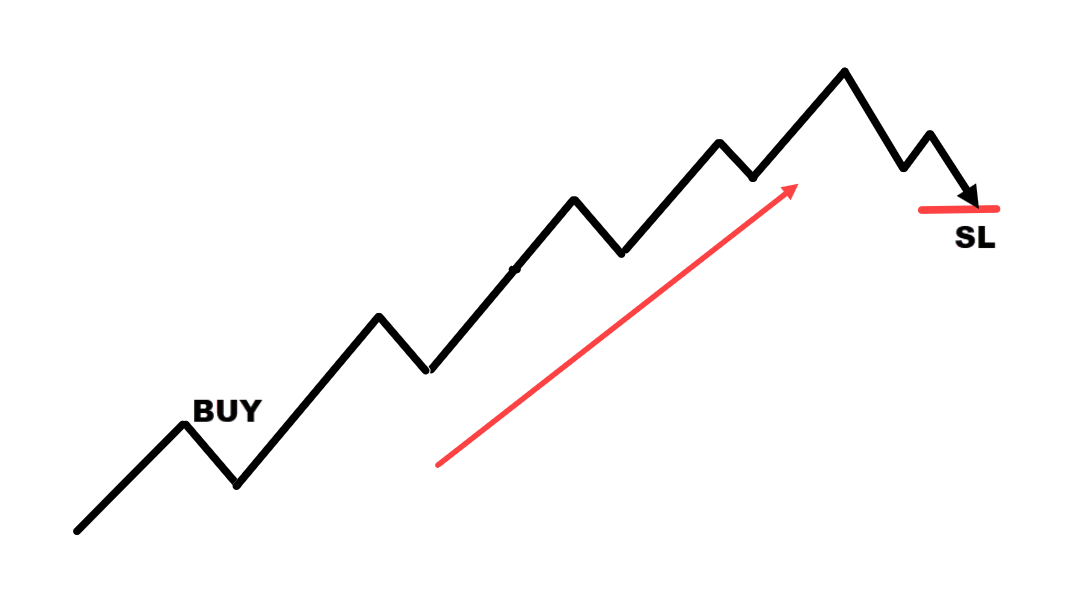
To walk you through, the market rallied up higher, it made a pullback, then it rallied up higher, gave me another pullback, rallied up higher, gave me another pullback, and then boom, rallied up higher to where it is right now.
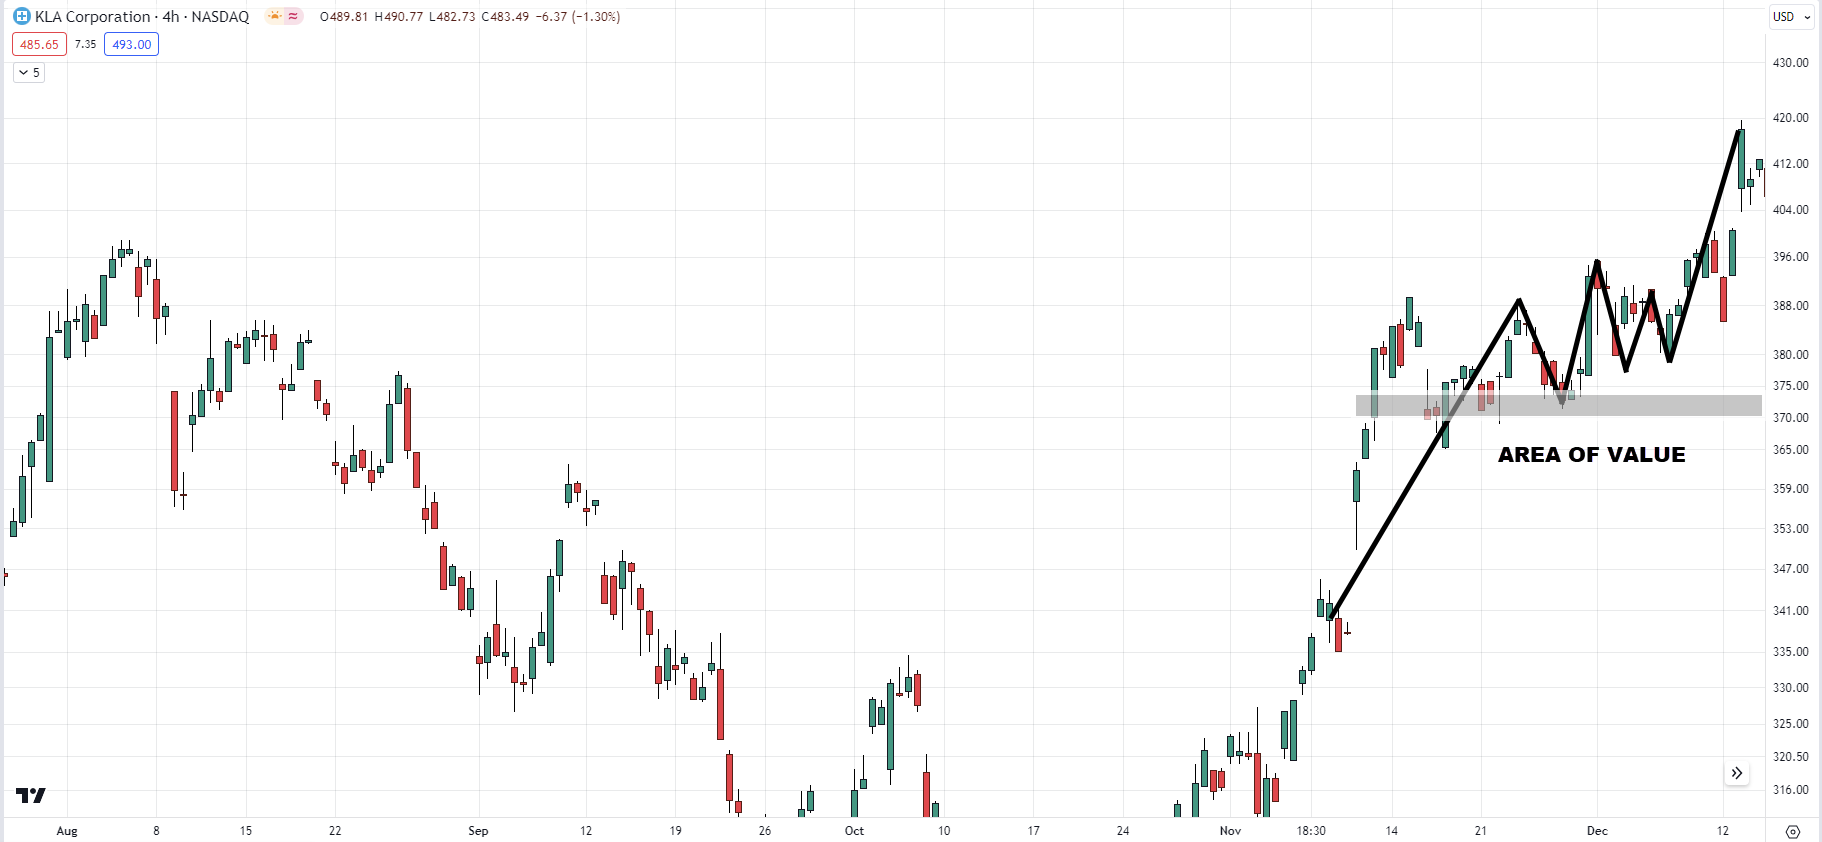
If you ask me, this is an area of support a level that I want to pay attention to. Here is an example:
This is one way to identify your area of value in the chart to look for buying opportunities and of course, you can stack it up with multiple tools and indicators to identify whether that level has a high probability of reversal.
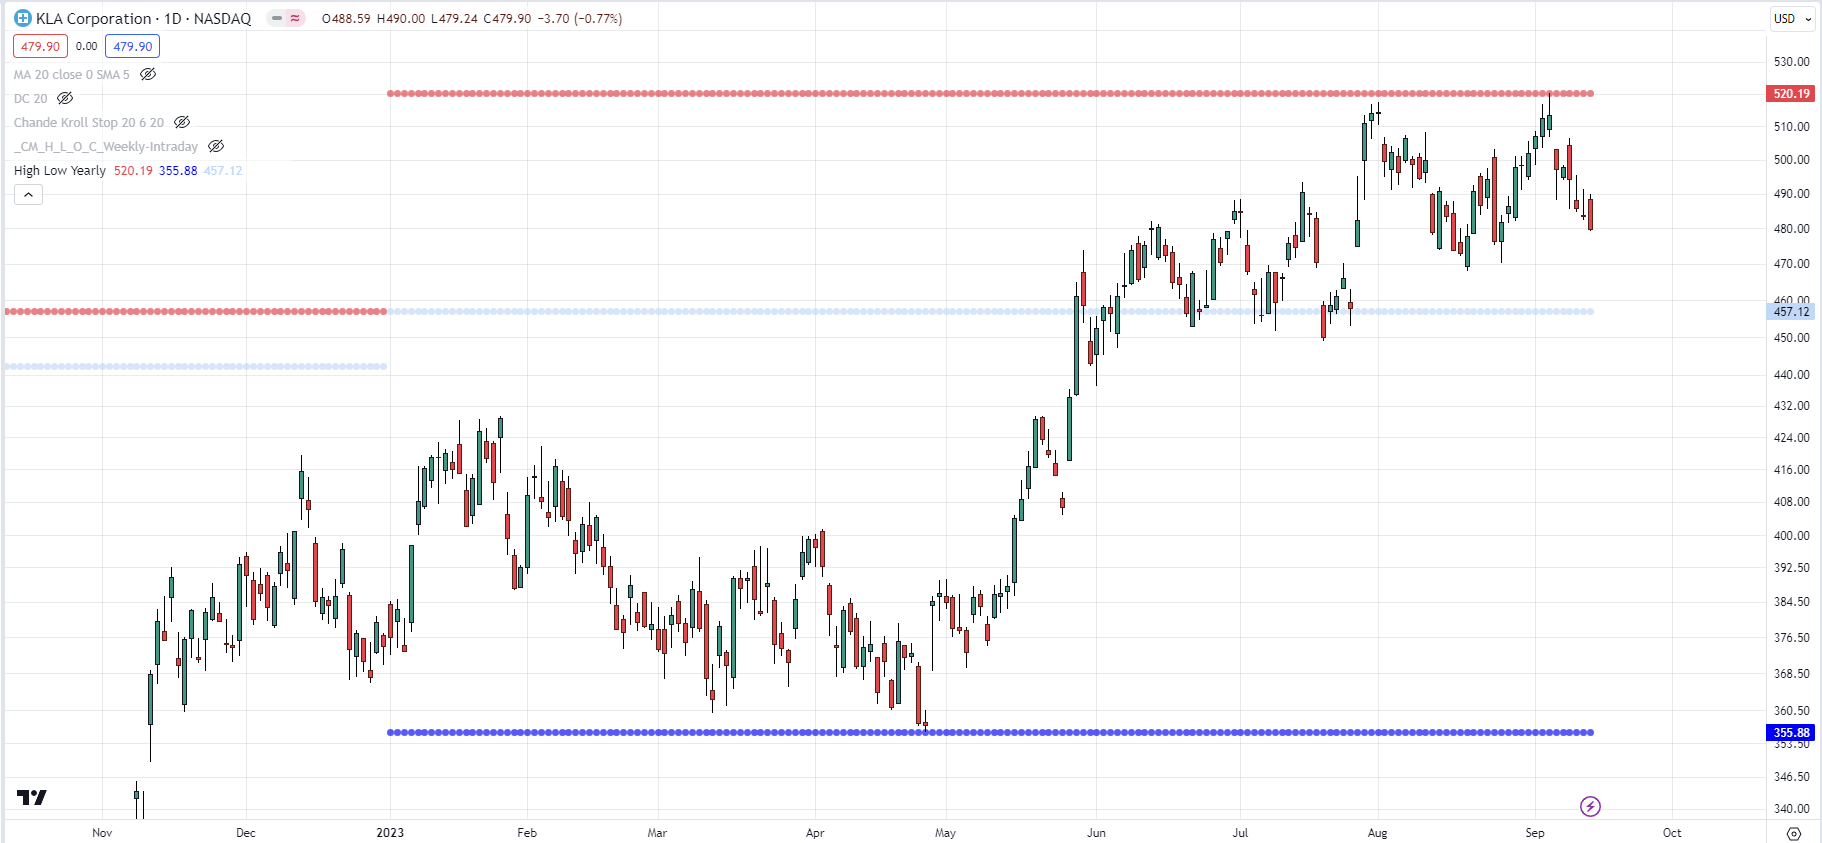
Another technique I want to share with you is a technique I learned from a trader called @trader1sz, from Korea.
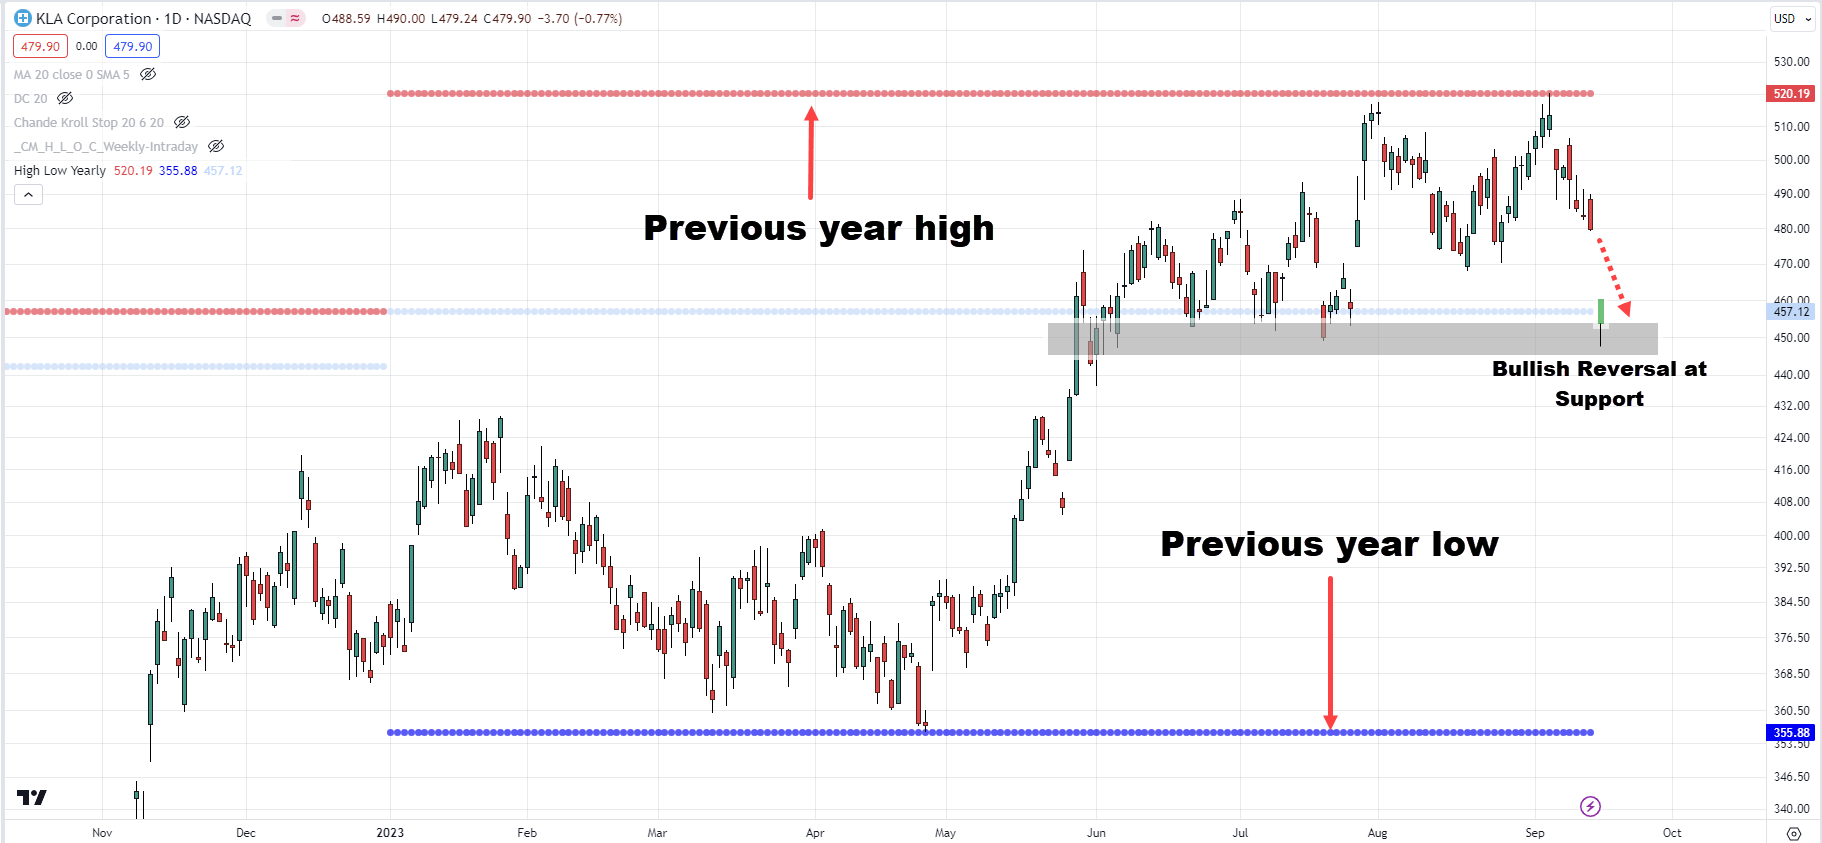
He likes to use the yearly open the yearly highs and the yearly lows to look for potential buying opportunities.
I’m going to pull that out you can see over here on the chart:
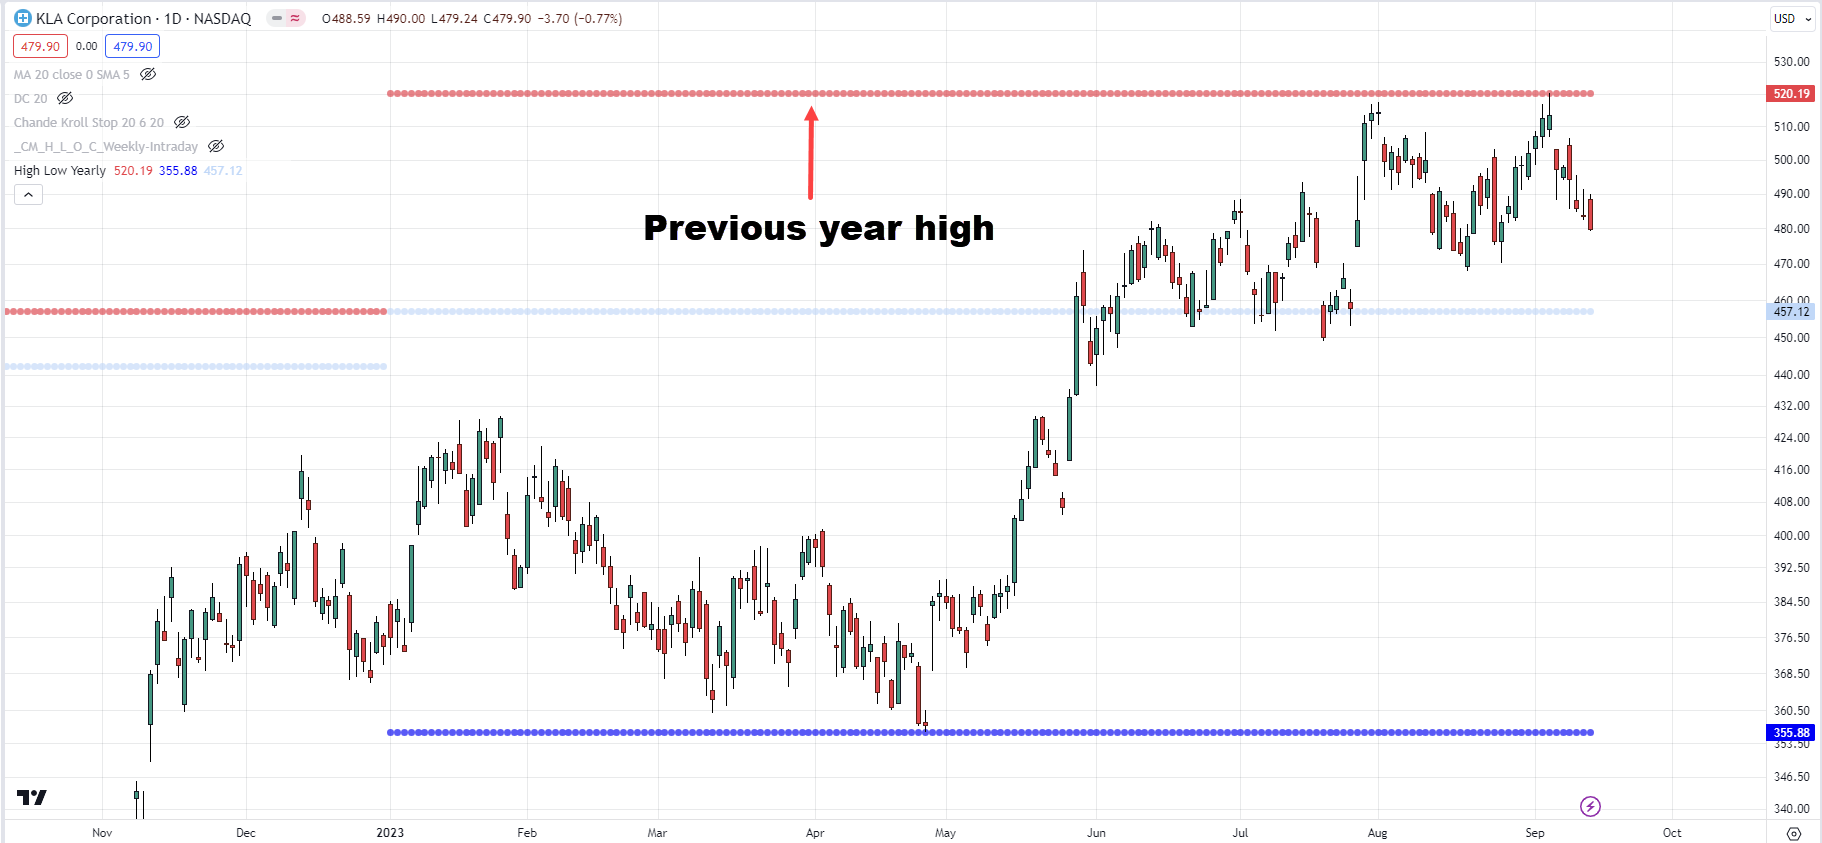
This dark red line over here simply tells me that is the previous year’s high. The current year is 2023, which tells me that this is the high of 2022. This is what I mean:
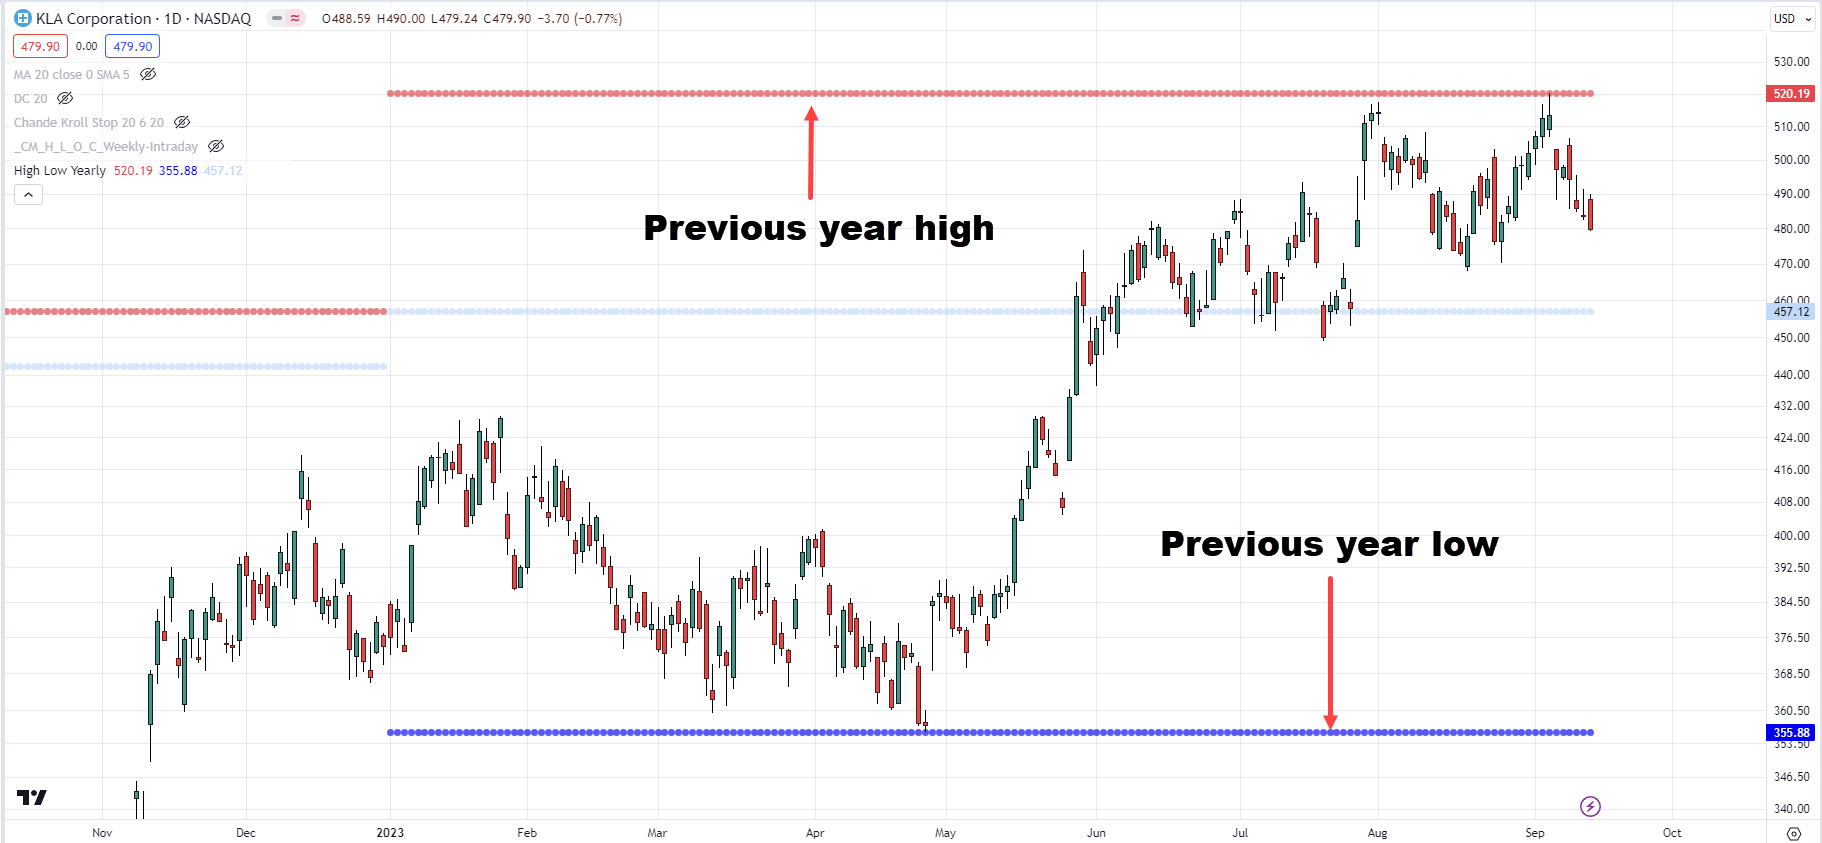
The blue line is the low of 2022.
Again, this indicator is free on TradingView. This is a significant area on the chart when you look for potential buying opportunities.
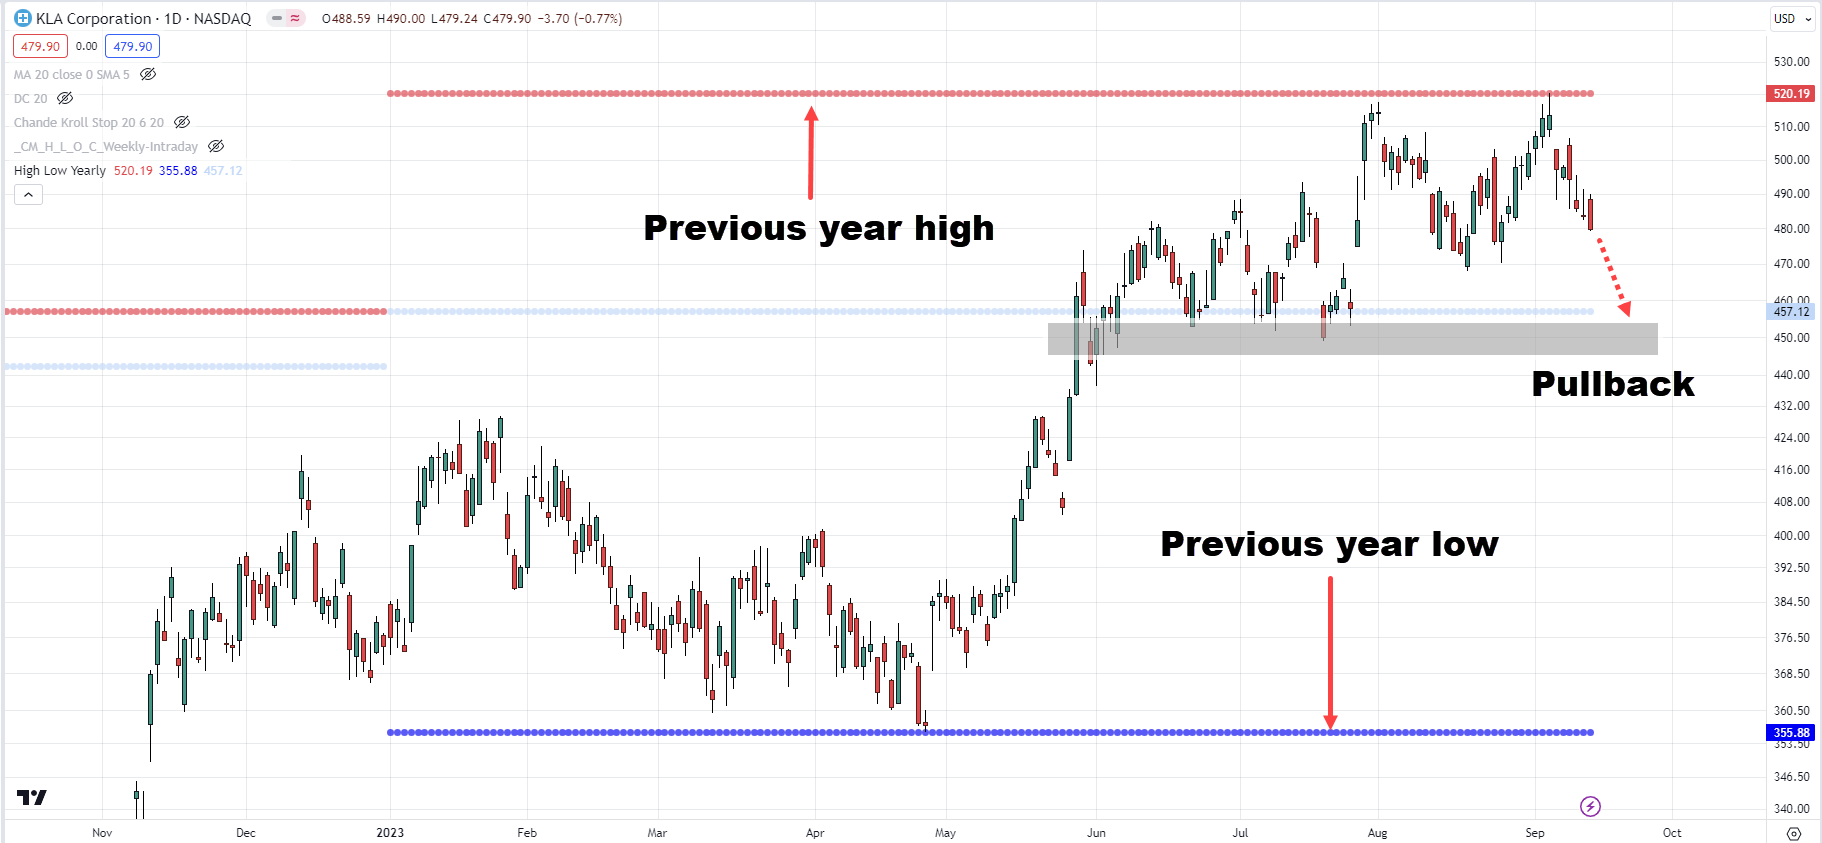
One simple technique is that if the market makes a pullback over here:
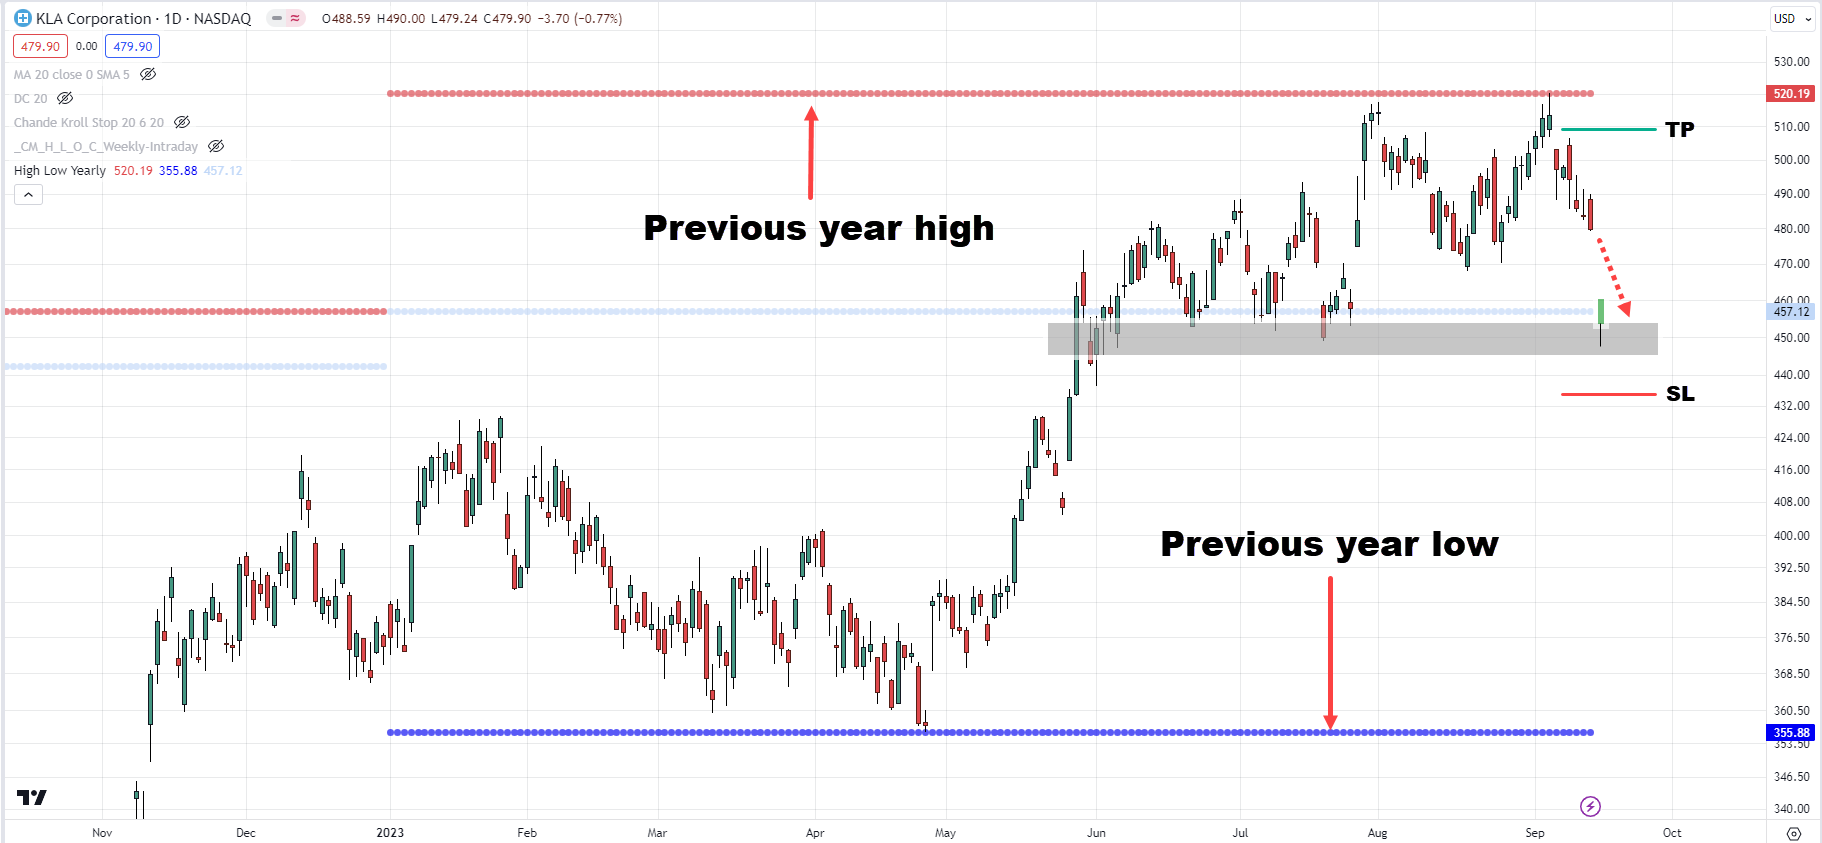
I’m looking for bullish reversal candlestick patterns like a hammer., when that happens that’s a sign that the buyers are possibly stepping in. Here’s how it looks like:
Take a long position to enter the next candle open, stop would be a distance below the low. A possible target could be just before this recent swing high. Here is what I mean:
Allowing me to capture that one swing up higher so there’s a potential trading opportunity that I’m looking at.
Along the way, you will understand why I’m looking for this buying opportunity and how I’m looking to trade this setup.
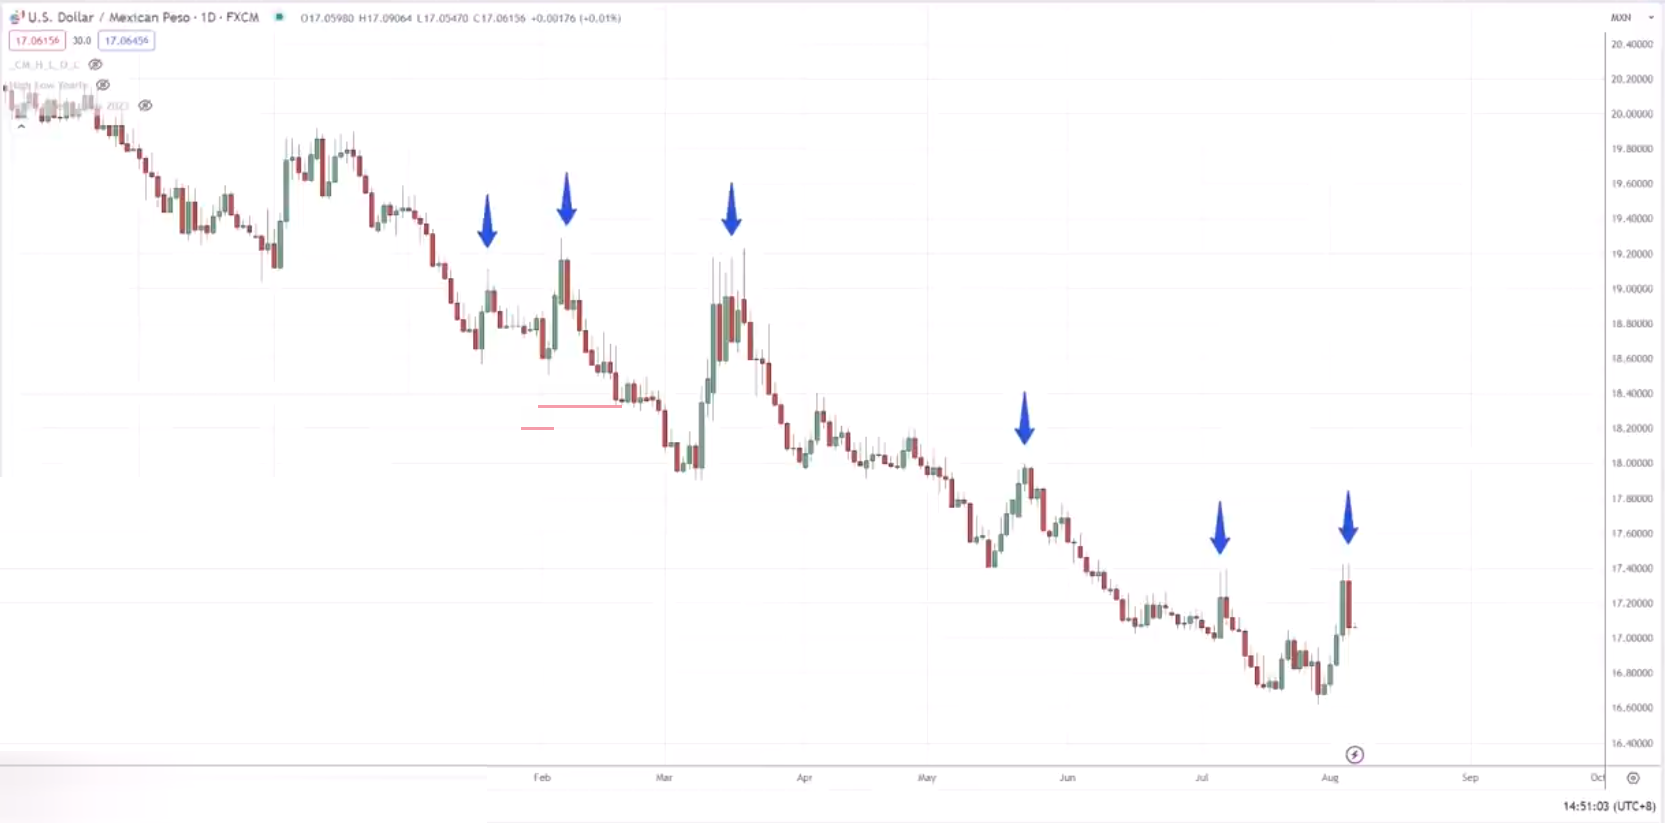
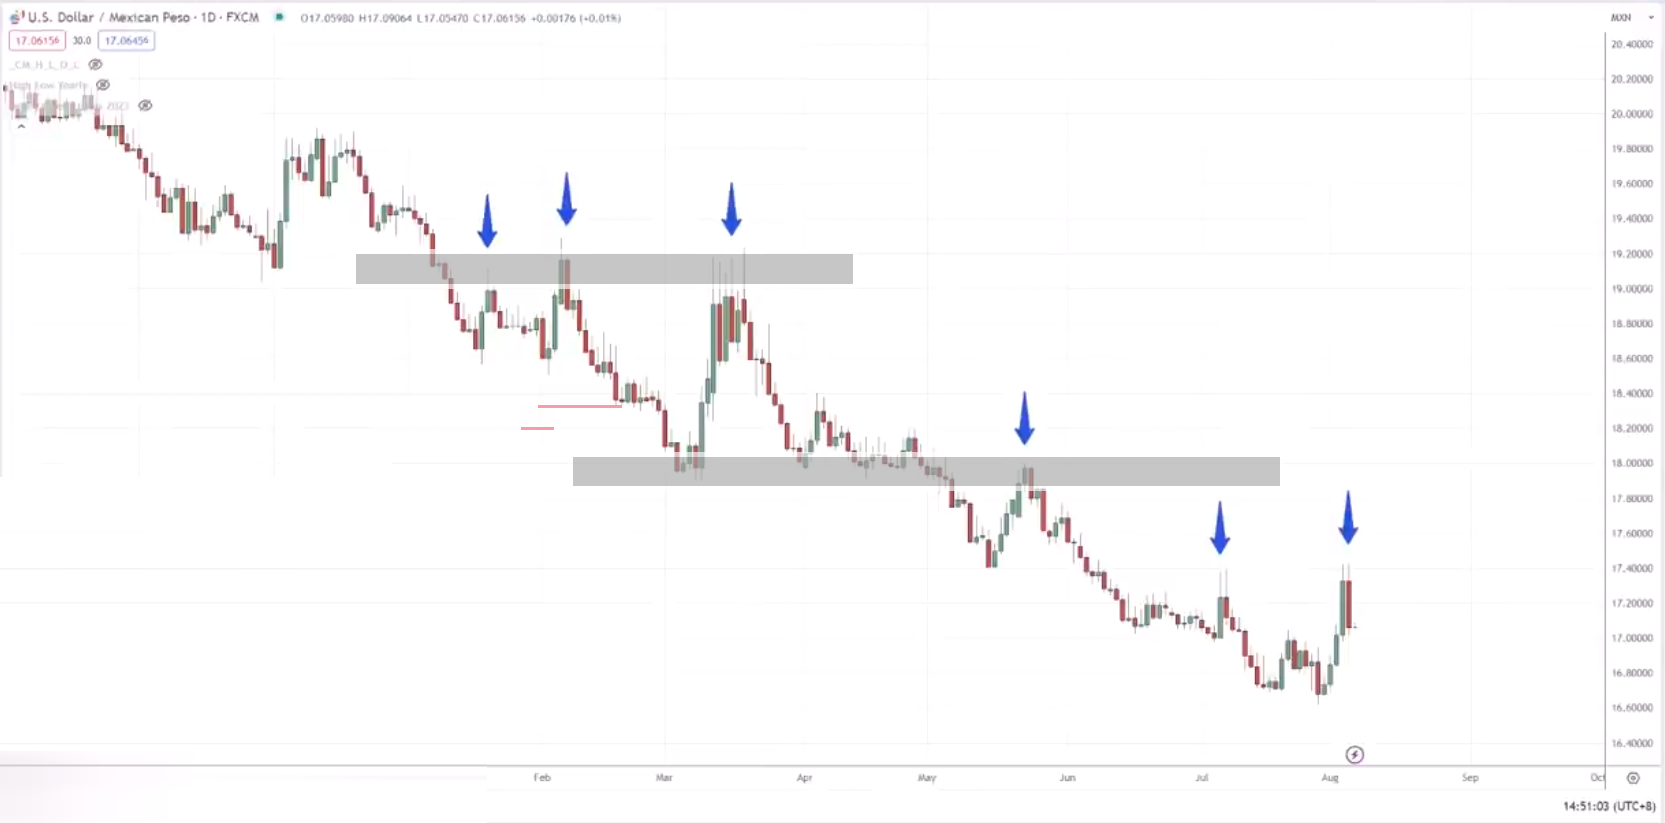
Now look at this chart:
Let me ask you…
Are you looking for buying opportunities or selling opportunities?
The answer is selling opportunities.
Because the market is in a downtrend.
You are seeing several blue arrows and you are wondering…
“Rayner, what are those blue arrows?”
Those blue arrows are where the price reverses.
How could you have predicted where this market could reverse ahead of time?
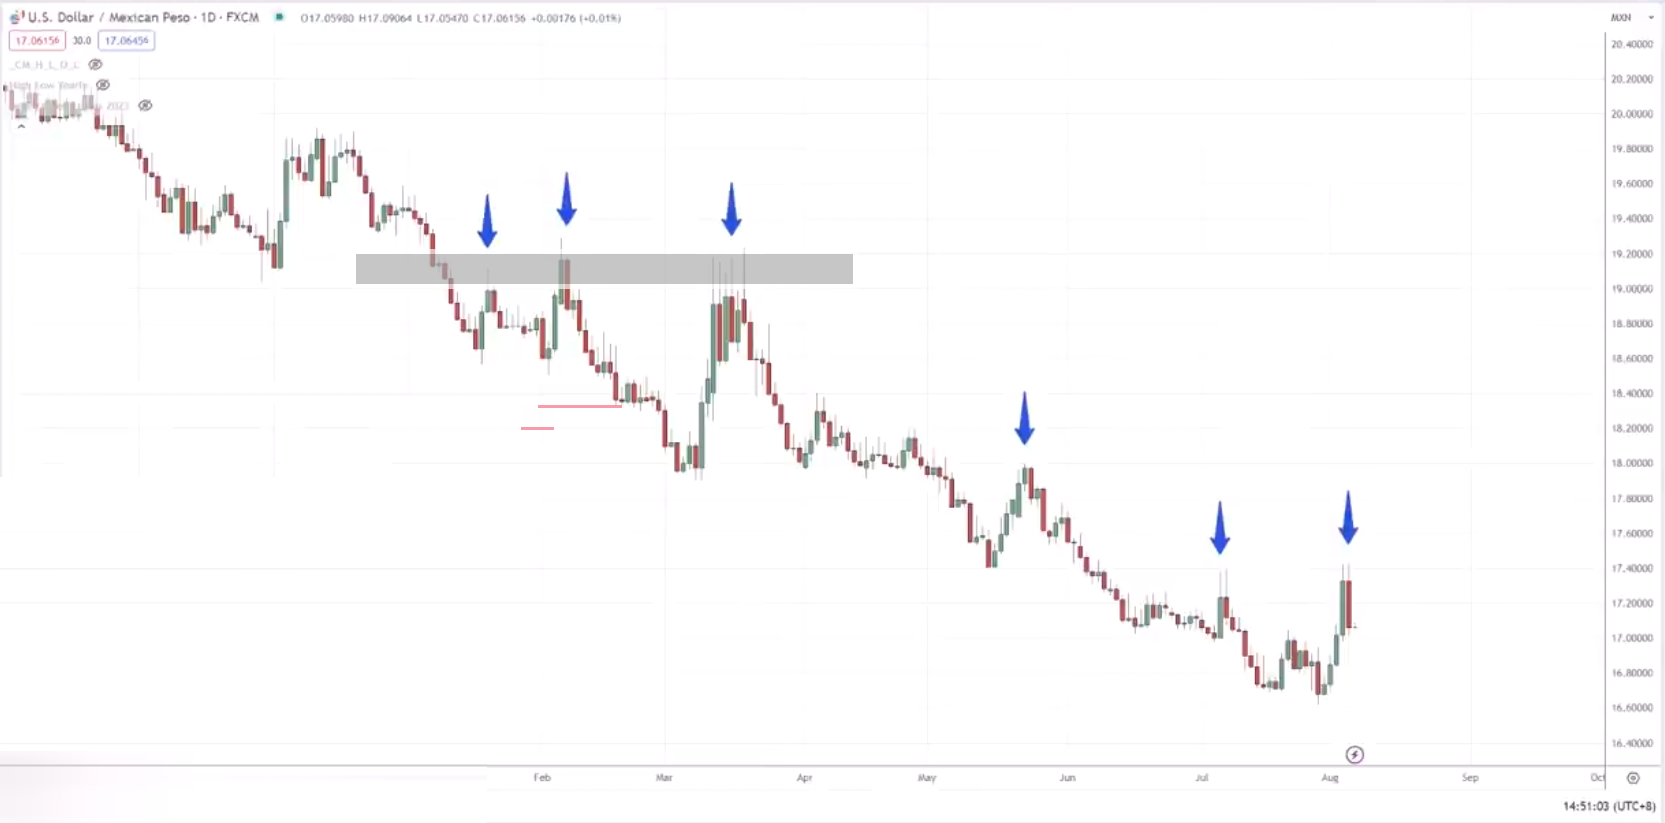
Another thing to share with you is that when you’re dealing with support and resistance, those are useful techniques to identify where the market might reverse from.
As the market is in a downtrend, you want to look for selling opportunities at resistance.
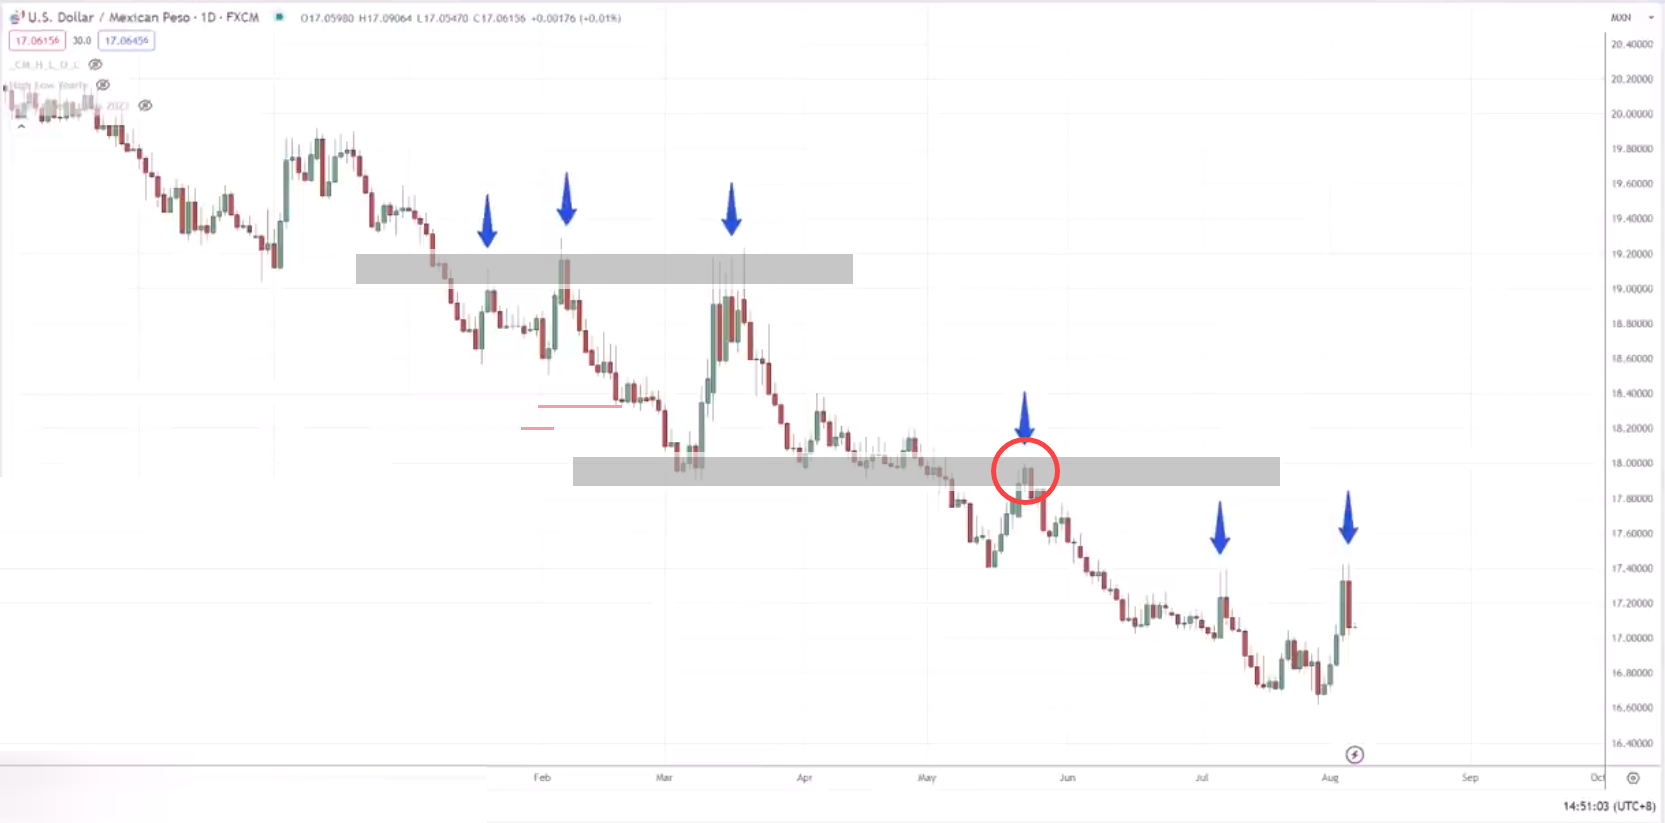
Another thing to point out is that when the market breaks below support, support could become resistance and reverse down lower from there.
Examples
USD/MXN
This particular currency pair respects this phenomenon.
Notice how nicely right previous support when broken became resistance right over here.
Another area of support tested once, twice, and thrice
We had this reversal at this previous point, which became resistance. Here’s what it looks like:
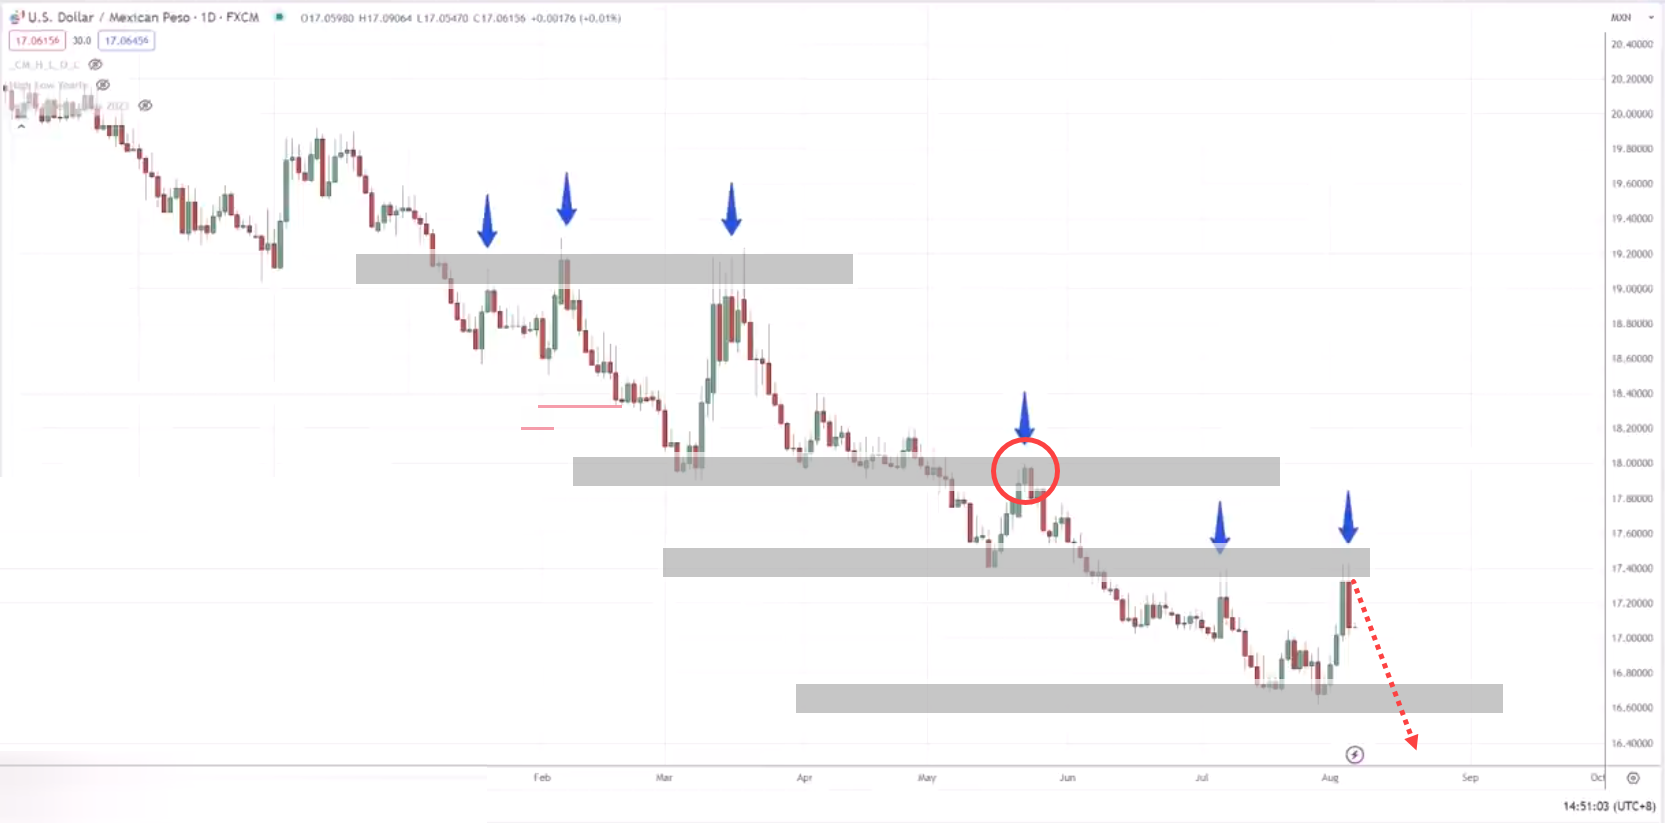
You can do this ahead of time.
If the market were to break below this low, here is what I mean:
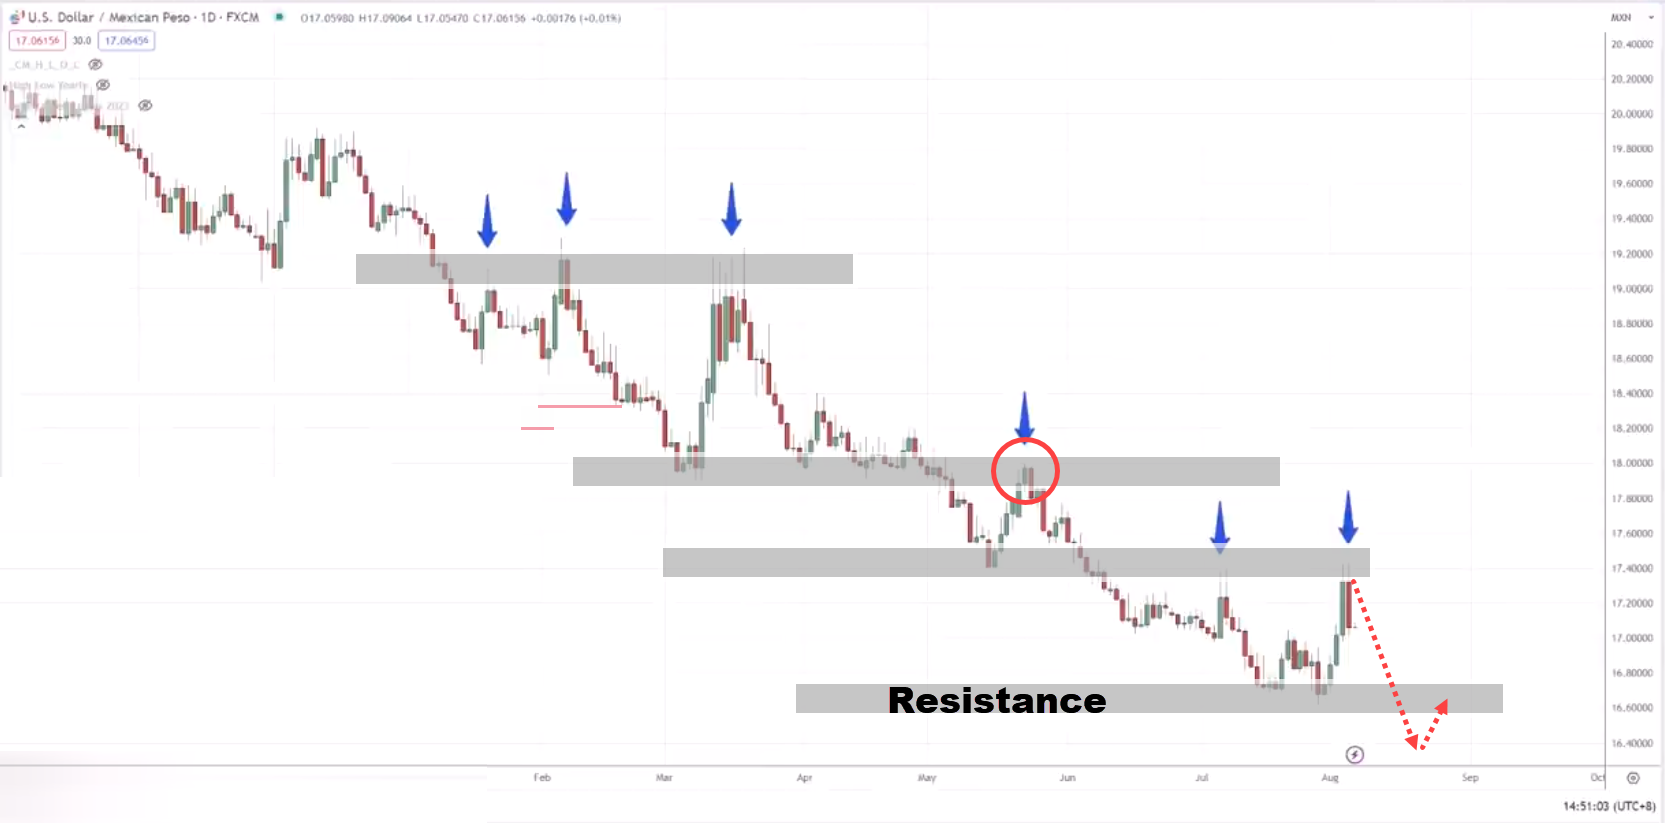
Then there’s a good chance that it’s going to find resistance over here:
Look for selling opportunities with the expectation of lower prices to come since this is a downtrend.
Hopefully, these techniques will help you know where to buy and sell on the chart and when to be a buyer and a seller.
If in doubt, zoom out
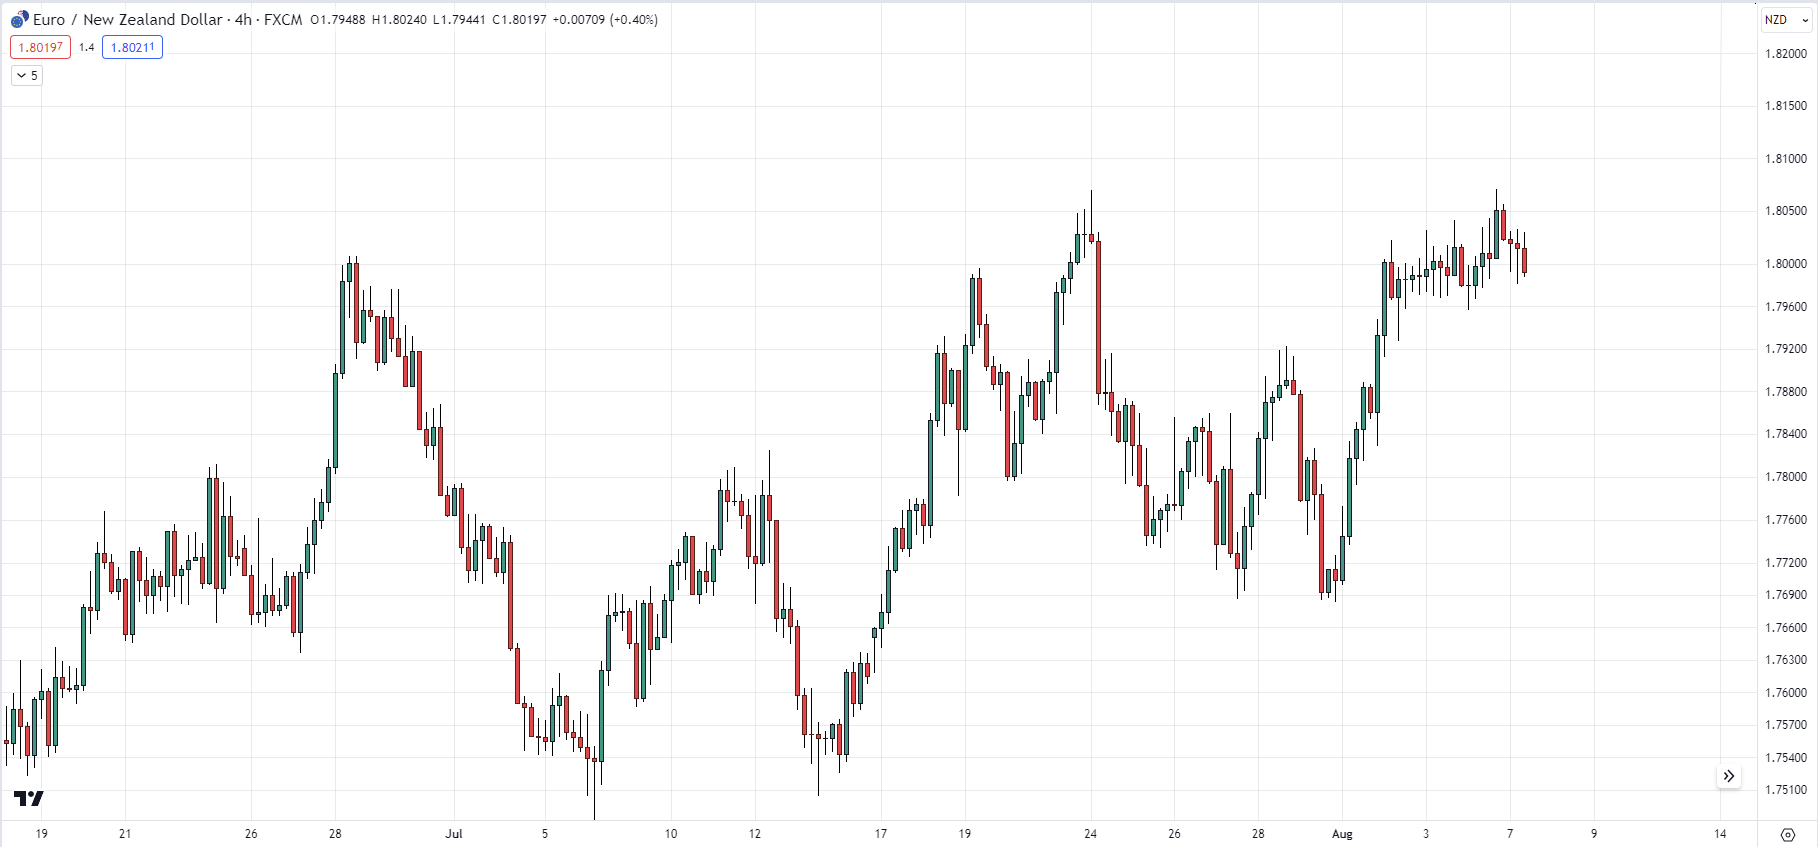
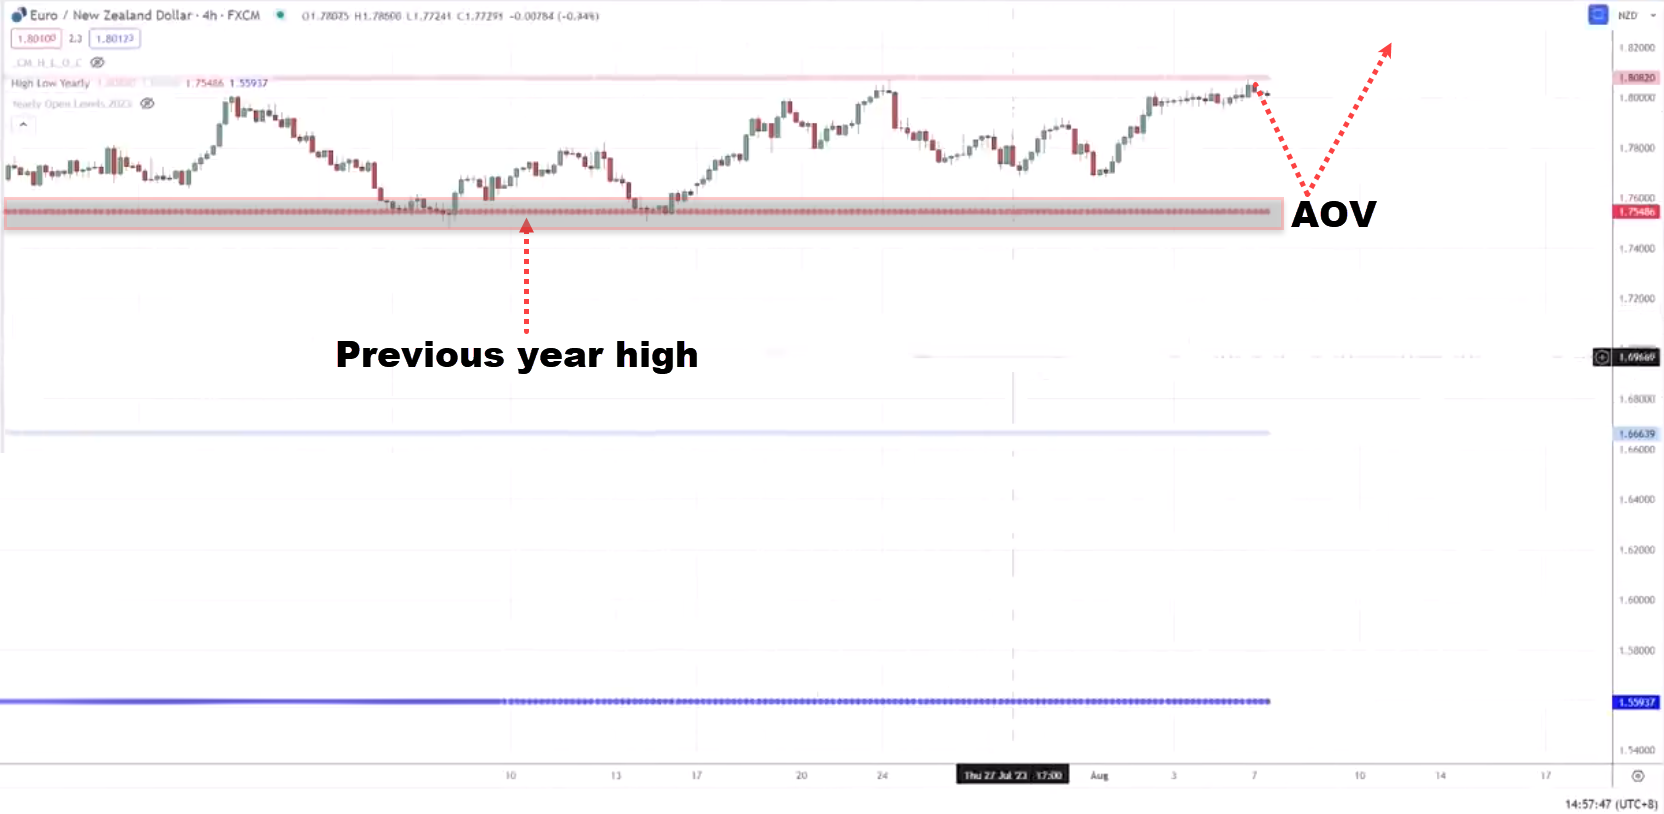
EURNZD H4
You might be thinking…
“Rayner, should I look for shorting or buying opportunities?”
Because after all this market looks like it’s in a range. This is what I mean:
Should I look to buy or sell?
Now, if you just look solely based on this chart, it’s quite hard to tell because you don’t have any directional bias.
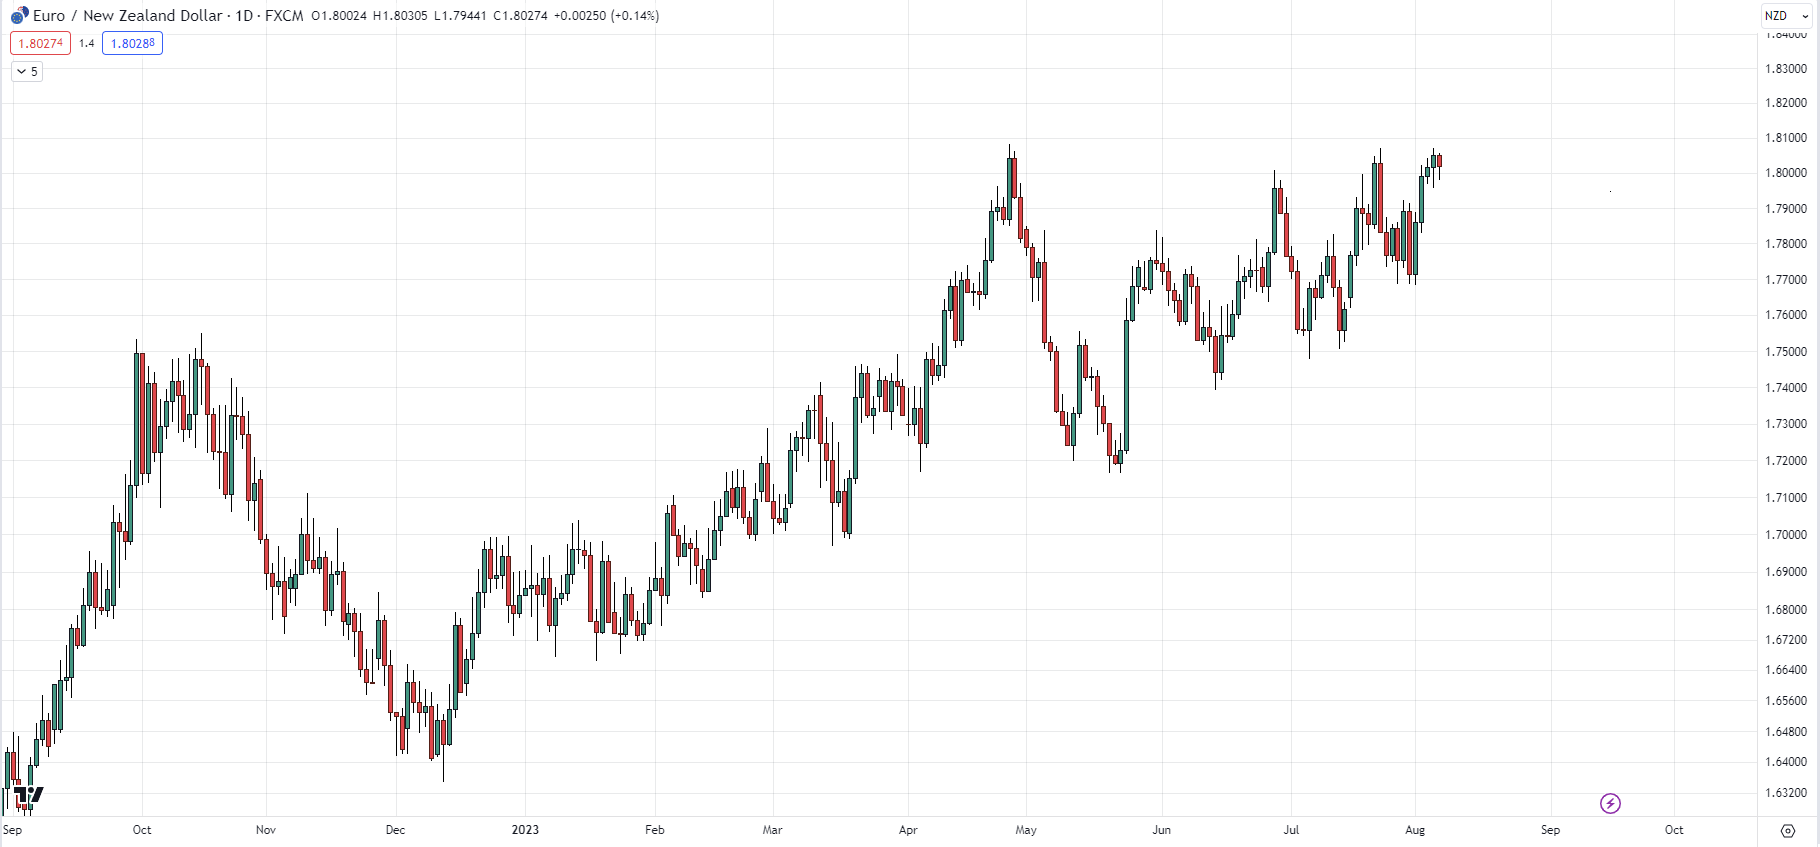
If you are in doubt, if you’re not sure whether to be a buyer or seller, then just zoom out.
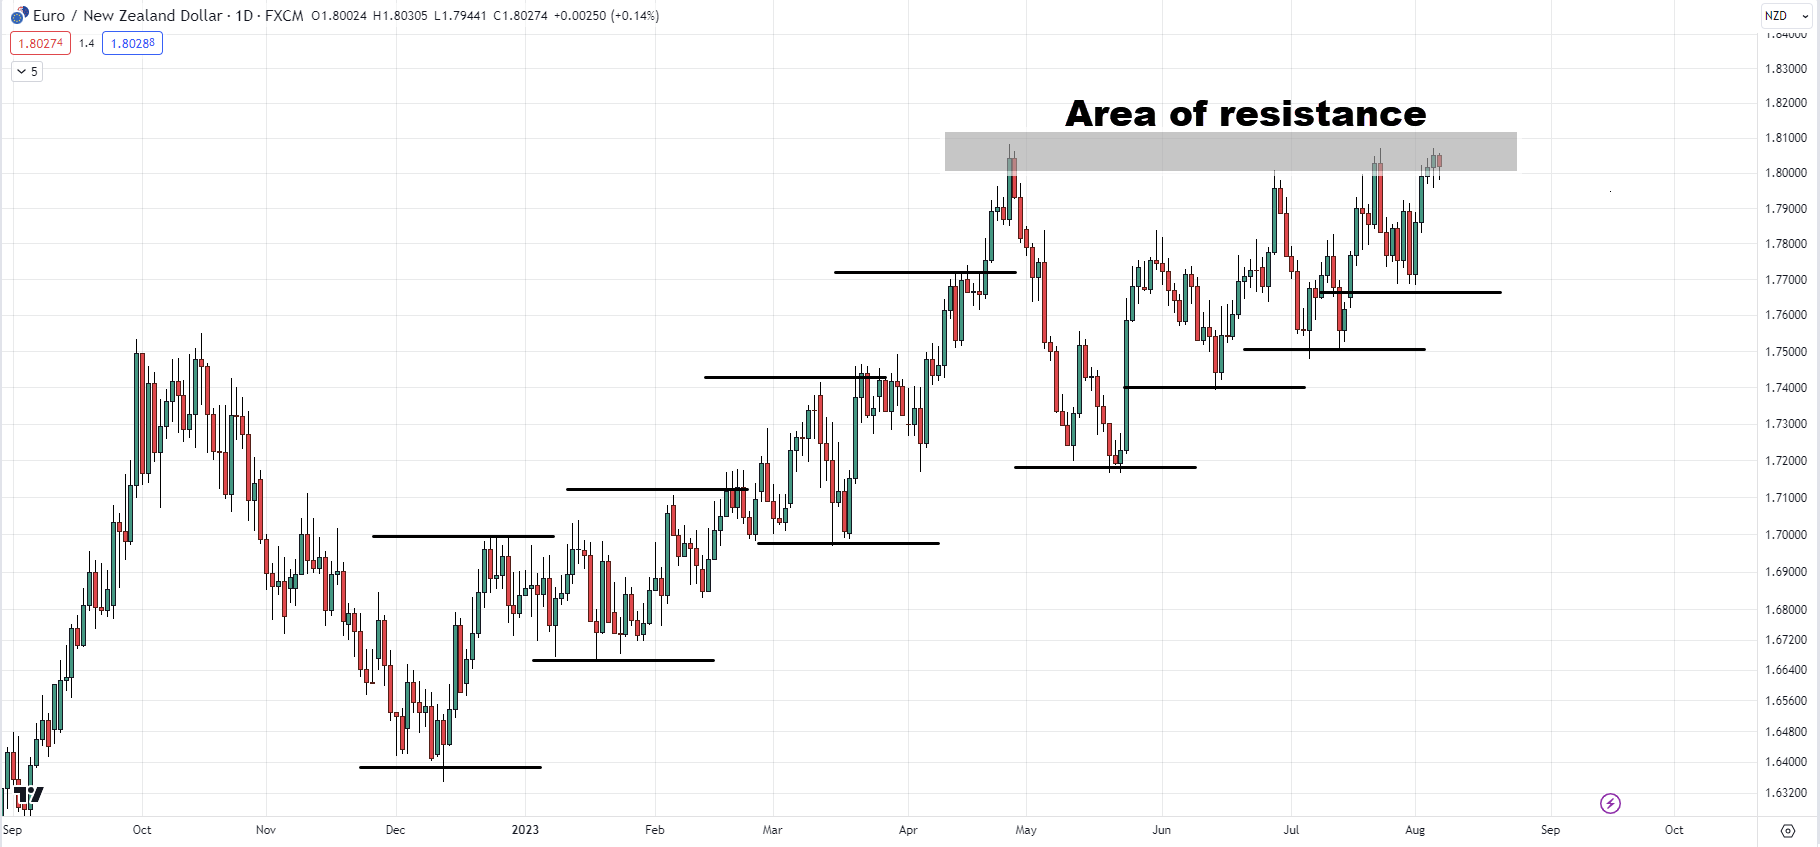
Let’s go up to the daily timeframe in this case:
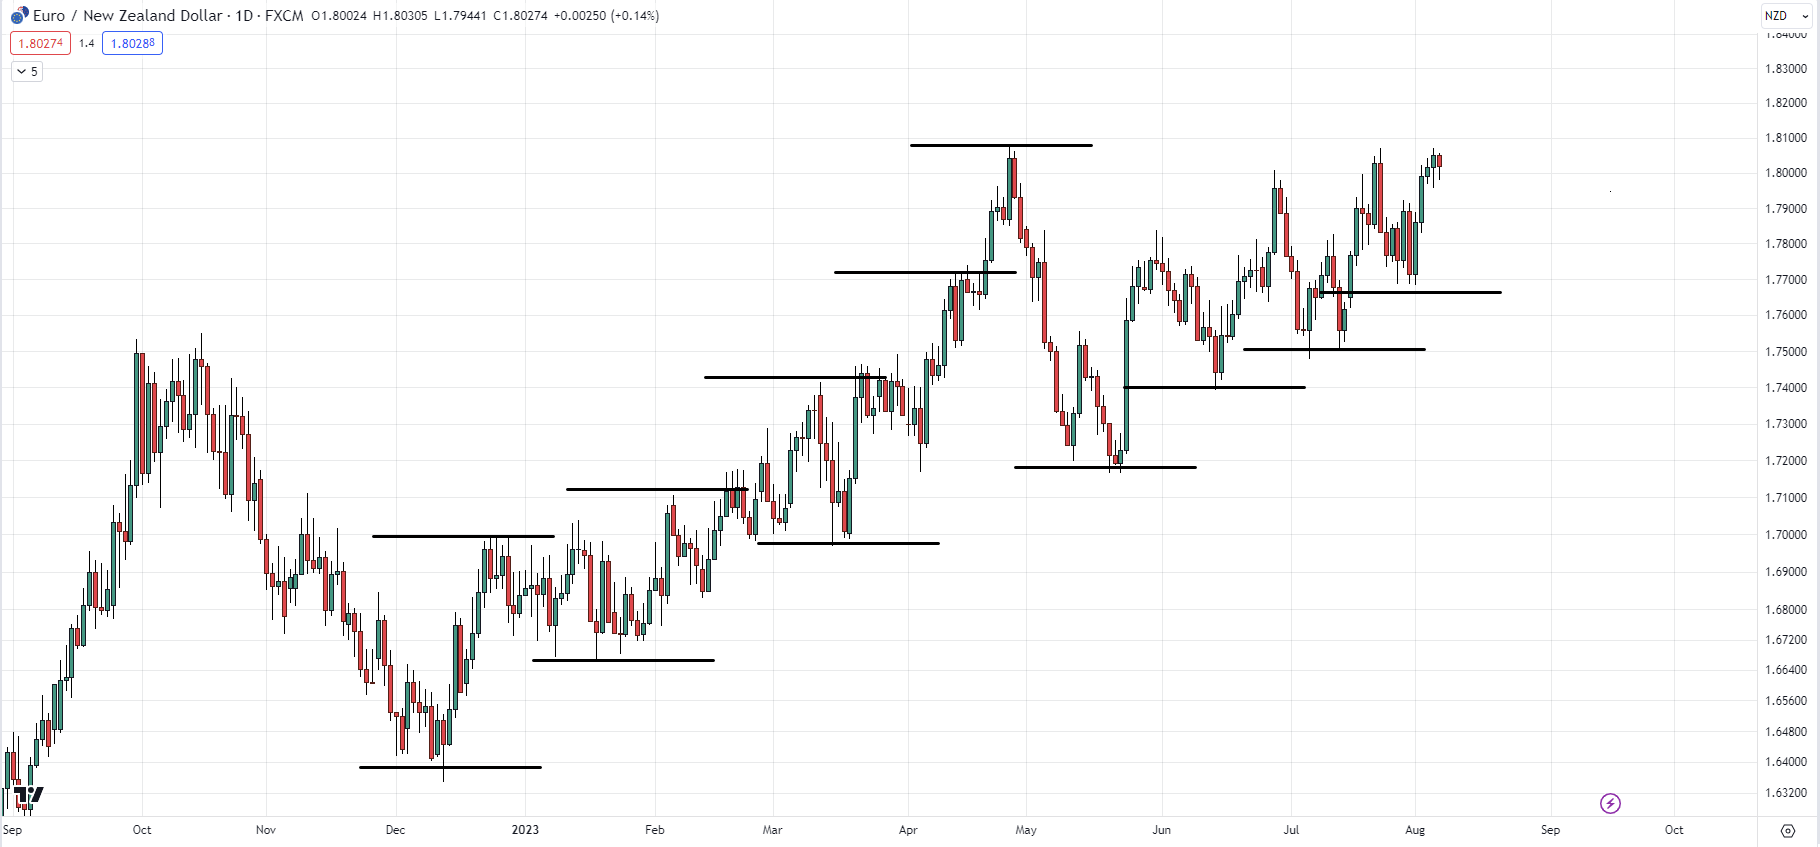
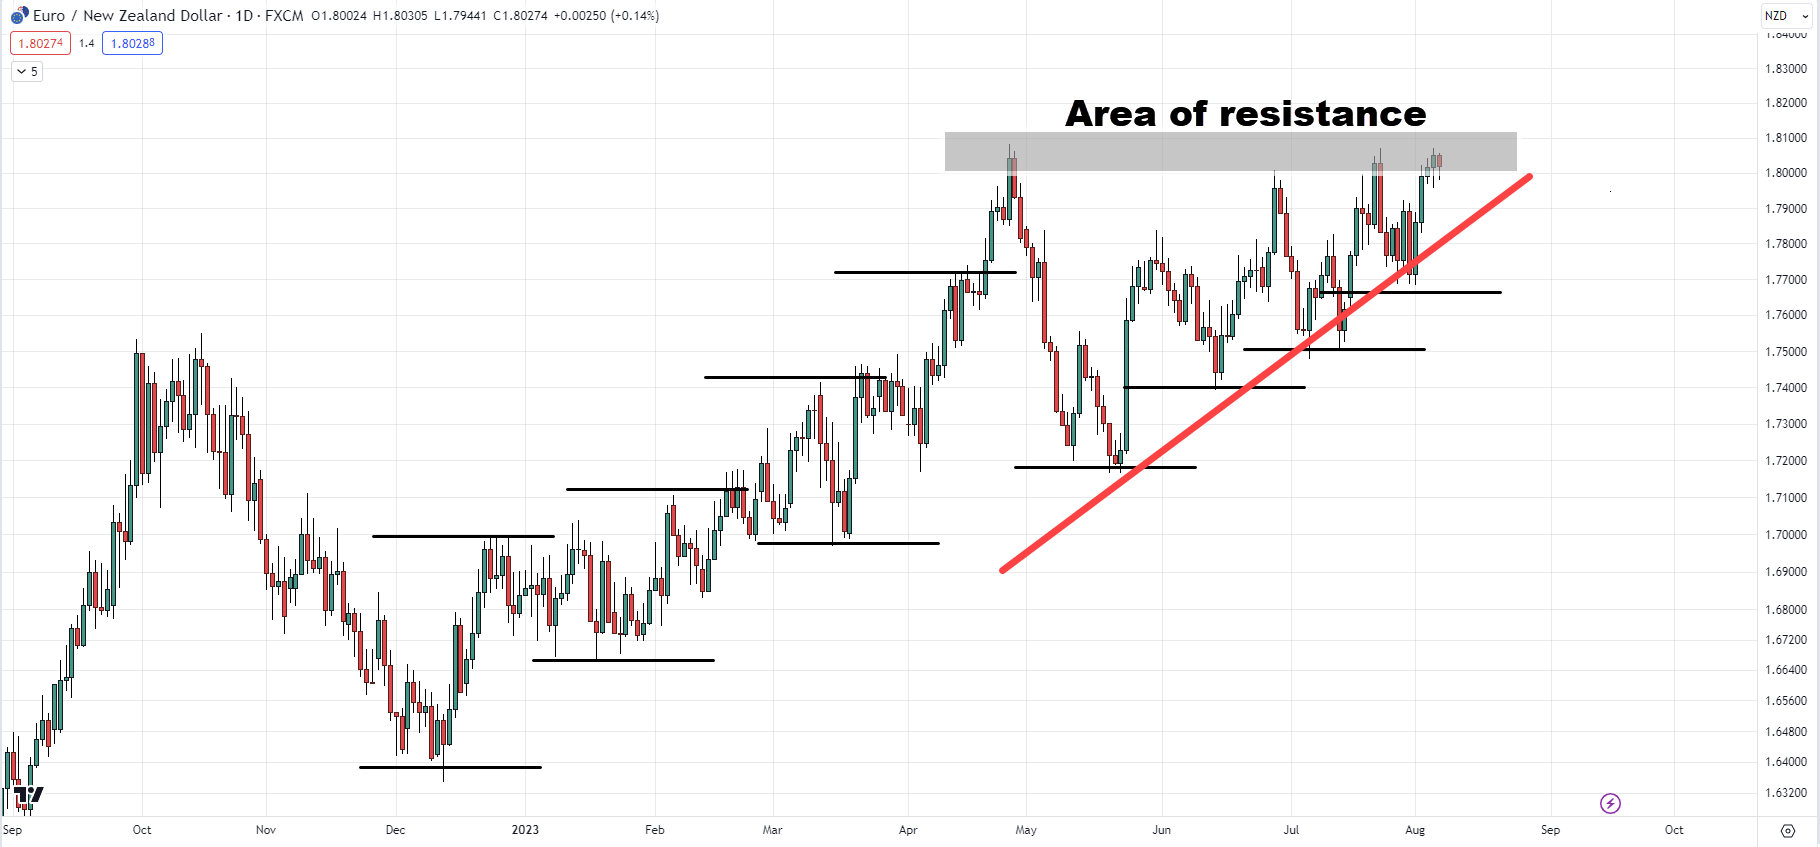
You can see that this market is in a long-term uptrend.
Notice the price making a series of higher lows and higher highs. This is what I mean:
There’s an area of resistance over here:
Forming an ascending triangle pattern.
There is a good chance that the market could break up higher of this resistance.
Since you know this market is in an uptrend, you’re going to look for buying opportunities.
Does that make sense?
How to trade the setup
You can see how zooming out will give you a clearer perspective.
Going back to the H4 timeframe, knowing what you know now.
There are a few ways you can trade this setup.
Buying opportunities in an uptrend
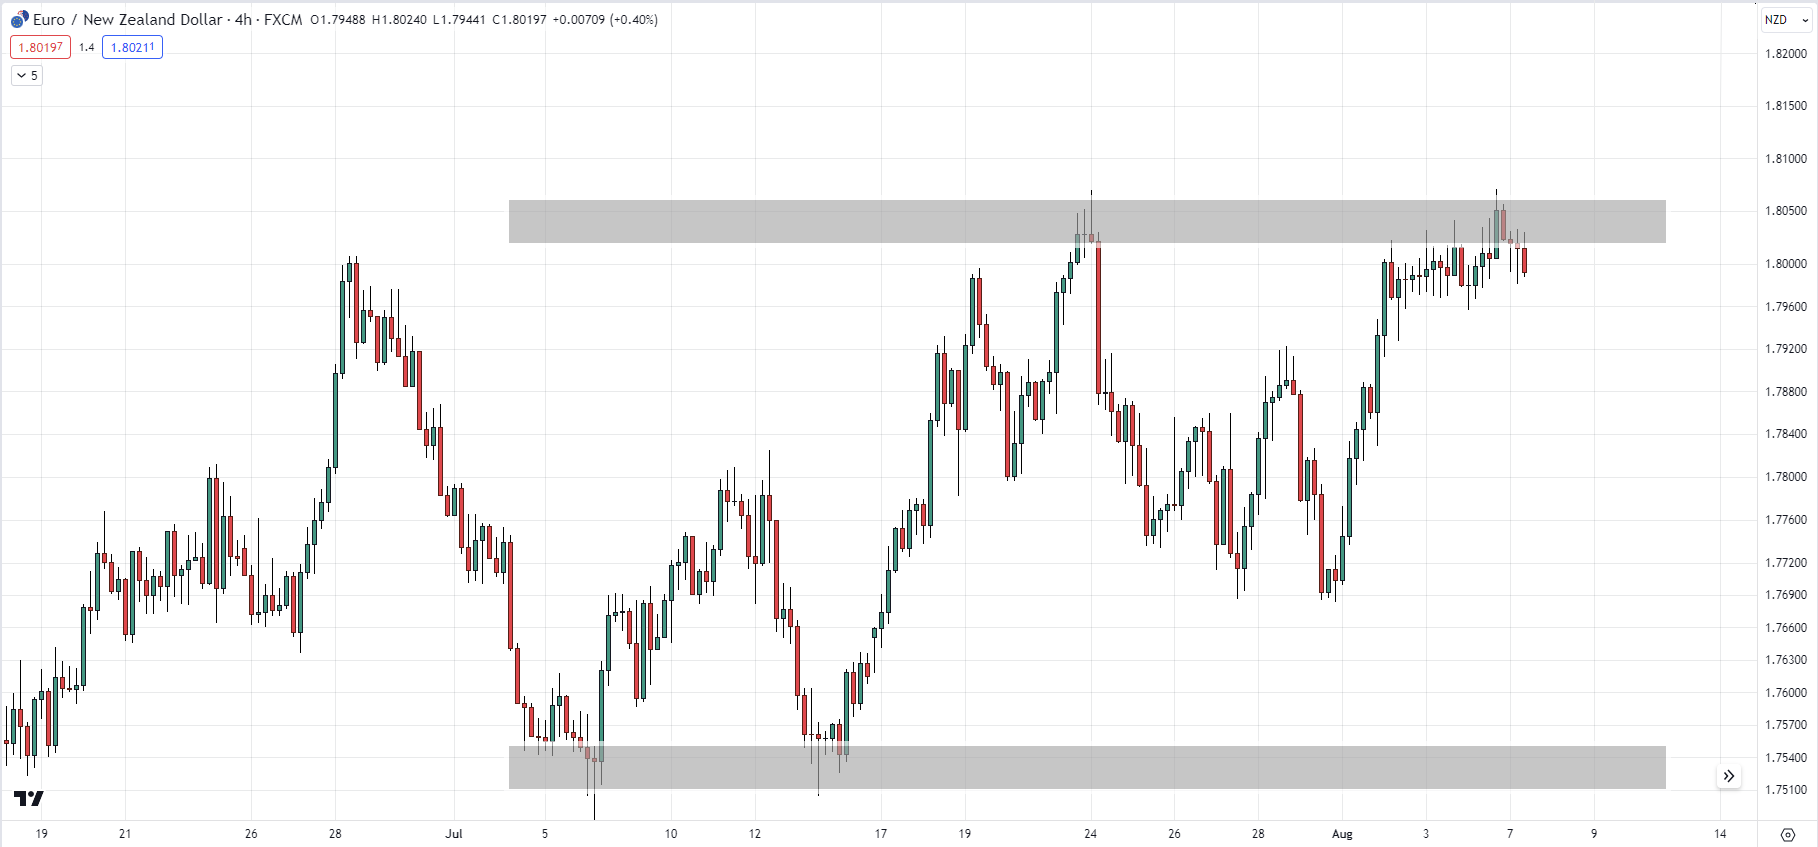
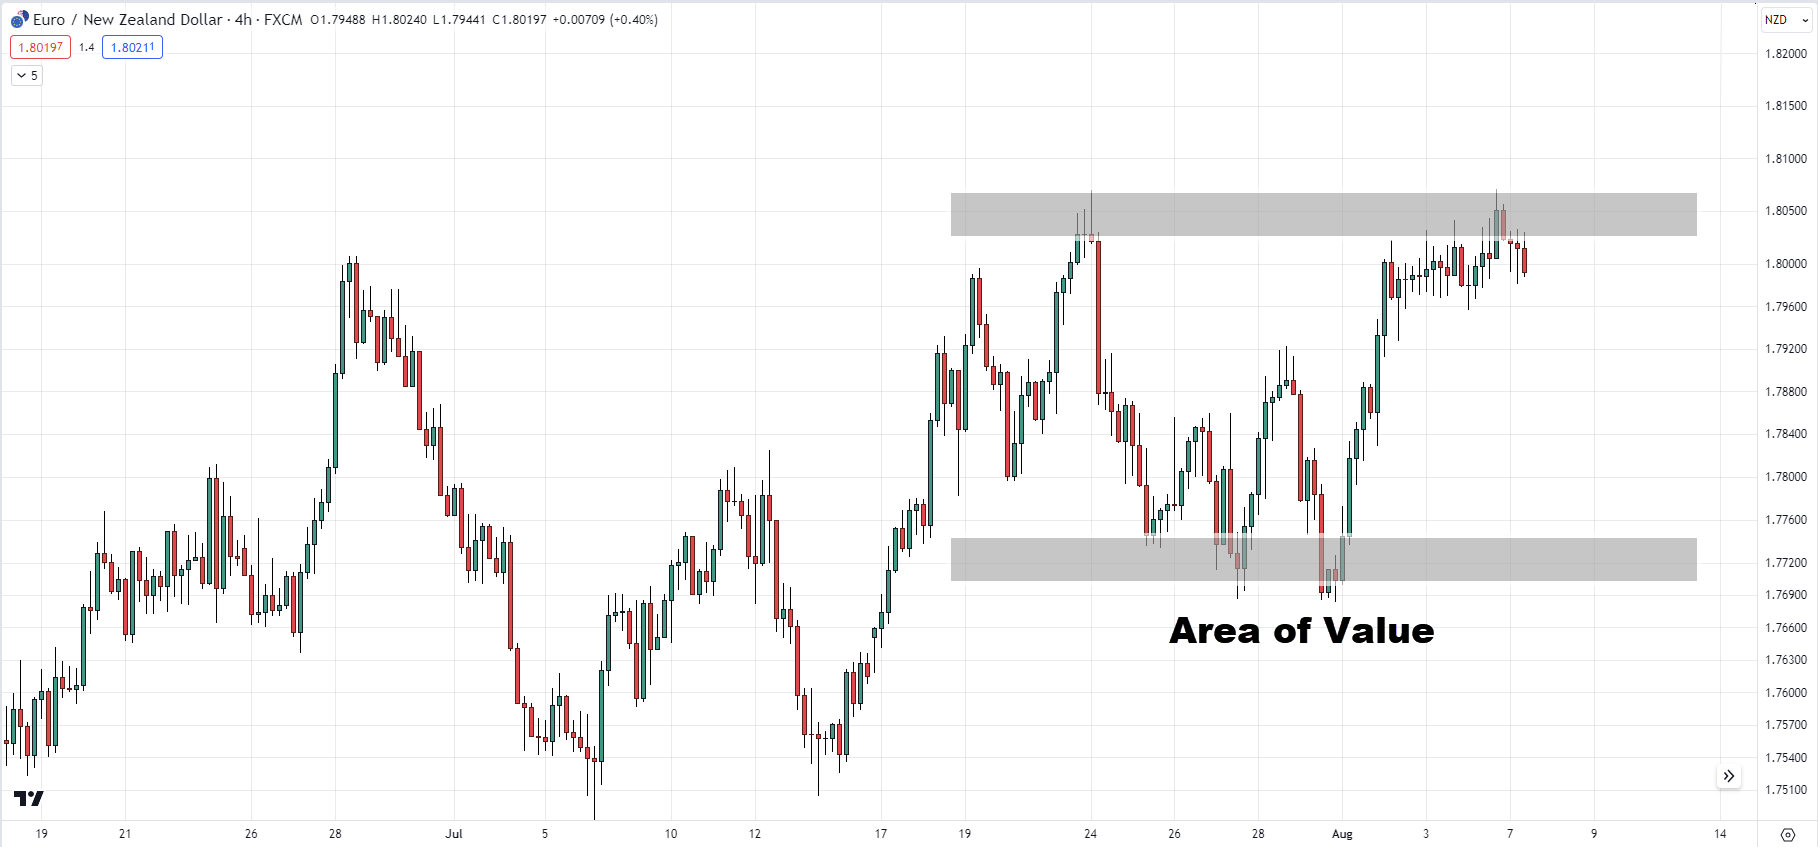
If you want to look for buying opportunities in an uptrend, this will be an area of value that you can look for. Here is an example:
This is an area of value.
If you look at this, perhaps the market could break out higher and then retest the previous resistance which could become support.
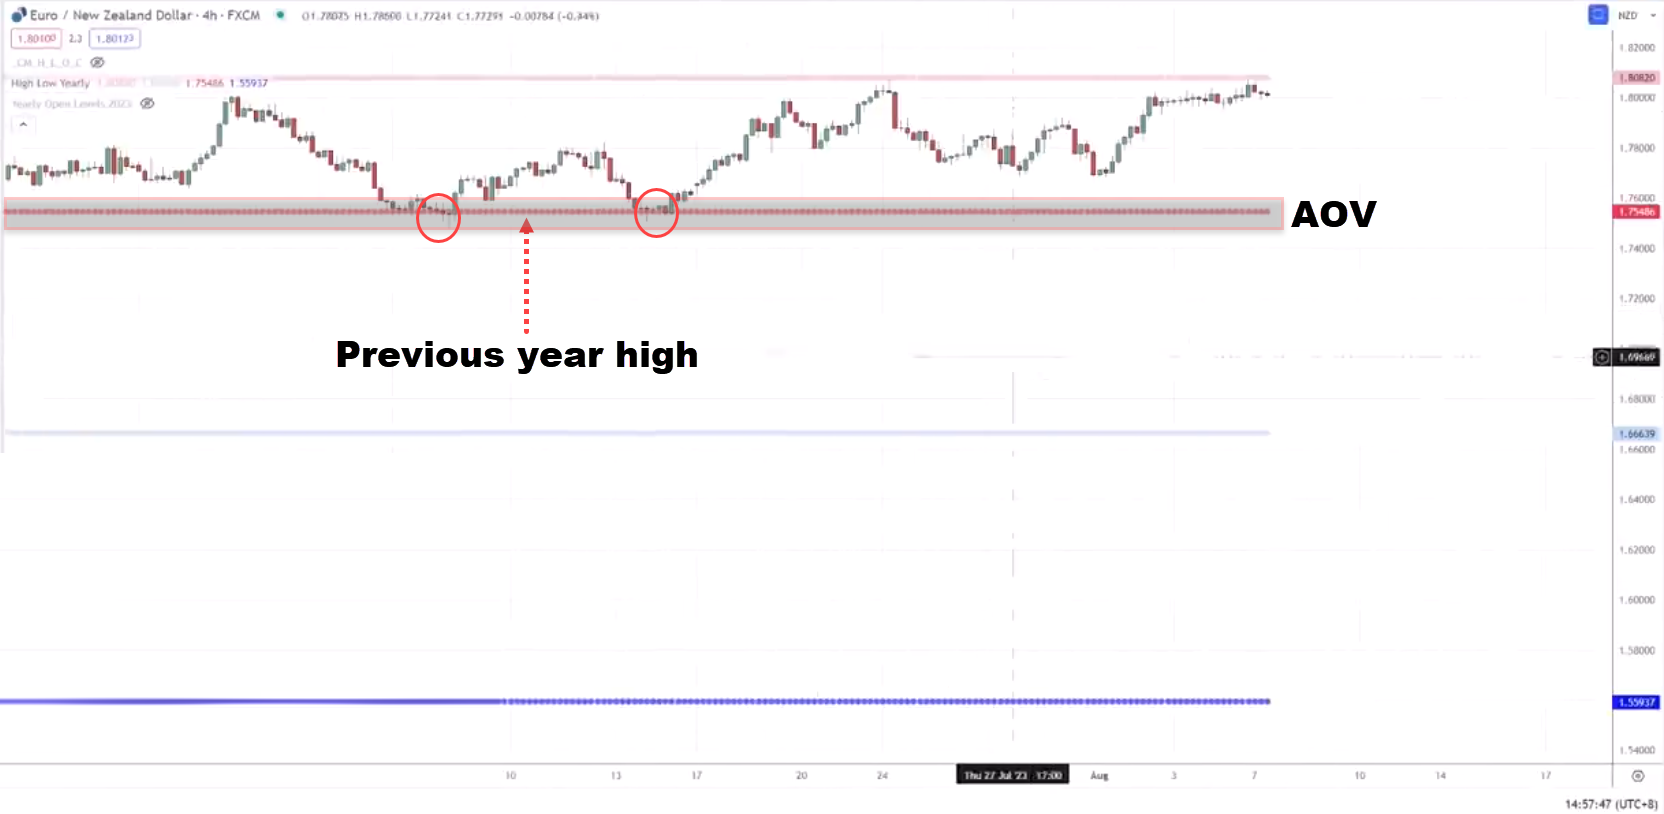
Let’s see… if our yearly high and low have any confluence.
Yes, we have…
You can see over here, that this is the previous year’s high. The market, let’s say makes a deeper pullback.
This is an area of value (AOV) and a key area of support.
Tested twice, and possibly here again.
This is where you have to look for buying opportunities towards the long side.
TIP:
If in doubt, just zoom out.
A quick way to know what timeframe to zoom out is you use a factor of 4-6
Previously, we were on the four-hour time frame. If you go by a factor of 6. Multiply 4 by 6hr which is equal to your daily timeframe.
Now, sometimes when you zoom out of your charts, things might still not make sense to you. And what do you do then?
This brings me to my third lesson.
Still in doubt? Stay out
If you’re still in doubt after zooming out, then stay out. Remember this…
“No position in the market is a position itself”
The last thing that you want to do is to force a trade maybe because you’re bored.
You have got itchy fingers, right?
For the fear of missing out you want to force the trade.
What happens next?
You end up incurring unnecessary losses that wouldn’t have occurred if you had followed your trading rules.
Your mental capacity and trading account are blown.
You have thought like, why am I so reckless? Why am I so ill-disciplined? Why am I so silly?…
Let me take back what’s mine from the markets.
When you have such thoughts, what you’re going to do is you start to revenge trade.
You start to widen your stop loss, which is out of your trading plan. What happens is that you end up suffering even more.
You don’t want to go down that path.
To sum it up is very simple. If in doubt, zoom out. If you’re still in doubt, then stay out.
Honor your stops
This is important so pay close attention.
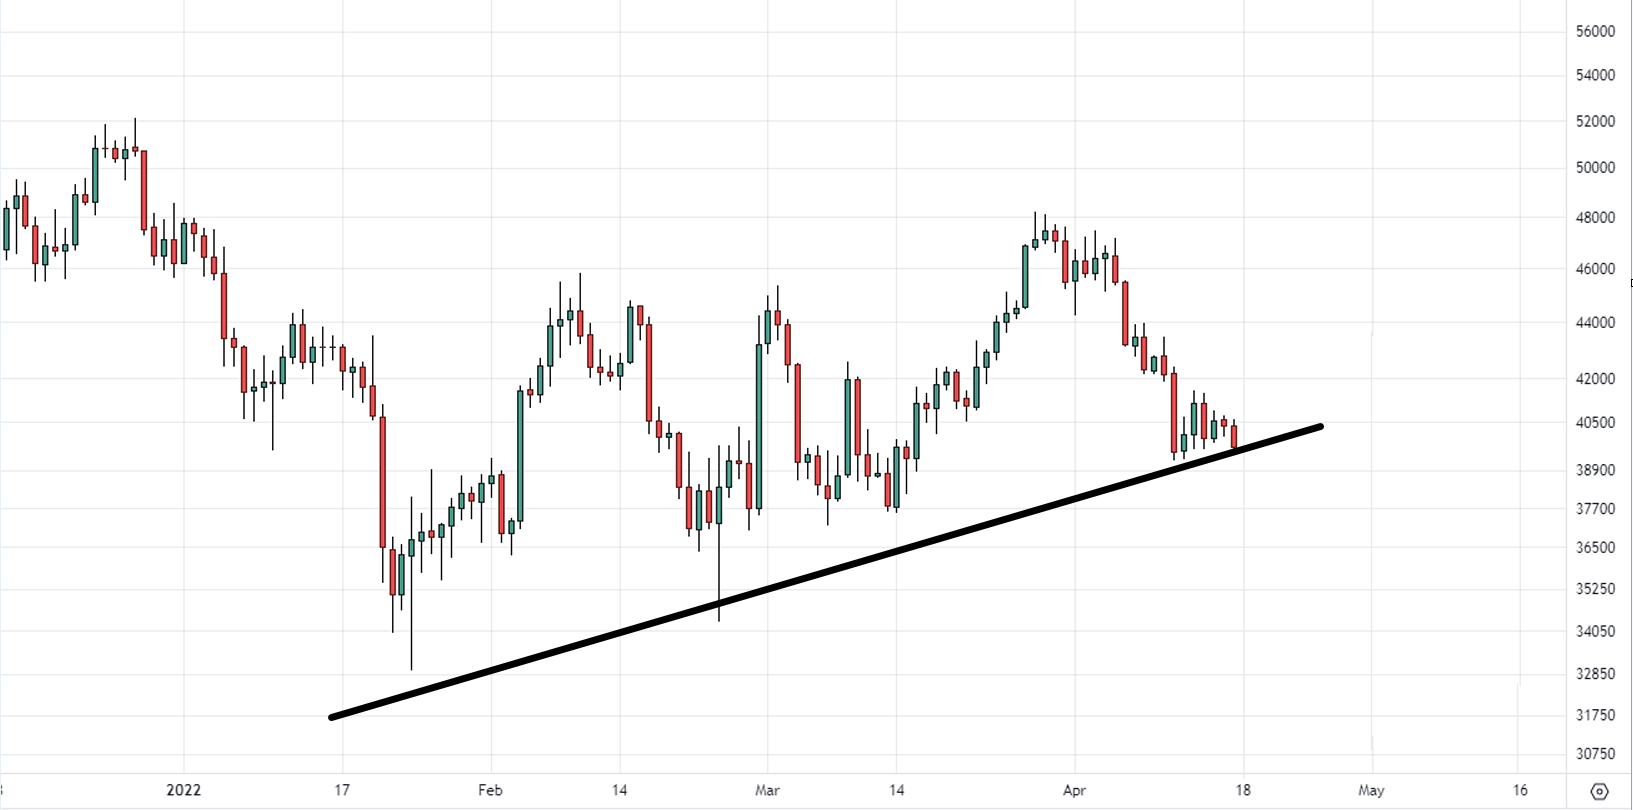
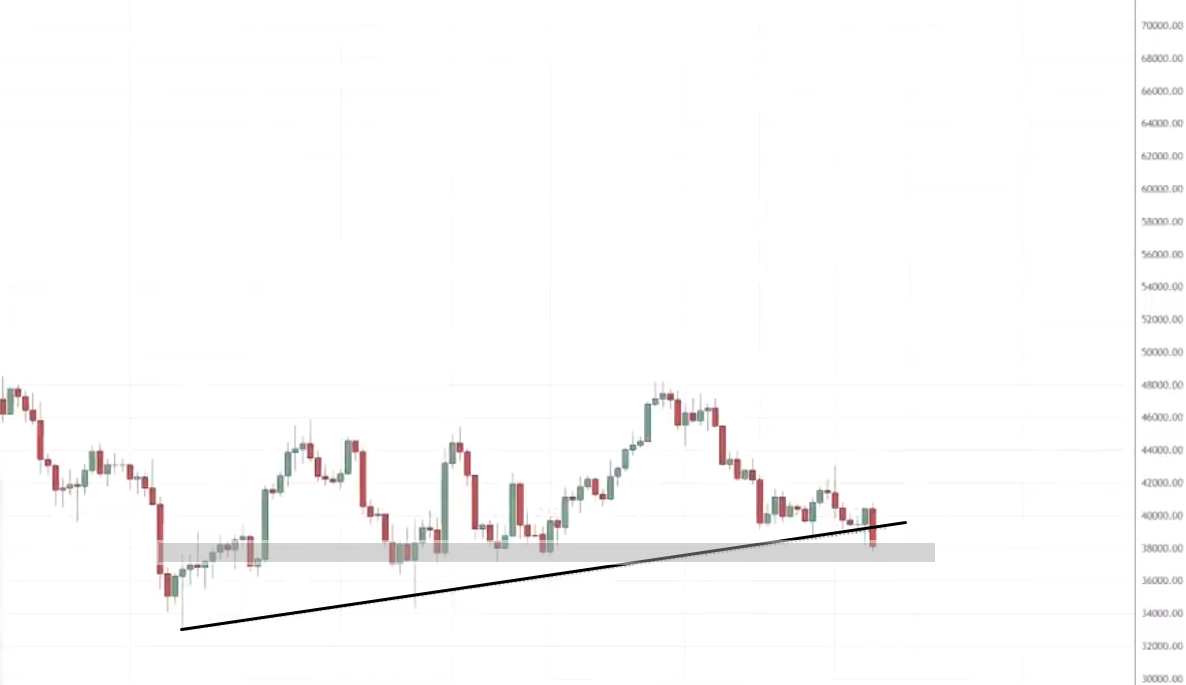
BTCUSD
Some traders might even draw this trendline and then say,
“Hey, you know, Rayner, this could be the reversal of Bitcoin and the market could go up higher”
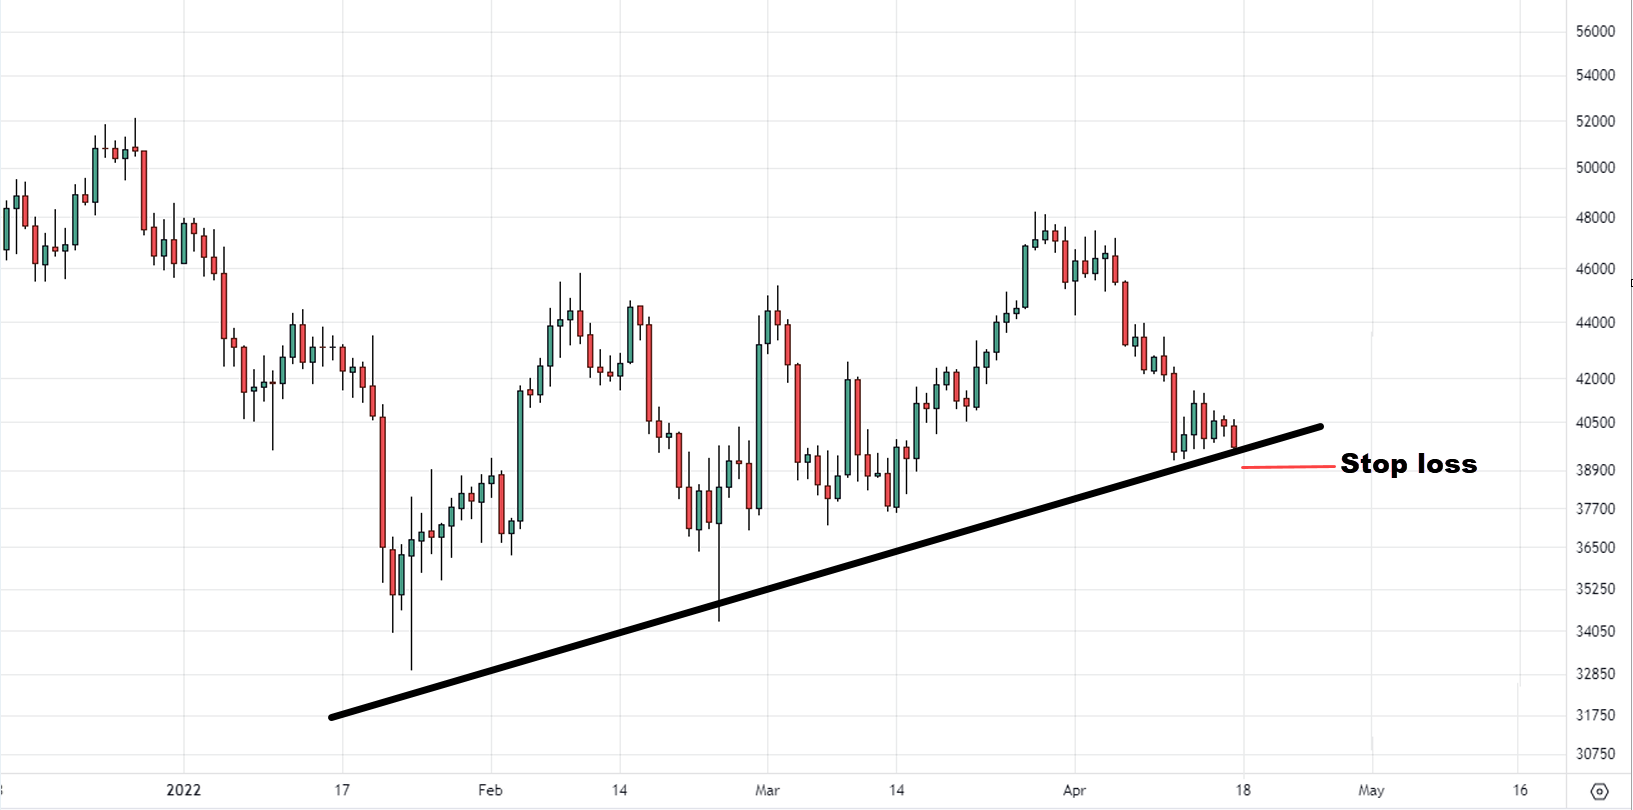
They look to enter on the next candle open. Stop loss, possibly below this low or around $38,000 price. Here is what I mean:
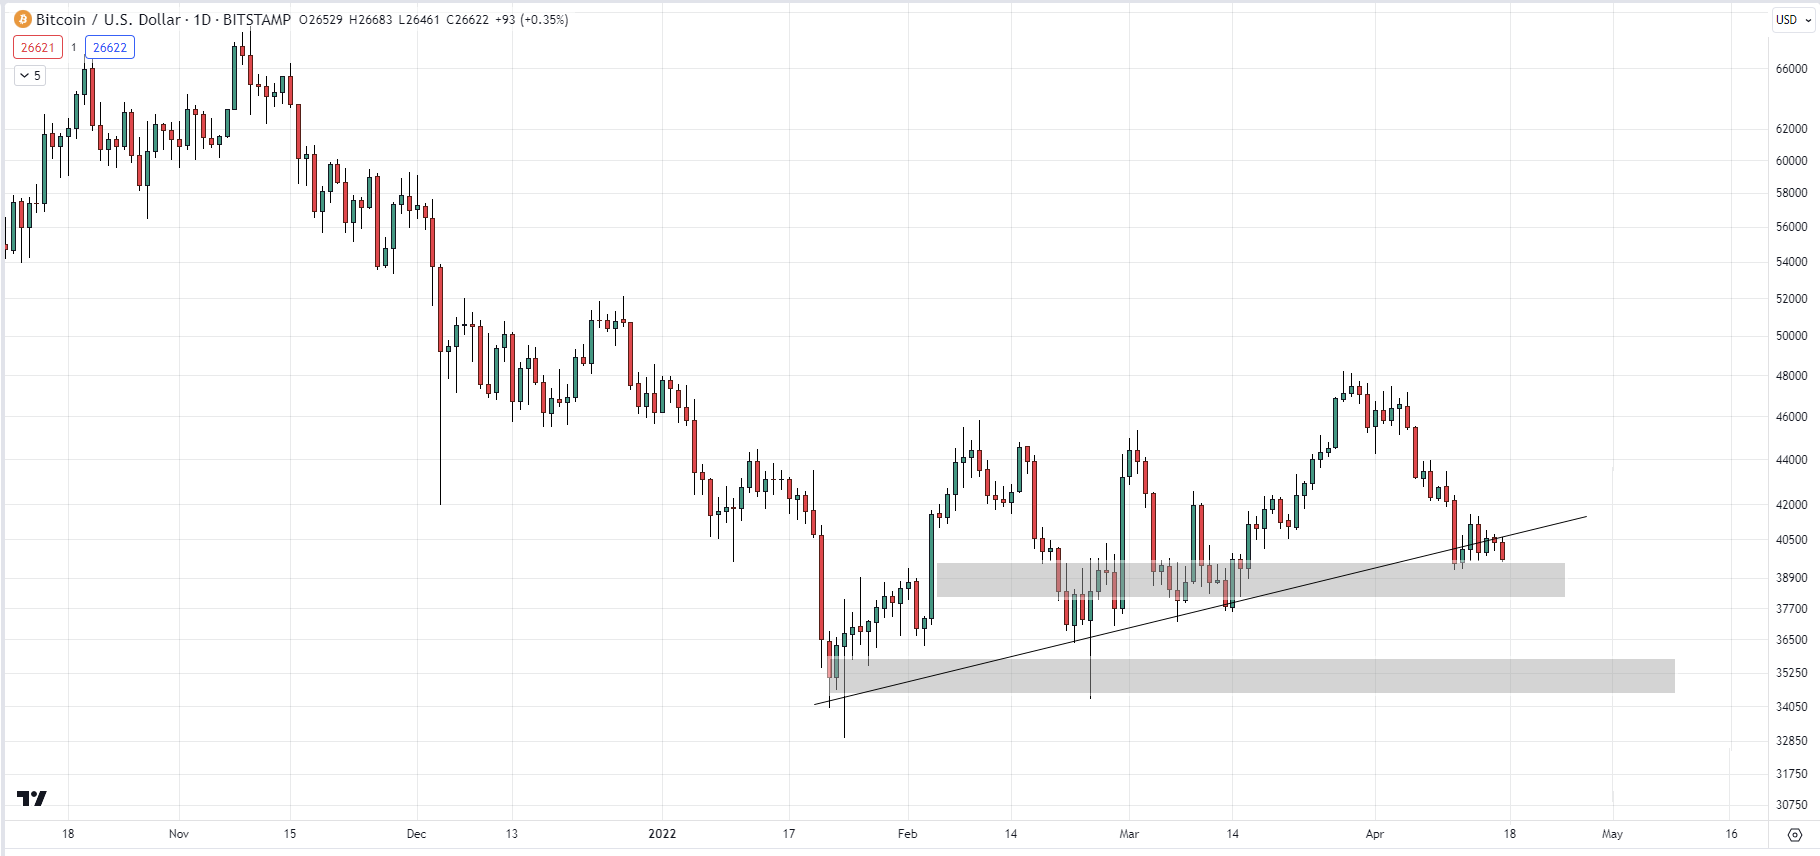
Let’s see what happens next.
The original plan was to go long on the next candle open stop loss at $38,000.
Then you see the market rally up higher and start to reverse against you… For example:
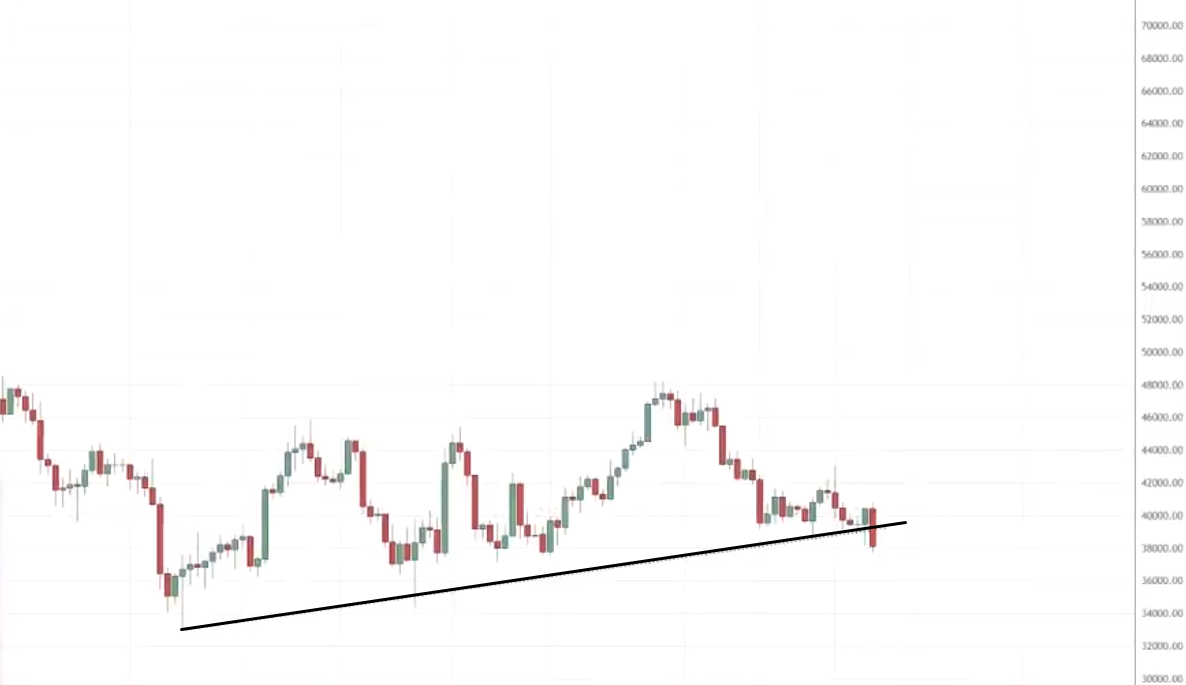
Again, another reversal at this trendline.
Boom!!!
The market reversed against you and probably would have hit your stop loss.
But at this point, some traders might argue
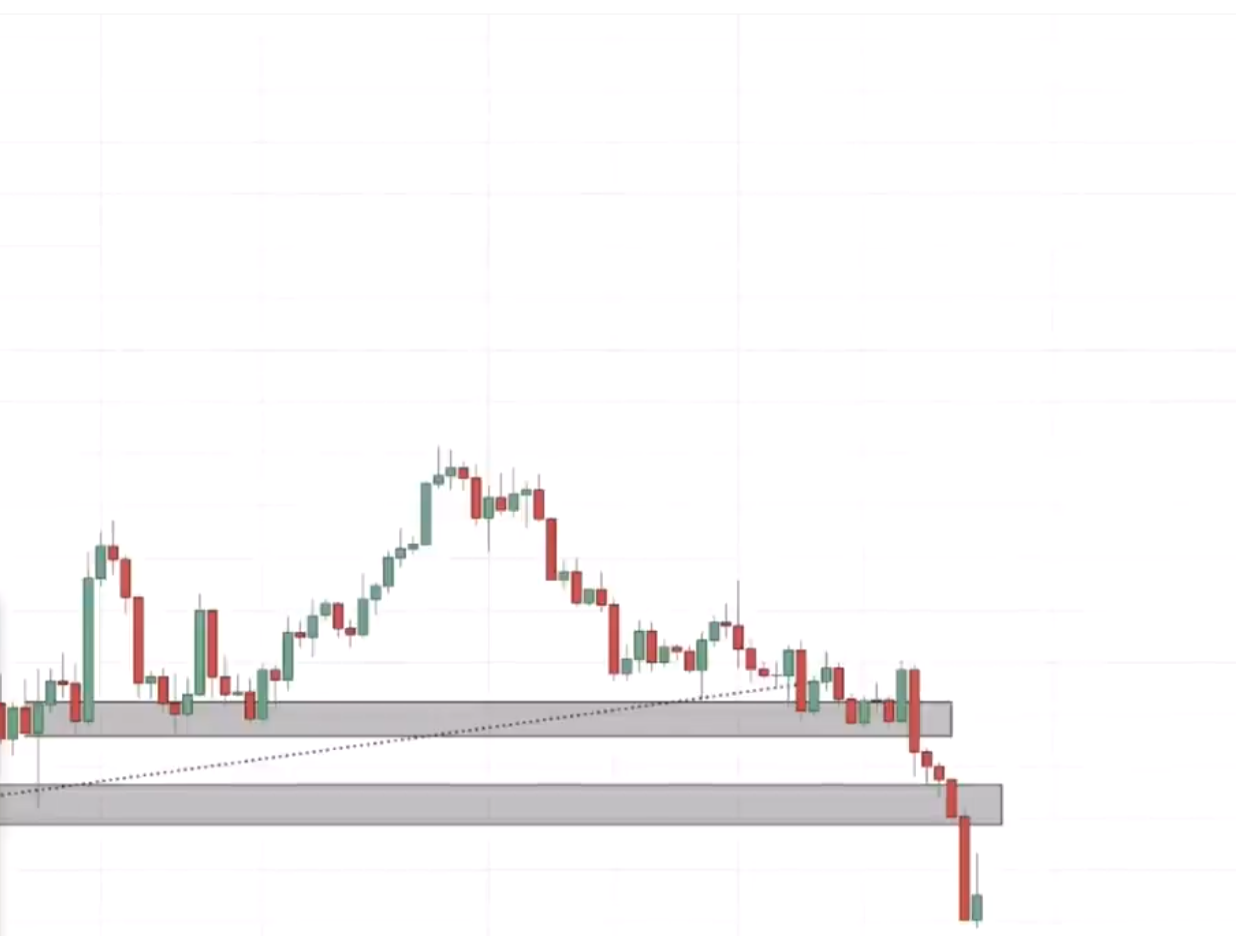
“But Rayner, if I were to cut my loss here, I’m cutting into this area of support.”
Then there’s possibly another area of support:
I don’t want to be cutting my loss into this area of support.
Because buyers are coming in and could push the price higher.
So let me hold on to that trade and maybe the market could just reverse higher shortly.
Let’s see what happens next…
You can see shortly afterward the market collapsed even lower.
You might be thinking.
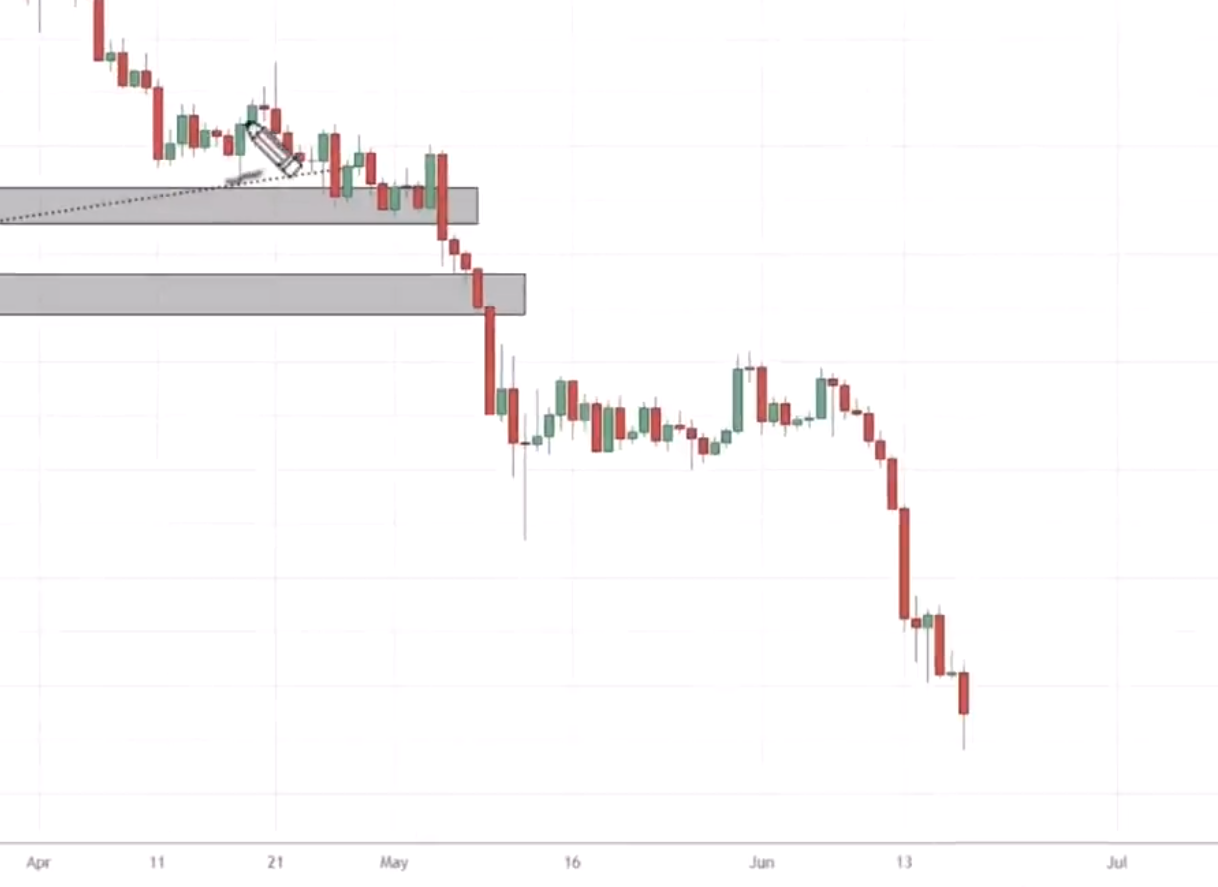
“Rayner, right now the market is oversold, the rebound has to occur, the market has to rally a buyer”
When the next rally comes, I will exit a trade for a smaller loss or maybe a break even.
You don’t want to take this huge loss at this point.
See what happens next.
You hold onto the trade, and the market collapses even lower.
Right now, the market is over here. If you had risked 2% of your account at the start now, you’re probably down 15-25% of your account.
What is the lesson over here?
The lesson over here is to honor your stops. Every large loss starts as a small loss.
That’s not all because a small loss is a good loss.
Why is that?
It’s because you preserve capital, you get to clear your mind and more importantly is that if a trading opportunity presents itself, you can reenter it with a clean state of mind.
If you fail to plan, you plan to fail
Let me ask you…
Do you know the reason why so many traders lose money in markets?
Here’s why…
You look at a chart and you see a series of big bullish candles you know, three big candles in a row and here they will think to themselves…
“Rayner, look how bullish this price action is, let me just buy and catch a small piece of the move”
I’ll quickly get out of the trade before the market reverses against me.
Now, what is the problem with this?
Well, simple…
Let me ask you.
If the market were to reverse against you shortly after you hit buy… Where do you exit?
If the market, let’s say, does move in your favor, when will you take profits?
If the market moves in your favor and then starts to reverse the gains, do hold on to the position thinking that you will continue higher?
Do you exit the trade for whatever small profits or a small loss that you’ve incurred?
Can you see where I’m coming from?
If you can’t answer any of the questions that I asked earlier, it means that you have failed to plan.
This is why if you do go out there you see families with many kids, 3-7 kids, clearly, the couples probably fail to plan.
That explains why I have three kids myself ha-ha.
How do you avoid getting caught when the market catches you off guard?
I’m going to share with you this very simple checklist:
Do you know why you are entering the trade?
The answer is very simple. It has to be because you’re following your trading plan, your trading rules, and your trading strategy. Anything like FOMO and itchy fingers.
You shouldn’t be entering the trade at all.
Do you know when to get out if you are wrong?
The trading setup could be perfect, all the stars are aligned, and you could still get it wrong. The market could still turn against you.
When do you get out if you’re wrong?
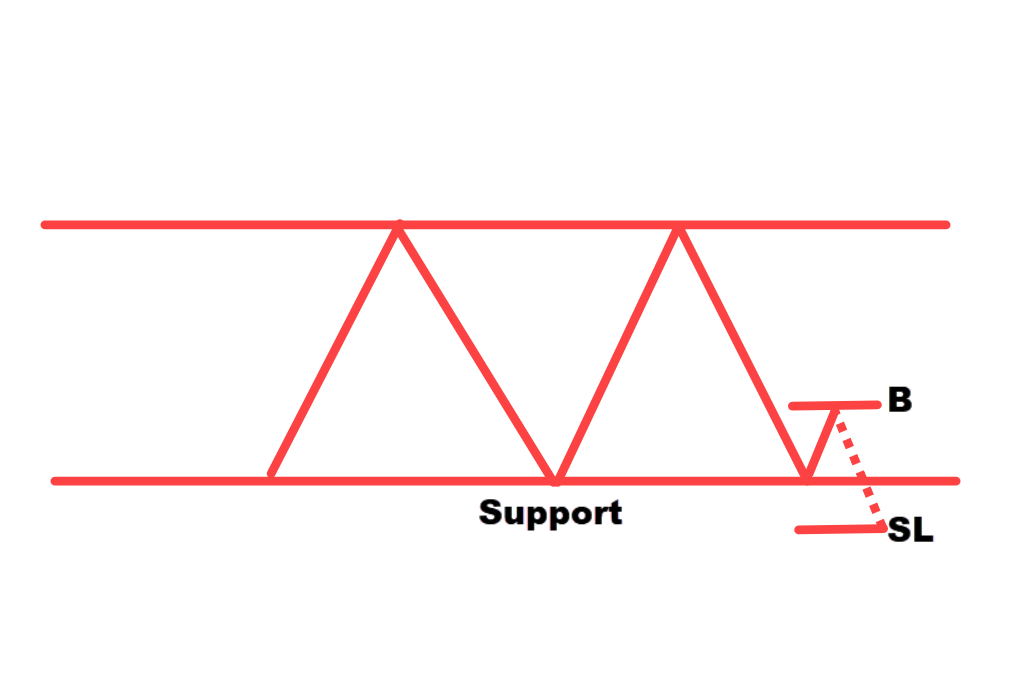
A very simple rule that I follow is to set your stops at a level where your trading setup is invalidated.
Let’s say you buy when the price comes into support, and you have an impulse to buy. At which price on this chart will your trading idea be invalidated?
If the price breaks below support, then your trading setups are invalidated. If the market comes down to hit your stop loss.
Clearly, at this point, the area of support is broken, you should get out of the trade.
If you are wrong, is the loss a fraction of your account?
Ideally, you want to make sure that your loss is not more than 1% of your account. This way if you incur 4-7 losses in a row, it’s still not the end of the world, because it’s only a fraction of your account.
Do you know when to get out if you are right?
What if the market starts to move in your favor, where do you take profits?
The last thing you want to do is to hold the trade forever, and then watch it come back to your entry hit your stop loss, and all is gone.
A technique that you can consider is…
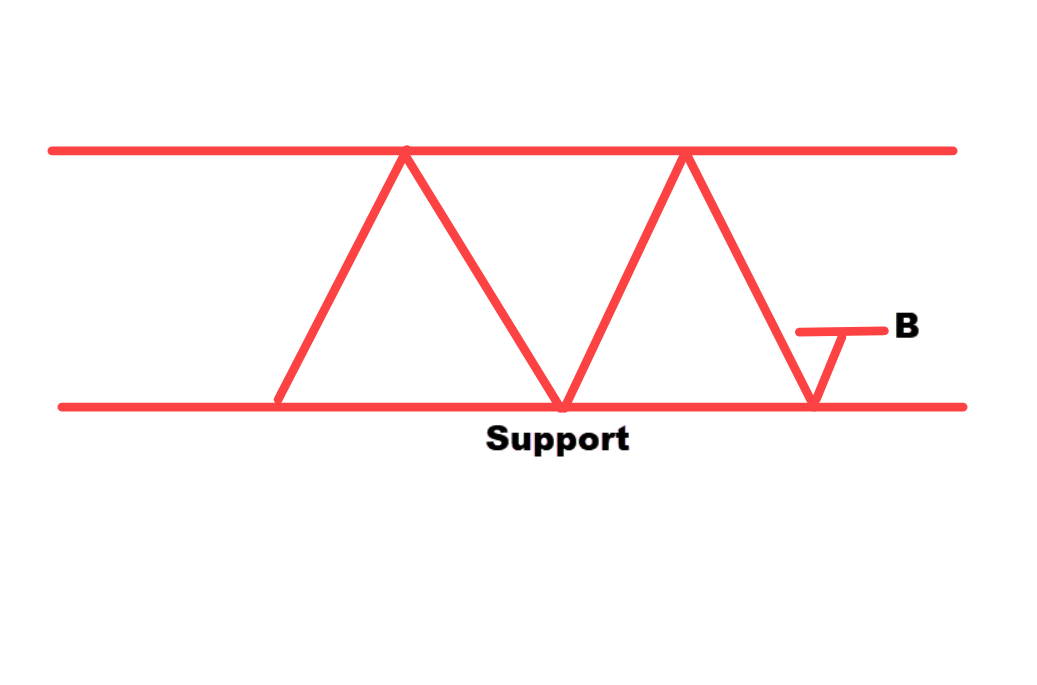
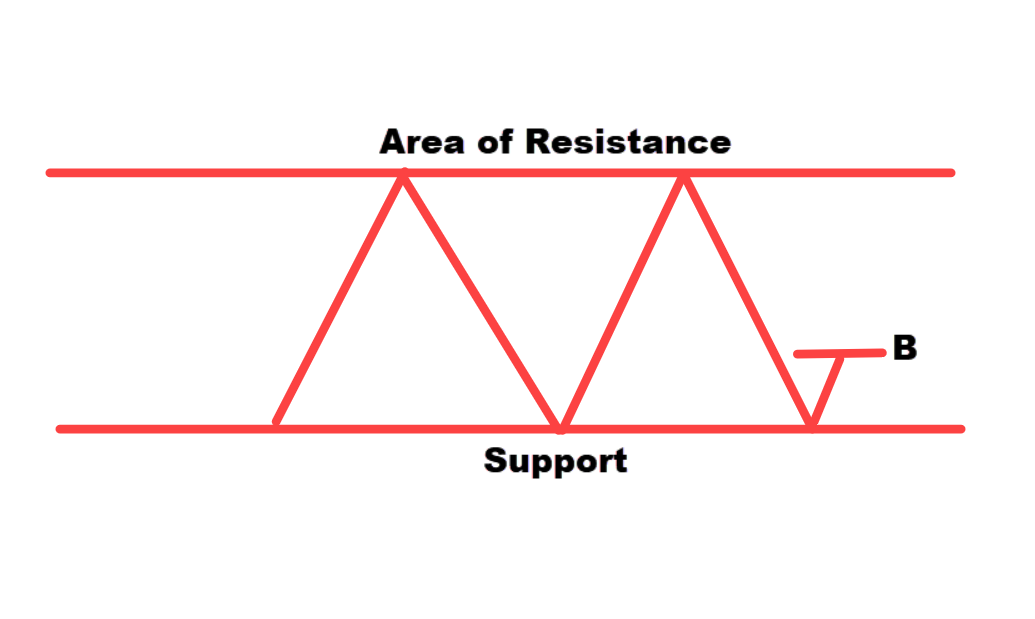
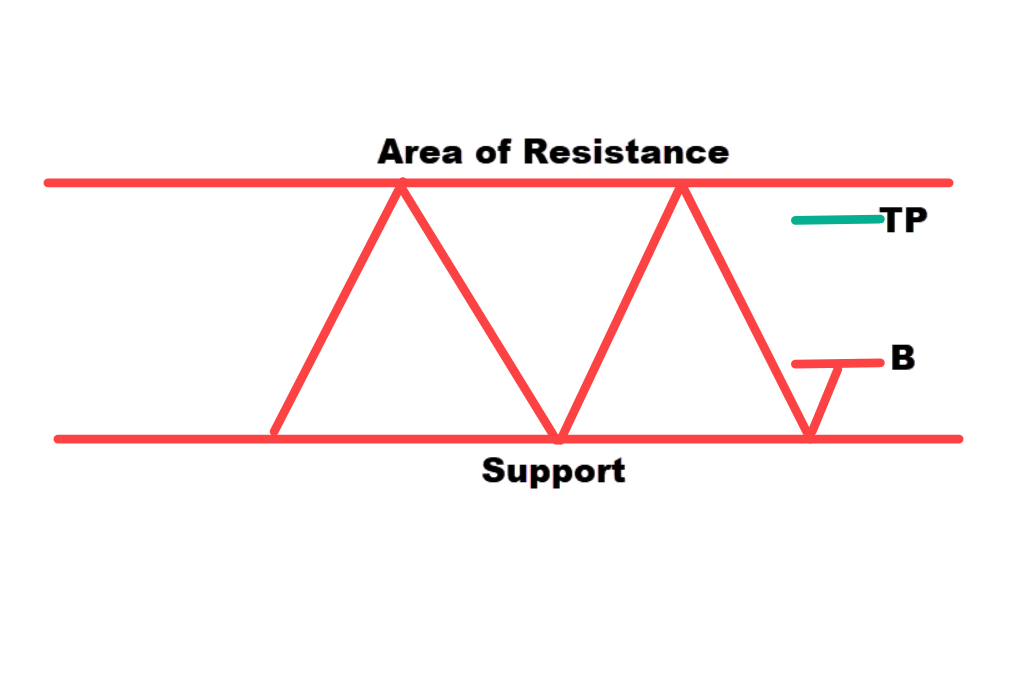
Market in a range.
Then it comes down to this area of support, which goes up higher, and then you buy.
If you want to capture a swing, you can look to exit your trade before opposing pressure steps in.
Let’s say you buy near support, where my opposing pressure coming in is that this area of resistance, here is an example:
Somewhere about here could be your take-profit level to exit a trade before the opposing pressure steps in.
This is where you get out if you are right.
The Holy Grail of Trading
After trading for more than 10 years now, I will say this is the closest thing to a free lunch that you can get in trading.
It’s what I call the holy grail of trading.
To explain this concept, let me share with you a couple of trading systems that I teach in my premium program called The Ultimate Systems Trader.
Mean Reversion Trading System
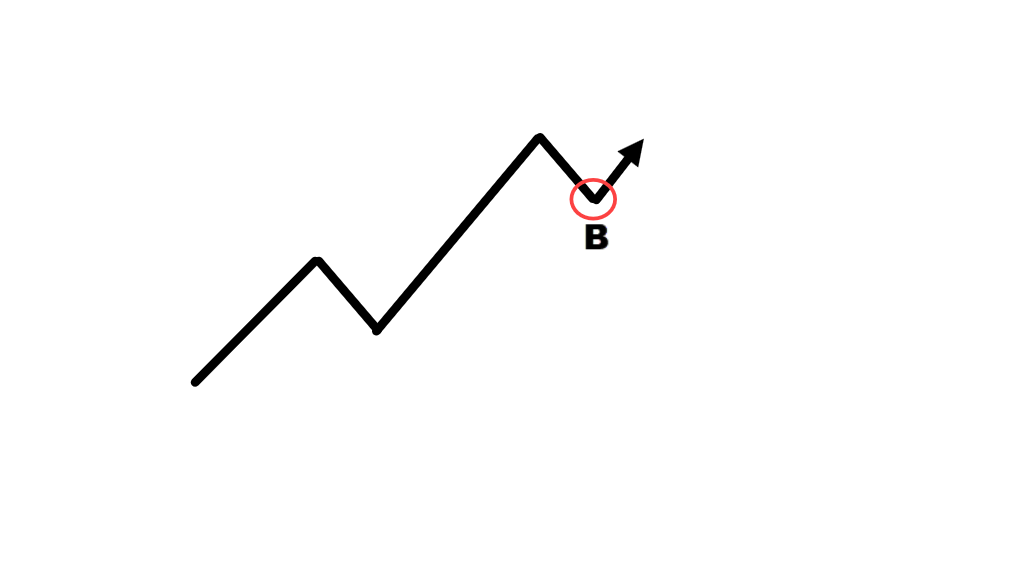
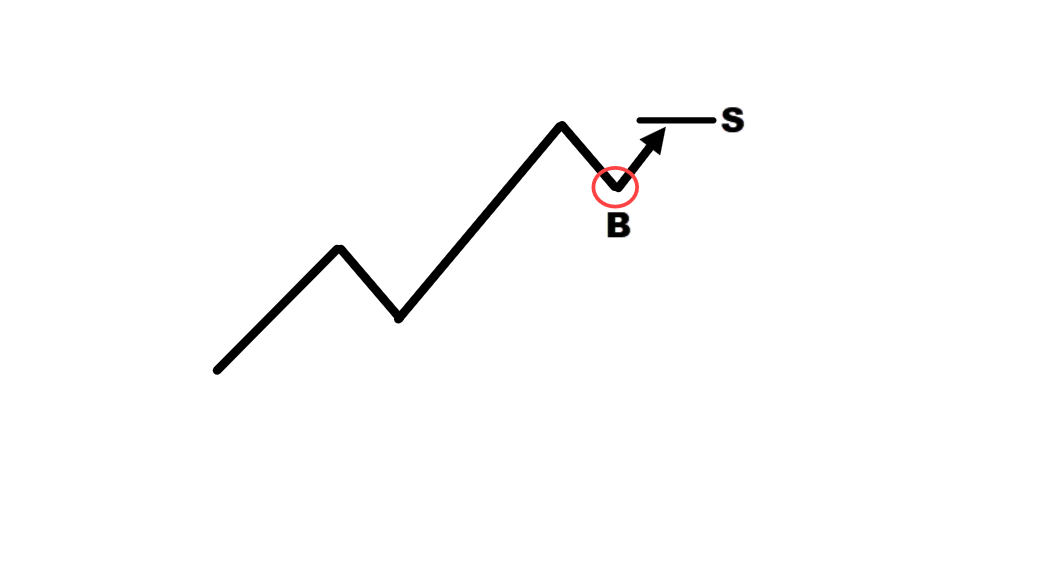
The idea behind this trading system is very simple. We are looking to identify stocks, that are in an uptrend, we wait for a pullback, and then we look to buy.
When the stock hits higher, we look to capture that one swing, and we sell over here.
You can see we are trying to capture this swing out there in individual stocks. That’s the mean reversion trading system.
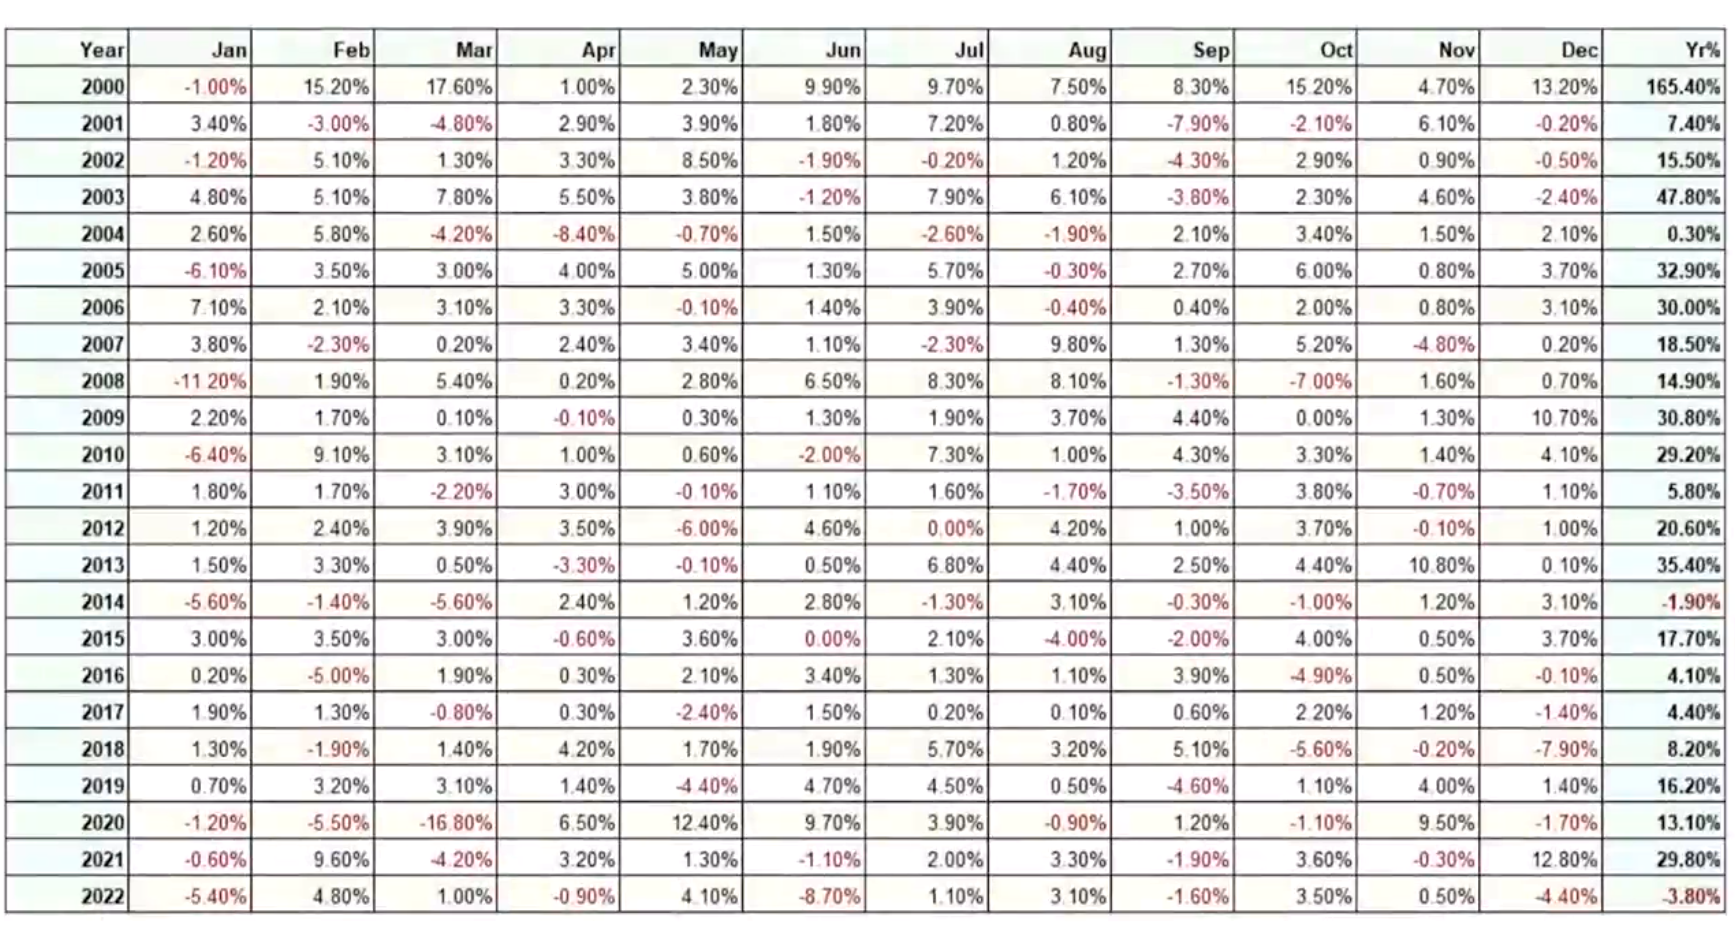
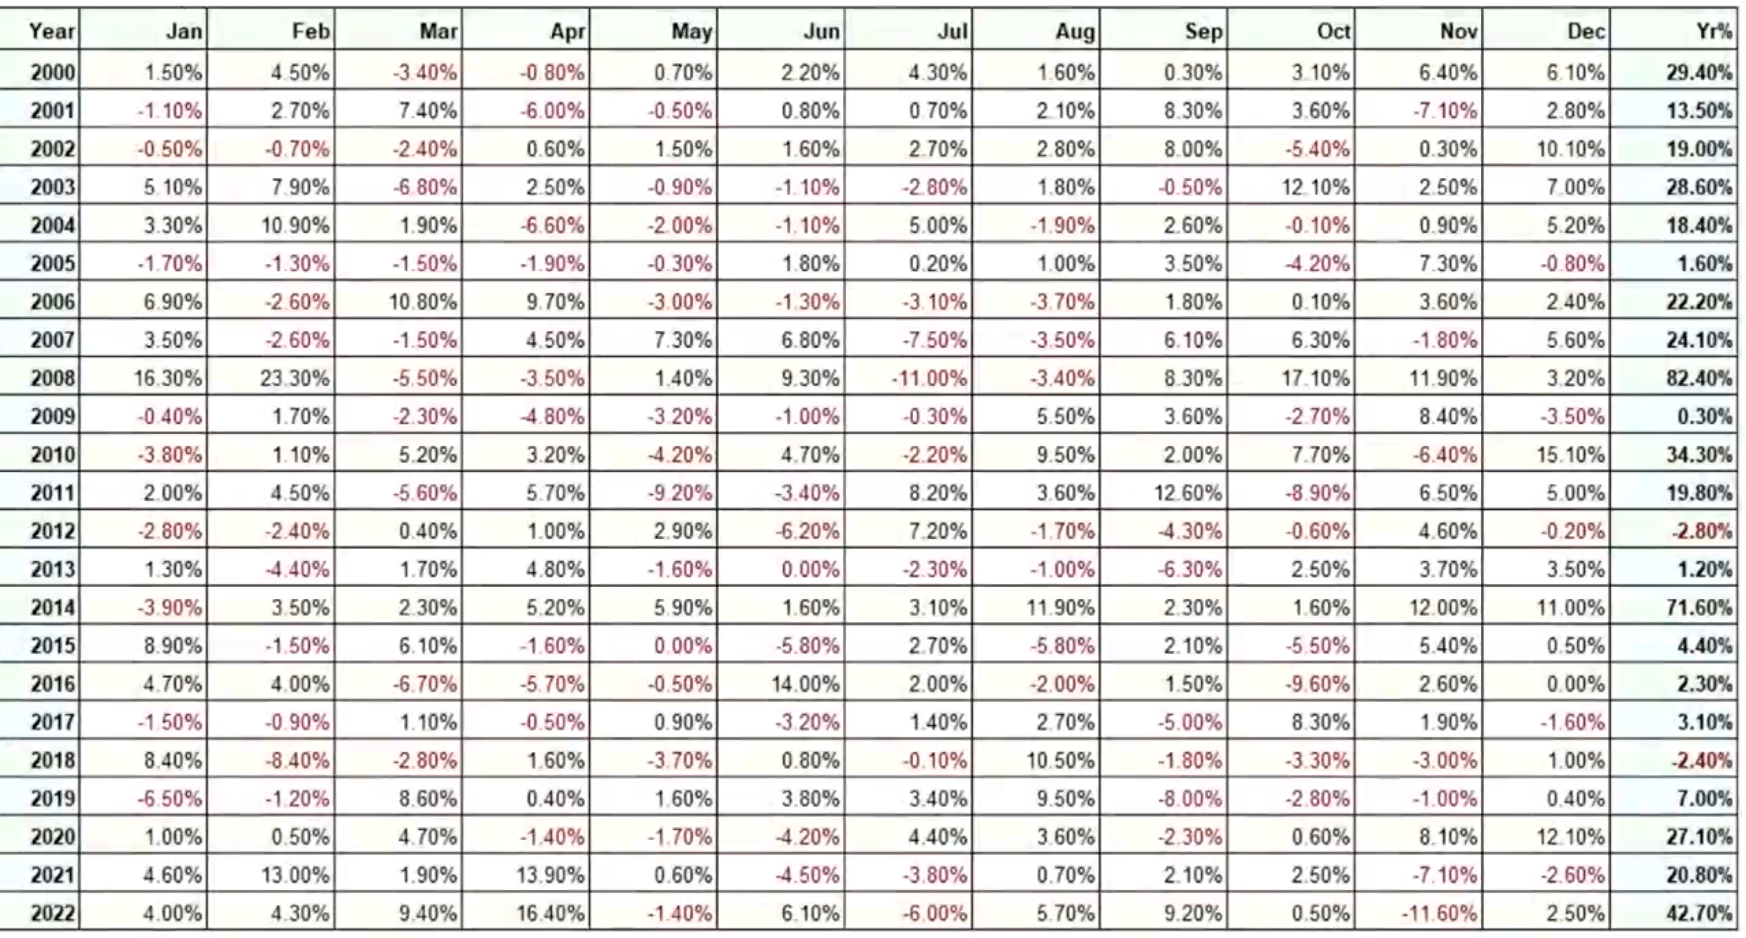
You can see that this is the performance of this system over the last 23 years:
In 2000, It was up about 165%. In 2022, Down 3.8%, and in 2021 Up 29.8%.
This is how you read this table.
Systematic Trend following system
This system looks to ride trends across the commodities currency pairs, indices, and all the different futures markets.
What we do is we identify markets that are already trending
Then ride the trend for as long as it lasts until it shows signs of weakness or hits our stop loss.
This is the result since 2000-2022:
2022 it’s up about 42%. A losing year in 2012 for 2.8%.
In 2000 we are up about 29.4%.
What’s interesting about this system is that it does well during a crisis period in a recession.
Example:
In 2008, It was up 82%. In 2022, we had the Russia/Ukraine crisis it was up about 42% and in 2000 we had the dot com bubble up 29%.
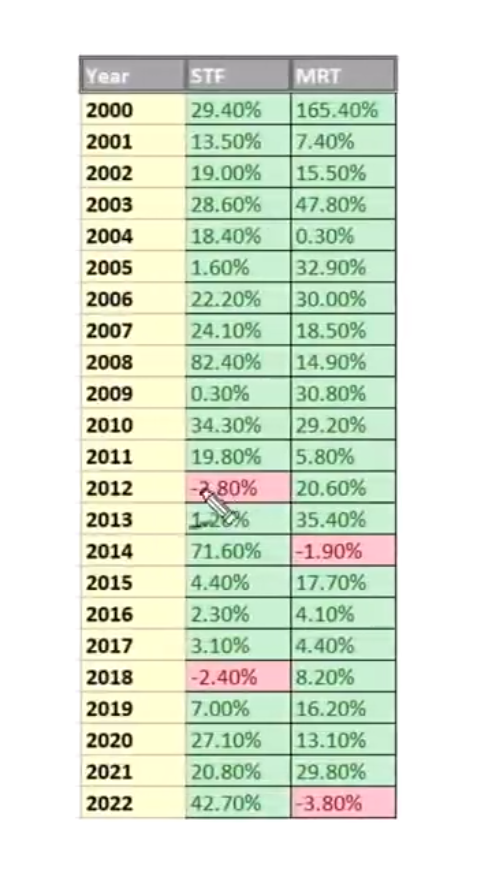
One thing to note is that both of these trading Systems, make money in the long run, but on a year-to-year basis.
You can still have losing years, in 2012, the systematic trend following is down -2.8%. In 2018, it was down 2.4%.
Same for the mean reversion trading. In 2014, it was down -1.9%. In 2022, it was down -3.8%.
Now the question is…
How can you reduce the number of your losing years such that you can make money almost every year from the markets?
The trick is that you want to trade multiple uncorrelated systems.
This means that if you have $100,000, don’t put all $100,000 in a single market trading system
Instead, put $50,000 in each of these trading systems. Split it into two equal parts.
Here’s what happens next.
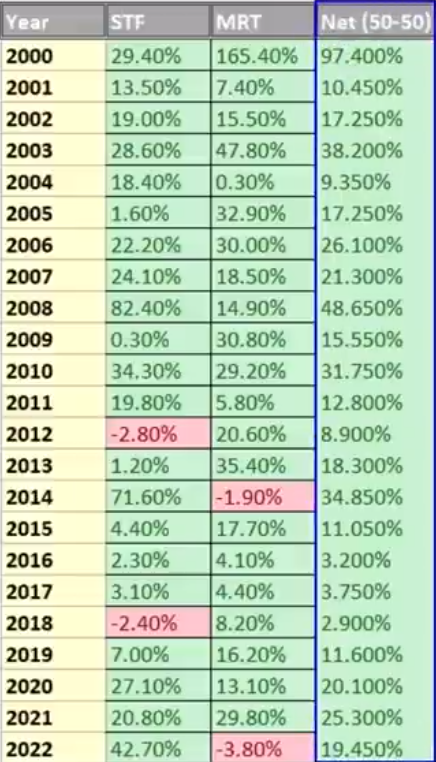
You can see over here in the last column: that this is the result of trading multiple uncorrelated trading systems.
As you can see, from 2000-2022, you have been making a profit every single year for the last 23 years.
That’s the power of trading multiple uncorrelated trading systems.
If you ask me, in my opinion, that’s the holy grail of trading.
The reason why this works is that whenever a system does poorly in one year, chances are you have another trading system that will do well in the market condition so that this way can cushion the losses.
Go Slow, to Go Far
Here’s the thing for many traders, they have unrealistic out-of-this-world expectations of what trading is supposed to offer.
They think…
“Man, I’m supposed to make 100% return a year. If not, I can’t be called a trader”
Not sure where to get those ideas from.
Here’s the argument.
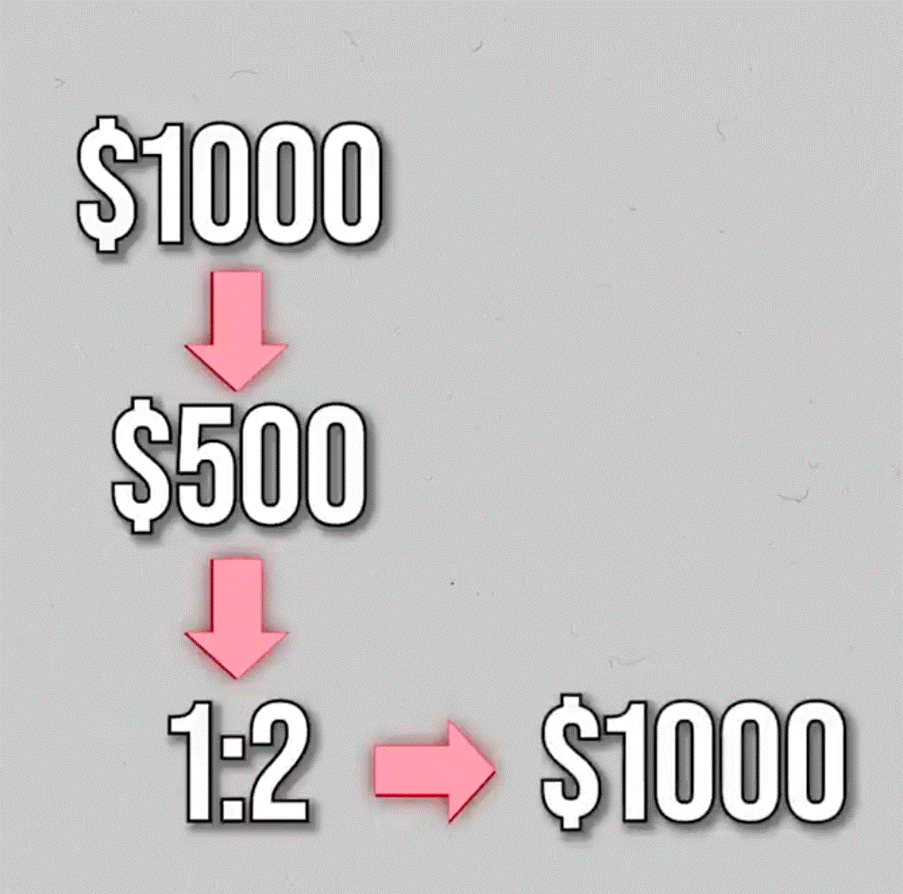
Let’s say they have a $1,000 trading account, and then they would think I’ll just risk 50% of this account, which is $500 on one trade and if I earn a 1:2 risk-reward ratio on this particular trade, I will then make a profit of $1,000.
Let’s say if you start with $1,000, you make a profit of $1,000. That is a 100% return.
“That’s how trading is done!!!”
You’re crazy…
What’s the problem with this?
The problem with this is that you are always just two losses away from blowing up your trading account.
This process will rinse and repeat itself over and over again until you quit trading altogether.
Only realizing that this is not sustainable, or you find a better way of doing things.
What’s a better way of doing things?
Let’s say again, you have a $1,000 trading account. Then what you can do is that you don’t look for 100% return a month.
Because you’re taking a lot of risk to accomplish it.
Instead, just aim for a 20% return a year, risking 1% of your account on a straight 20%/ year.
That’s doable.
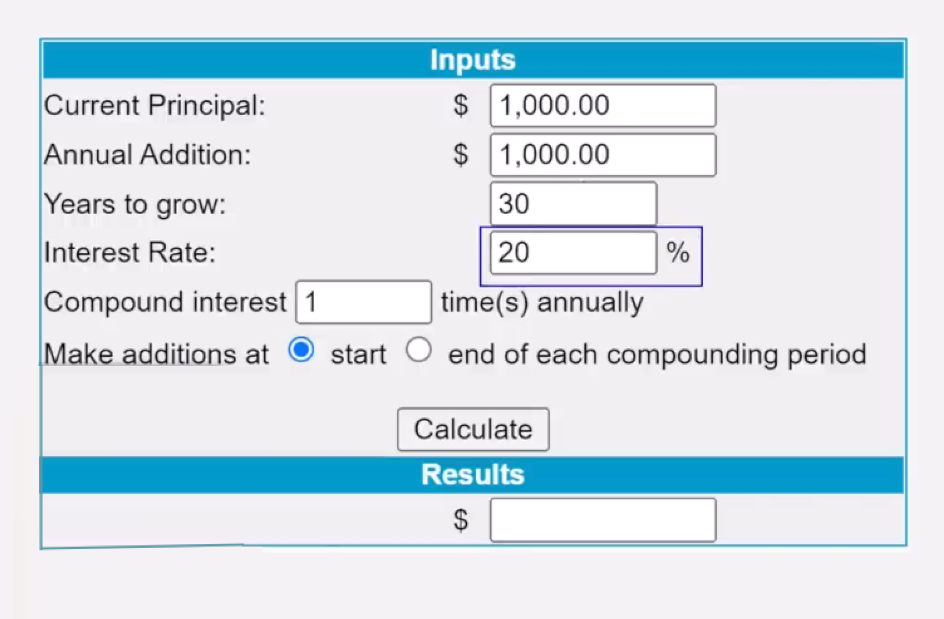
Then let’s say you compound it for the next 30 years, along the way, every year you add an extra $1,000 to your trading account as well.
Now, can you guess, after 30 years, how much your trading account will be worth?
Your account will be worth $1.6 million.
I kid you not this is a compound interest calculator, you can go back and plug in those numbers into your calculator and see it for yourself.
Here’s the thing, I only start with $1,000, In this example.
If you have more capital, you can put more money into your account each year, you can see that your earnings, the sky is your limit.
Here’s my question…
Do you want to blow up your account consistently over the next three years or want to safely grow your money consistently?
The choice is yours.
You must have an Edge
Let’s say you have a trading strategy that wins 50% of the time, half the time let’s say you have a $1,000 trading account and you risk 2% on each trade.
This means whenever you have a loss, you lose $20 and whenever you are right, you win $10.
Let me ask you this very important question.
If you were to trade this trading strategy, would you make money in the long run?
Yes, or No?
The answer is No
Why is that?
The reason is simple is because your losses, which is $20 are much larger than your winner.
On top of it, you only win 50% of the time, meaning you also lose 50% of the time.
Clearly, in this example, this particular strategy doesn’t give you an edge in the markets.
What if you are a disciplined trader?
Would that matter? No
Because you just end up as a disciplined loser.
Hopefully, by now you can see how important it is to have an edge.
Now some of you might be thinking
“Rayner, how do I find an edge in the market?”
In my opinion, the fastest way to do it is to stand on the shoulders of giants.
You don’t have to reinvent the wheel, simply study what works. These are several trading books that I would recommend you to go and read because they have come built with proven trading systems that work with back-tested results.
Trading Books with backtest results:
- Following the Trend: Andreas Clenow
- Trading Systems: Urban & Emilio
- Automated stock trading: Laurens Bensdorp
- Short-term trading strategies that work: Larry & Cesar
- Building Reliable Trading Systems: Keith Fitschen
Manage Your Risk
Imagine this:
John and Sally are two traders.
They both have $1,000 trading accounts and they have a 50% winning rate on their trading system, and they have an average of a 1:2 risk-reward ratio.
Let’s assume… Over the next few trades, this is the results of their trades…
Lose-Lose-Win-Win-Lose-Lose-Win-Win-Win
This is the outcome for the next few trades.
Let’s say John risked 50% of his account on each trade which is about $500 and Sally, risked $20 of her account per trade.
John: $500
Sally: $20
Let’s have a look at John first having $500
-500, -500, -1000
With an average 1:2 risk-to-reward ratio.
John has essentially blown out his trading account.
What about Sally?
–20, -20, +40
How much did Sally make?
It’s 40 because as you’ve seen over here, we have an average of 1:2 risk-to-reward ratio.
Her winners are twice the size of her loss.
In total, how much money did Sally make or lose?
Sally made a total of $120 which is about a 12% gain of her account.
What’s the point I’m trying to make?
The point is this, you can have a proven trading strategy that works, but without proper risk management, you will still lose.
Are you with me so far?
Consistent action gives you consistent results
I know this sounds a little bit vague so let me give you an example so you understand how this works…
Imagine your trades. The outcome of the next few trades is something like this:
Lose-Lose-Lose-Win-Win-Win-Win
Let’s say you’re trading with a proven trading system and you’re following your rules.
As you can see here. Your first three trades are losers.
When the fourth trade comes, you decide to skip it because of the recent losses that you had you think.
Guess what?
It turns out to be a winner over here.
Then your fifth trade comes along.
You decide to skip the trade because of the recent losses that you have encountered, the pain is still very wrong so let me skip the trade again.
Again, turns out to be a winner over here.
Then comes the next trading opportunity, and now you’re stuck. Thinking should I skip the trade?
Because the recent losses are still too much to bear, you decide to let your emotions take over and skip the trade.
Then guess what?
Another winning trade that you missed.
Then guess what? Another winning trade that you missed.
At this point, you can’t take it anymore.
You decided to follow your trading strategy because if not, you might miss out on further again.
We decided to take the next trade that came along and finally, you caught this winner over here.
However, if you look back your winner is not enough to cover your losses the three losses that you had earlier.
If you look at this from a big-picture standpoint, if you had followed your rules, you would have come up profitable because you had four winners over compared to your earlier losses that you had earlier.
Four winners against three losers, you would have made money over this series of trades.
But because you didn’t follow your rules, because of emotions your actions were not consistent, and that’s why you didn’t get consistent results.
You can see that if you want to be a consistently profitable trader, you must have a consistent set of actions whenever the setup presents itself.
You have to take it so you don’t second guess yourself:
Because guess what?
If you end up skipping trades, your results will not be consistent because your actions are not consistent.
Conclusion
My 13 years of trading journey has never been easy with lots of ups and downs at first before achieving true profitability.
That’s why I’m sharing these with you.
So that you can learn all these lessons even if you’re in your 1st year of trading:
- Trade in the path of least resistance by taking advantage of trends and avoid range and choppy markets
- If you can’t find “answers” on your timeframe, zoom out of your chart
- In an uptrend, wait for a buying setup as the price bounces from its are of support, vice versa for downtrends
- When there’s too much conflicting information, never hesitate to stay out
- No trading plan equals no consistency: have a solid trading plan in place!
- Have a simple checklist where you know why you would enter the trade and when to get out of the trade if you’re wrong
- The holy grail of trading is by trading two uncorrelated trading systems and by consistently adding funds to it
- Trading is not a get-rich-quick scheme, patience is crucial as you wait for your edge and compounding to play out
There you go!
Now…
I know each trader is different.
So, what else can you add into these lessons?
What are you currently struggling on now as a trader?
Let me know in the comments below!





Thanks you Rayner; as a new trader,what I struggle now is to find a trading system that makes me good money every year thanks I enjoy your post ..
Glad you liked it, Mark!
We wish you all the best.
Cheers!
That’s great
Thanks!
Good trading advice, thanks Rayner. I am currently struggling with how to identify supply and demand zones and the best timeframe to look for them.Can you post a lesson on supply and demand zones please?
Hi, Olubode!
You might find the article below informative:
https://www.tradingwithrayner.com/supply-and-demand-zones/
Hope that helps!
Thanks Reynar, as a new trader in my 7th month of trading my major struggles are with FOMO and I find it very difficult to stick to my plans , I have finally settled the aspect of risk management but I am always at break even not profitable yet
I know you’ll get there, Joseph.
Wishing you good luck and good trades!
Thank you Rayner, currently am having issues with chart patterns.
Most welcome, Ezekiel!
You might find the link below helpful:
https://www.tradingwithrayner.com/chart-patterns/
Cheers!