You’re probably wondering:
“Does Forex technical analysis really work?”
Well, yes and no.
I’ll explain…
No, Technical Analysis does not work, here’s why…
Now, if you think that Technical Analysis is a “crystal ball” that tells you what’s going to happen on every forex chart analysis — you’ll be disappointed.
And if anyone claims to do so, you’d better hide your wallets and RUN away.
You’re probably thinking…
“So what’s the use of Technical Analysis?”
I’ll be honest.
Relying on Technical Analysis alone is useless.
Because without proper risk management, no amount of Technical Analysis can save you from blowing up your trading account — not even the best trading strategy in the world.
However…
When combined with proper risk management and a sound trading approach, Technical Analysis can work.
Just look at the performance of Dunn Capital, a Trend-Following hedge fund that relies on Technical Analysis to make its buy and sell decisions.
Does it make sense?
Good.
Because in the next section, you’ll learn 7 Forex Technical Analysis strategies and techniques — that work.
So read on…
Forex Technical Analysis #1: Weekly high and low
You might be wondering:
“What are weekly highs and lows?”
Weekly high — this refers to the highest price point that occurred for the week.
Weekly low — this refers to the lowest price point that occurred for the week.
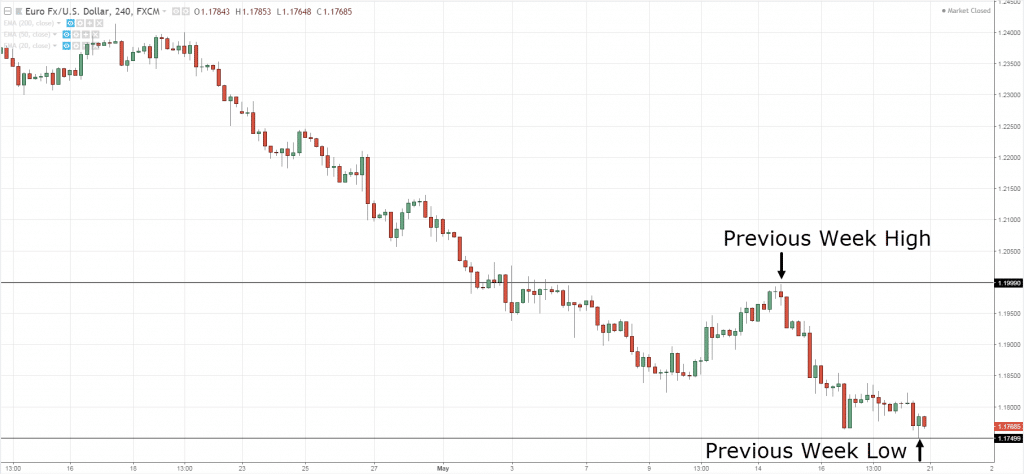
This is useful because you can use the previous week high and low to identify an area of value you can trade from.
Here’s an example: Previous week high and low on EUR/USD
This means if you have a bearish bias, then you can look for short setups near the previous week high (and vice versa).
Pro Tip:
If you’re a day trader, you can pay attention to the previous day high and low when making forex chart analysis.
And if you’re a long-term trader, you can pay attention to the previous month high and low.
Forex Technical Analysis #2: The London Open
If you’re a Forex day trader, then you must pay attention to the London Open on top of your forex market analysis.
But first, what is the London Open?
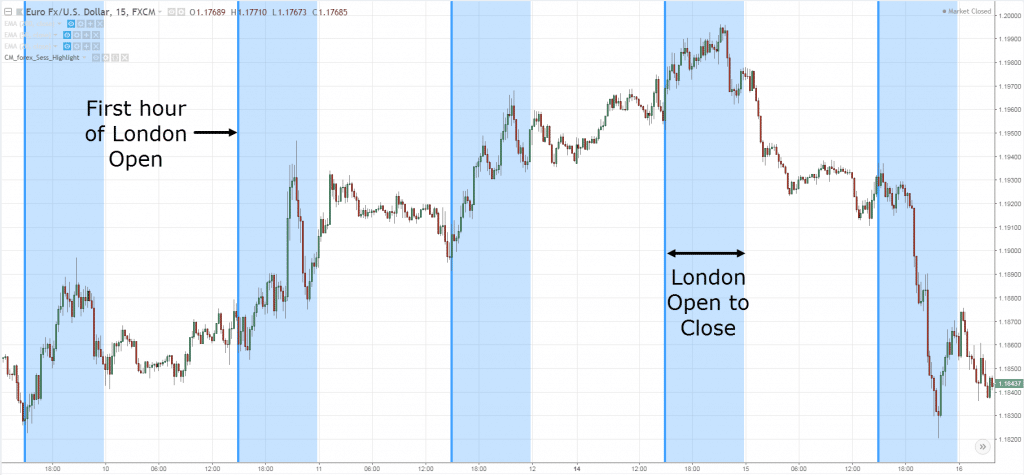
The London Open refers to the first hour in which the UK starts its trading session.
This is important because the first two hours of London Open is when the market moves and volatility picks up.
Just look at the chart below: Volatility increases after London Open
So, how can you take advantage of this phenomenon?
Well, you can trade breakouts to capture the burst of momentum.
Or, you can trade the trend and capture the intraday volatility.
Either way, consider trading the London Open because it offers the biggest bang for your buck.
Lastly…
You can use a Forex session indicator to help you identify the London Open.
If you want to learn how to do it, then go watch this training video below…
Forex Technical Analysis #3: This is one of the best times to enter a trade…
Let me ask you…
Do you want to enter your trades after the market has made a huge move and has “exhausted” itself?
Or would you rather enter your trades BEFORE the market makes a huge move and has the potential to further “explode” in your favor?
I’m sure you’d go with the latter, right?
But the question is… how?
Well, the secret is this…
Look to trade near the open.
Why?
Because the open is where the market has the “maximum fuel” for the day/week/month.
But don’t take my word for it.
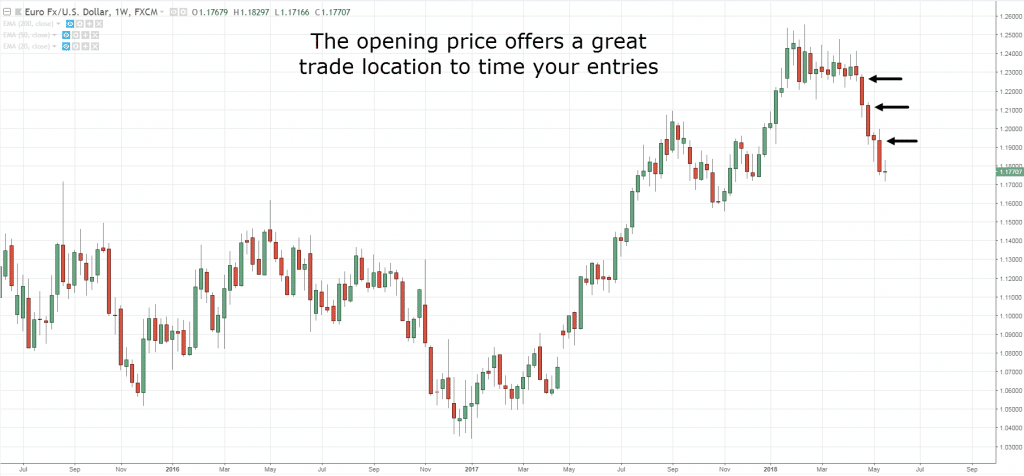
Just look through your charts and identify any large-bodied candles.
You’ll notice the opening price is one of the best places to enter a trade.
Here’s a forex market analysis example:
Now you’re probably wondering:
“So how can I apply this concept to my trading?”
Easy.
If you’re a day trader, look to enter near the open of the day.
If you’re a swing or position trader, look to enter near the open of the week.
Because you know if the market moves in your favor, you’re already in position to take profit from it.
Forex Technical Analysis #4: The Magic of Moving Average
The Moving Average is a powerful Forex Technical Analysis indicator that can improve your trading results.
Because it can help you:
- Define the trend
- Ride massive trends
- Better time your entries
I’ll explain…
1. How to use Moving Average (MA) to define the trend
If you’re always confused whether you should be long or short when making technical analysis in forex, then fear no more.
Because you can use the Moving Average to identify the direction of the trend.
Here’s how…
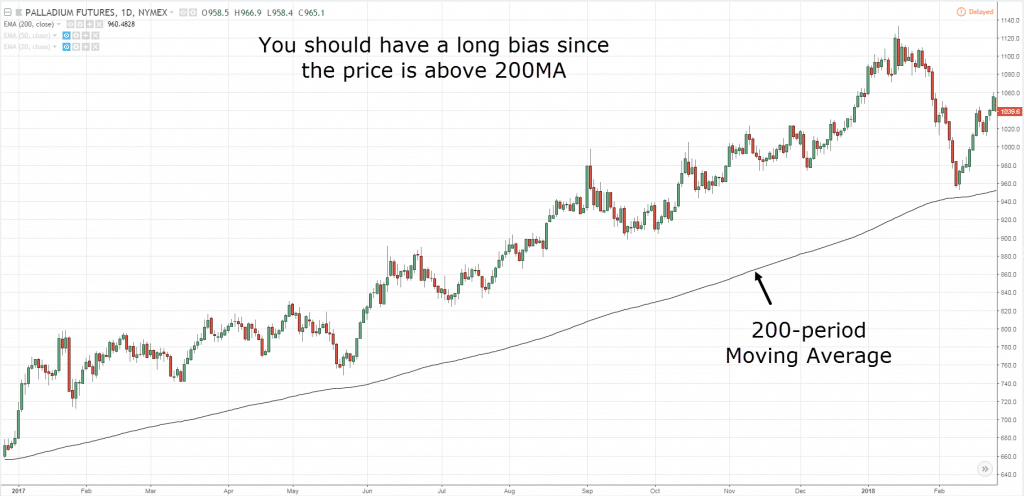
- If the price is above the 200-period moving average, have a long bias
- If the price is below the 200-period moving average, have a short bias
Here’s what I mean:
Clearly, if you trade with the 200MA, you’ll be on the right side of the trend more often than not.
2. How to “catch” massive trends in the markets with Moving Average
Let me ask you:
Do you want to ride BIG trends in the market?
You know… the trends that offer you a 1 to 10 risk to reward on your trades — or more.
Well, the good news is…
…it’s not as difficult as you think.
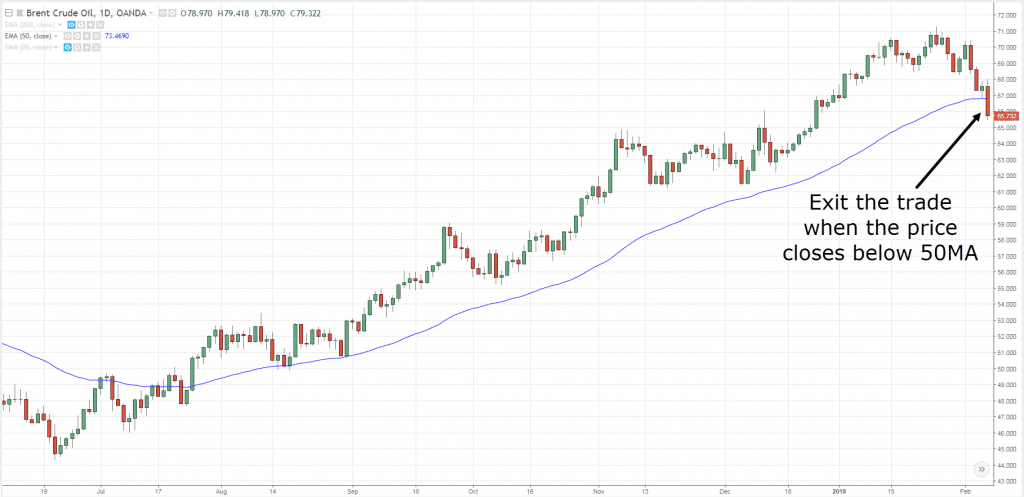
Because all you need is to use the Moving Average to trail your stop loss.
This means you only exit the trade if the market closes beyond the Moving Average.
Here’s an example: Trailing stop loss with a 50-period Moving Average
Pro Tip:
To ride a bigger trend, you can use a longer-term Moving Average (like 200MA).
Of if you want to ride a smaller trend, you can use a shorter-term Moving Average (like 20MA).
3. How to use the Moving Average indicator to better time your entries
Here’s the deal:
Most of you know how to trade when the market is ranging (just buy Support and sell Resistance).
But, when the market is trending — you’re stuck.
You wait for the price to re-test Support but, the market refuses to retrace.
So you watch the market trade higher while you’re on the sidelines.
Sounds familiar?
But hey.
It need not be the case anymore.
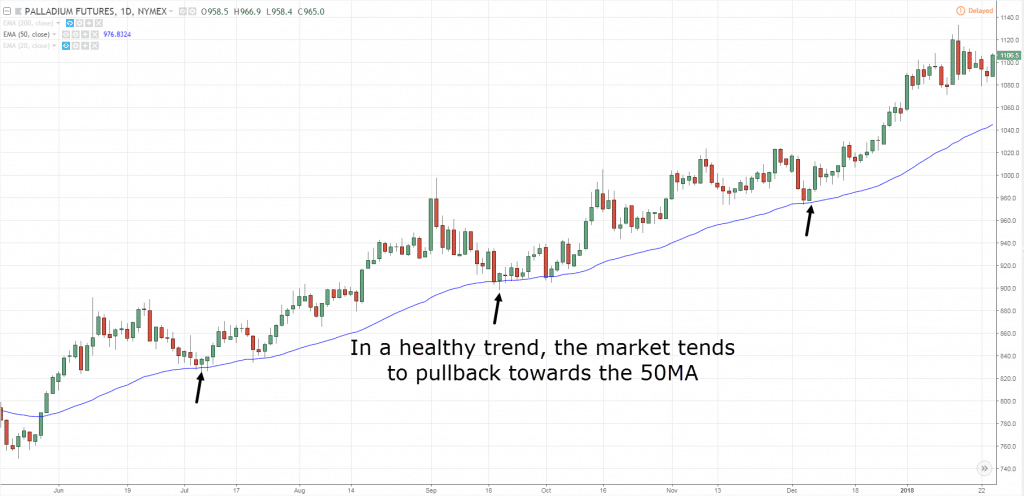
Because you can use the Moving Average indicator to help you time your entries in a trending market.
For example: In a healthy trend, you can look for a pullback towards the 50-period moving average
Pro Tip:
If the trend is strong, you can look for a pullback towards the 20MA.
If the trend is weak, you can look for a pullback towards the 200MA.
Forex Technical Analysis #5: How to buy low and sell high with Support & Resistance
I’m sure you’ve probably heard the saying…
“Buy low and sell high.”
But the question is… how?
Well, one way to go about it is to use Support and Resistance on your technical analysis in forex.
I’ll explain…
Support – Area on your chart where potential buying pressure could push the price higher
Resistance – Area on you chart where potential selling pressure could push the price lower
Now, let’s take things a step further.
Because you don’t want to blindly buy Support or sell Resistance.
Instead, you want to do it when the market conditions are favorable so you can increase your winning rate.
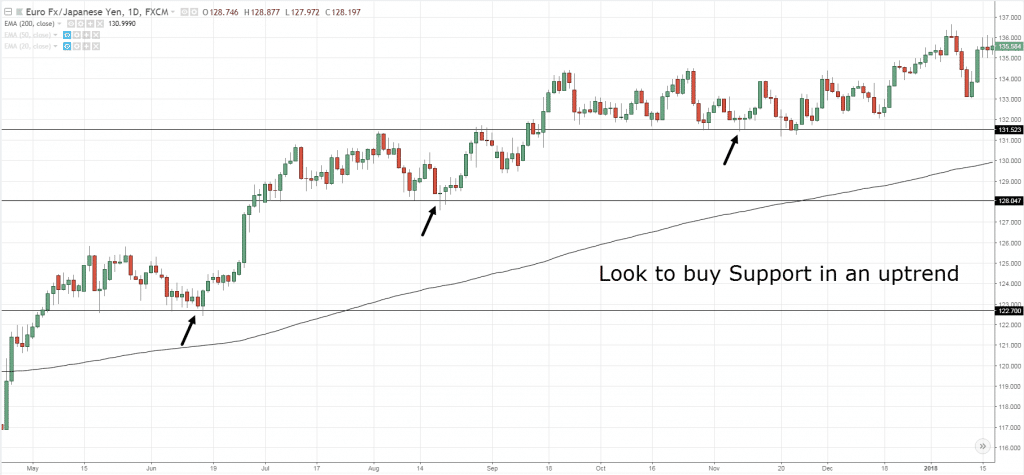
So, let’s use the 200MA as a simple trend filter.
- If the market is in a downtrend (below 200MA), then look to sell Resistance
- If the market is in an uptrend (above 200MA), then look to buy Support
Here’s an example:
And that’s it!
You’ve learned the secret to buying low and selling high.
Not too difficult, eh?
Forex Technical Analysis #6: The Volatility Contraction pattern
Here’s the thing:
The market is always changing.
It moves from a period of low volatility to high volatility and vice versa.
Here’s what I mean:
Now, let me ask you…
Where would you prefer to enter your trades?
- Low volatility environment
- High volatility environment
- I don’t know
Well, I’d go with the low volatility environment because it allows you to have a tighter stop loss, thereby increasing your position size (without increasing your risk).
The best part?
If volatility expands in your favor, you’re already in the trade while other traders scramble to “chase” the market.
Heh.
Forex Technical Analysis #7: The First Pullback
You’re probably wondering:
“What’s the heck is The First Pullback?”
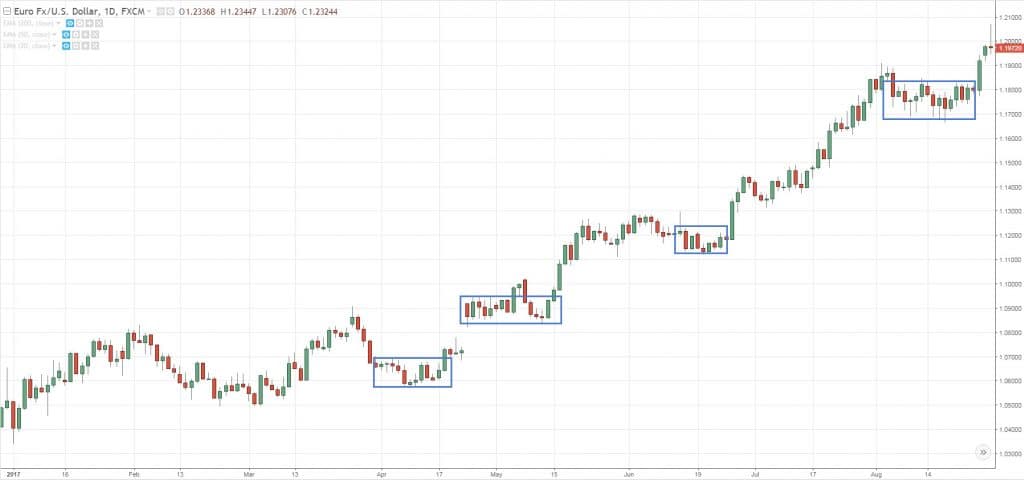
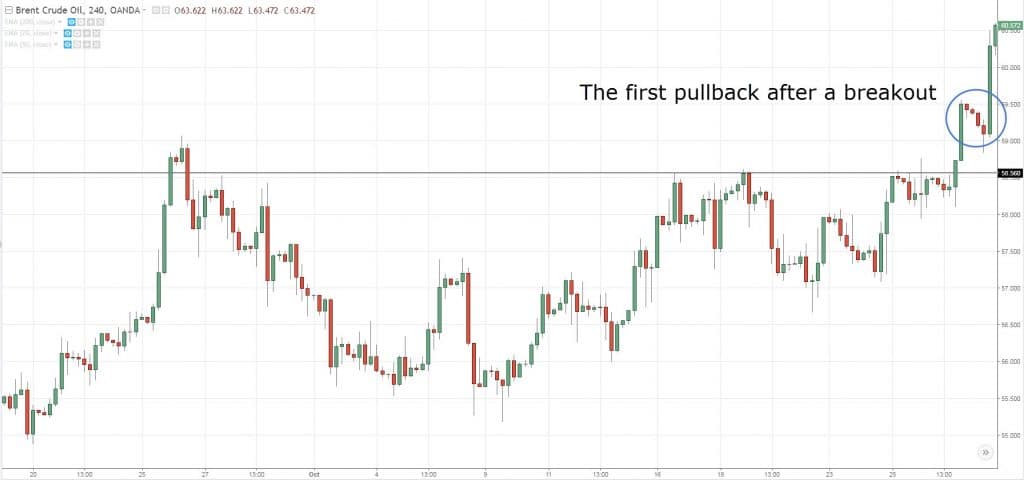
Well, it’s a term I coined when the market breaks out of a range and then does a pullback for the first time.
In my experience, the best time to trade the Bull Flag Pattern is when it occurs just after a breakout.
Why?
Because when the market is in a range, it must break out eventually.
And the longer it range, the harder it breaks.
So… when the market finally breaks out, traders who miss the move can’t wait to enter on the first sign of a pullback.
These pullbacks have shallow retracement and it offers a high probability trade.
Here’s what I mean:
Now you’re wondering:
“How do I find such high probability pullback trades?”
Well, you can just follow this 4-step process:
- Identify a range market
- Let the market breakout
- Wait for a Bull Flag Pattern to form
- Go long on the break of the highs
Simple, right?
So, which is the best Forex Technical Analysis?
Now:
There’s no best Forex Technical Analysis out there. Likewise, there is no best indicator, strategy, or whatsoever.
It all boils down to YOU, your goals, and what you want from trading.
Once you nailed that down, then you can find an approach that suits you BEST.
For example:
To be a successful trend trader, it makes sense to learn how to utilize Moving Average in your trading because it can help you define the trend and better time your entries.
Or if you want to be a breakout trader, then learn how to identify volatility contraction pattern so you can anticipate big moves in the market before it occurs.
Does it make sense?
Great!
Frequently asked questions
#1: Hey Rayner, what’s the best way to use moving averages in my trading?
You can use moving averages to:
- Define the trend
- Identify an area of value
- Trail your stop loss
If you want to learn more, then check out this article here.
#2: Where do we get the Forex Session Indicator from?
If you’re using Trading View, the indicator is called “Forex Sessions” by Chris Moody.
Conclusion
As a recap, here are 7 Forex Technical Analysis techniques you’ve learned:
- Weekly highs and lows are a potential area of value to trade from
- London Open presents some of the best trading opportunities for Forex day trader
- The open of the day/week/month is when the market has the most “fuel” to move
- The Moving Average indicator can help you define the trend, ride massive trends, and better time your entries
- You can use Support and Resistance to buy low and sell high
- A low volatility environment offers favorable risk to reward on your trades
- The first pullback is a trading setup that lets you “catch” the trend
Now here’s a question for you…
How do you apply Forex Technical Analysis?
Leave a comment below and share your thoughts with me.


Great stuff, as usual 😉
Thanks Rayner for inspiring traders (and keep them off self-destuction !!!)
Thank you, Tonio!
I m ur big fan Rayner… great stuff
Cheers Zeen
Thanks for being such a good lecturer from tradingwithrayner university, my trading is getting better day by day. Keep it up, there are no words to thank you, you are incredible!
I appreciate it, Richard.
You write well, Rayner, and your teaching is precise and educational. Very helpful! Thanks!
I’m glad to be of help, cheers.
HI Rayner!
How you doing!
This is the the simplest and straight forward explanation ever.
Would you please tell us how is the best and also simplest way to use moving averages that you used above on multi frameworks?
Thanks in advance for your help
Hey Saleh
I have a post on moving average here… https://www.tradingwithrayner.com/moving-average-indicator-trading-strategy/
And multiple timeframes here… https://www.tradingwithrayner.com/trading-multiple-timeframes/
Still new to forex but enjoying your teachings on forex. Hope to succeed in it applying what I have learnt so far. Keep it up.
Cheers
thanks a lot rayner………… you are the best.
I appreciate it bud.
Hi, what is for you the start of the day? because forex runs 24/24..do you mean the start of the day bar?
Thanks
New York close is the end of my session and the Asian is the start of mine.
Thanks man ,I am really enjoying your videos
I’m happy to hear that.
Hi Rayner! Thanks so much so all the training sessions you’ve taken us through through this email.
I didn’t get this part. We’re you trying to say “CAN WAIT “?
“So… when the market finally breaks out, traders who miss the move CAN’T WAIT to enter on the first sign of a pullback.”
This means traders who missed the breakout are waiting to trade the pullback when it comes.
#7 is amazing, “the first pullback”. Thank you so much Rayner
You’re welcome!
Thanks Rayner, As usual, very clear and helpful. However, I did not get how to obtain the Foreign Sessions Indicator. You say “you go to…” without mentioning from which website. Or is it from your trading platform? In which case from which link? Would appreciate a clarification.
Thanks and best regards,
Hey Max
You can get it on TradingView.
Thanks Rayner, your tips are really helpful.
You’re welcome!
Thank Rayner, your lessons are eye opener. In using moving average in determining trend and entries, which type of moving average do you apply (simple or exponential)?
I use EMA.
I have read it, it’s educating
Awesome!
Great article Rayner, Very helpful. Thank you.
You’re welcome!
Nice !
Cheers
I’m so grateful.You’re really a good mentor.Thaks a lot
Cheers
Tnx a lot Rayner, wit ur ideas I have develop my trading strategy …tnx a lot once more and may god bless u.
My pleasure!
Hello I have read your technical analysis view.my query is how we get confirmation after the range break out , direction of market
Best friend of Retailers. You keep on inspiring. Learned a lot from your articles. Thanks… From India
My pleasure!
Well I’m trend trader and also a breakout but mostly I prefer trading trends thanks to you Mr Rayner I get to better time my entries and exits on both technical analysis
So thank you for your help
Awesome to hear that, Shaun!
Thanks your always there for us
Cheers
New perspective that I never heard from others guru….
Glad to help out!
Thanks for the clue Rayner …
I like all your post
Cheers
Thanks for the education and helping we retail traders.I really appreciate you kinds toward we amateur traders.
Cheers
Thank you rayner. This makes me confident to go with my trading despit my setbacks. Cheers! (with love from PH)
Cheers
How can I low the market is in low volatility or high volatility?
Hi, Atchaya!
You might wanna check the link below:
https://www.tradingwithrayner.com/course/17-volatility-contraction/
hope this helps!