So…
In my earlier posts, you’ve learned why trading indicators, fundamentals news, and signal services hurt your trading results.
Then, we discussed the power of price action trading and what it can do for you.
In case you missed it, here they are…
Why Most Retail Traders Fail and What You Can Do About it
Moving on…
One of the common problems almost all traders face is this…
“There are so many Forex pairs to trade. How do I pick the right one?”
Because you can have two identical trading setups but, one has a higher chance of winning while the other is likely to fail.
So how do you pick the right one to trade?
Well, that’s where a currency strength meter comes into play.
Having a currency strength strategy helps you to identify the strongest/weakest currencies so you can pick the right currency pair to trade (more on this later).
But first, I want you to avoid these common mistakes traders make when using the currency strength meter…
Do you make these mistakes when using a currency strength meter?
Mistake #1: You randomly use a currency strength meter without knowing how it works
Now, a currency strength meter is like any other trading indicator.
There’s a formula behind it to determine the strength/weakness of a currency.
But if you don’t know the formula behind it, how can you trust the result of the currency strength meter?
What if the formula is wrong?
What if the currency strength meter only works on the daily timeframe but you’re unaware of it and you use it on the lower timeframe?
That’s why no matter what tools or indicators you use, you must always know the formula behind it and how it works, even the forex currency strength meter.
(And later, I’ll teach you how to create your very own currency strength meter so you have the confidence to use it.)
Mistake #2: You use the currency strength meter to time your entries
Now, a mistake many traders make is to blindly trade based on the currency strength meter.
For example:
You identify what’s the strongest currency pair right now and immediately buy, thinking the price will move higher — big mistake.
Here’s why…
A currency strength meter isn’t meant to generate buy/sell signals.
It only tells you which are the strongest/weakest currencies at a point in time.
Let me explain how the forex currency strength works…
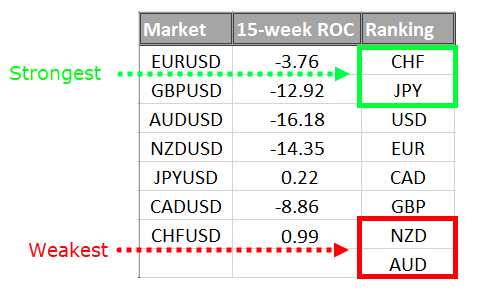
According to my currency strength meter right now, CHF is the strongest and AUD is the weakest…
(Don’t worry, I’ll show you how to create it later.)
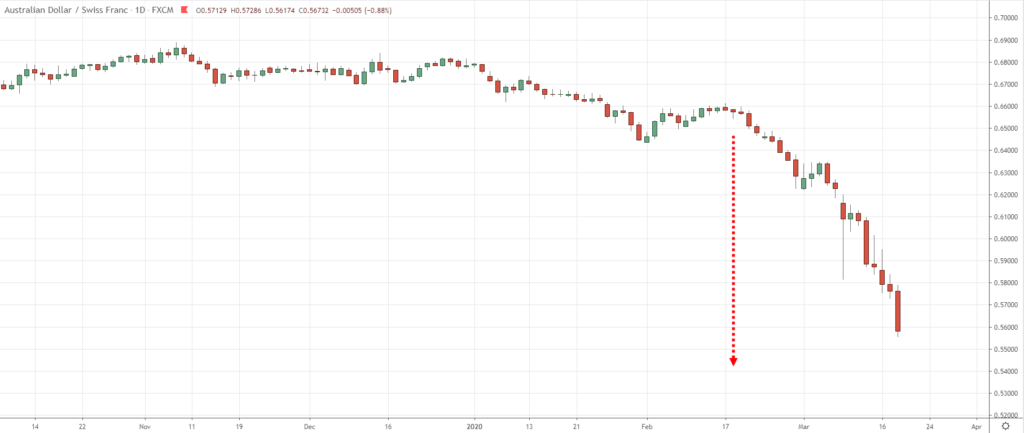
But if you look at the charts right now, it’s a bad time to short the AUD/CHF …
Why?
Because you’re chasing the markets lower after it has made a big move.
There’s no logical place to set your stop loss and you’ll likely get stopped out on the pullback.
Next…
Mistake #3: The lower timeframe is prone to false signals
Here’s the thing:
Most currency strength meters calculate the change in price (over a fixed period) to determine which currencies are strong or weak.
But this is prone to false signals on the lower timeframe.
Why?
Because high impact news can cause a “spike” in the price which misleads the strength/weakness of a currency pair.
That’s why you want to use a currency strength meter which calculates the change in price on the higher timeframe.
And here’s how you do it…
How to create a currency strength meter that works (and without coding)
All currency strength meters work in a similar manner.
The idea is to calculate the change in price over a given period and then determine which are the strongest/weakest currency pairs.
Of course, you can complicate things by adding formulas, weightages to different timeframes, etc. — and it’ll not make much of a difference (besides confusing yourself).
So, for this currency strength meter, there’s no complicated formulas or any complex algorithm.
Here’s how to make your own forex strength meter…
- Create a list of major currency pairs
- Calculate the percentage change over the last 15-weeks (for the major currency pairs)
- Rank them from strongest to weakest
Let me explain…
#1. Create a list of major currency pairs
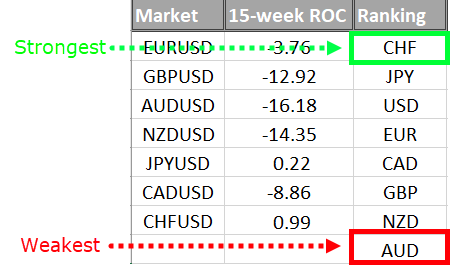
The list includes EUR/USD, GBP/USD, AUD/USD, NZD/USD, JPY/USD, CAD/USD, CHF/USD.
Now you’re probably wondering:
“Why do you use JPY/USD instead of USD/JPY?”
Simple.
You want to standardize USD as your quote currency so you can compare them “apple for apple”.
#2: Calculate the percentage change over the last 15-weeks
Here’s how…
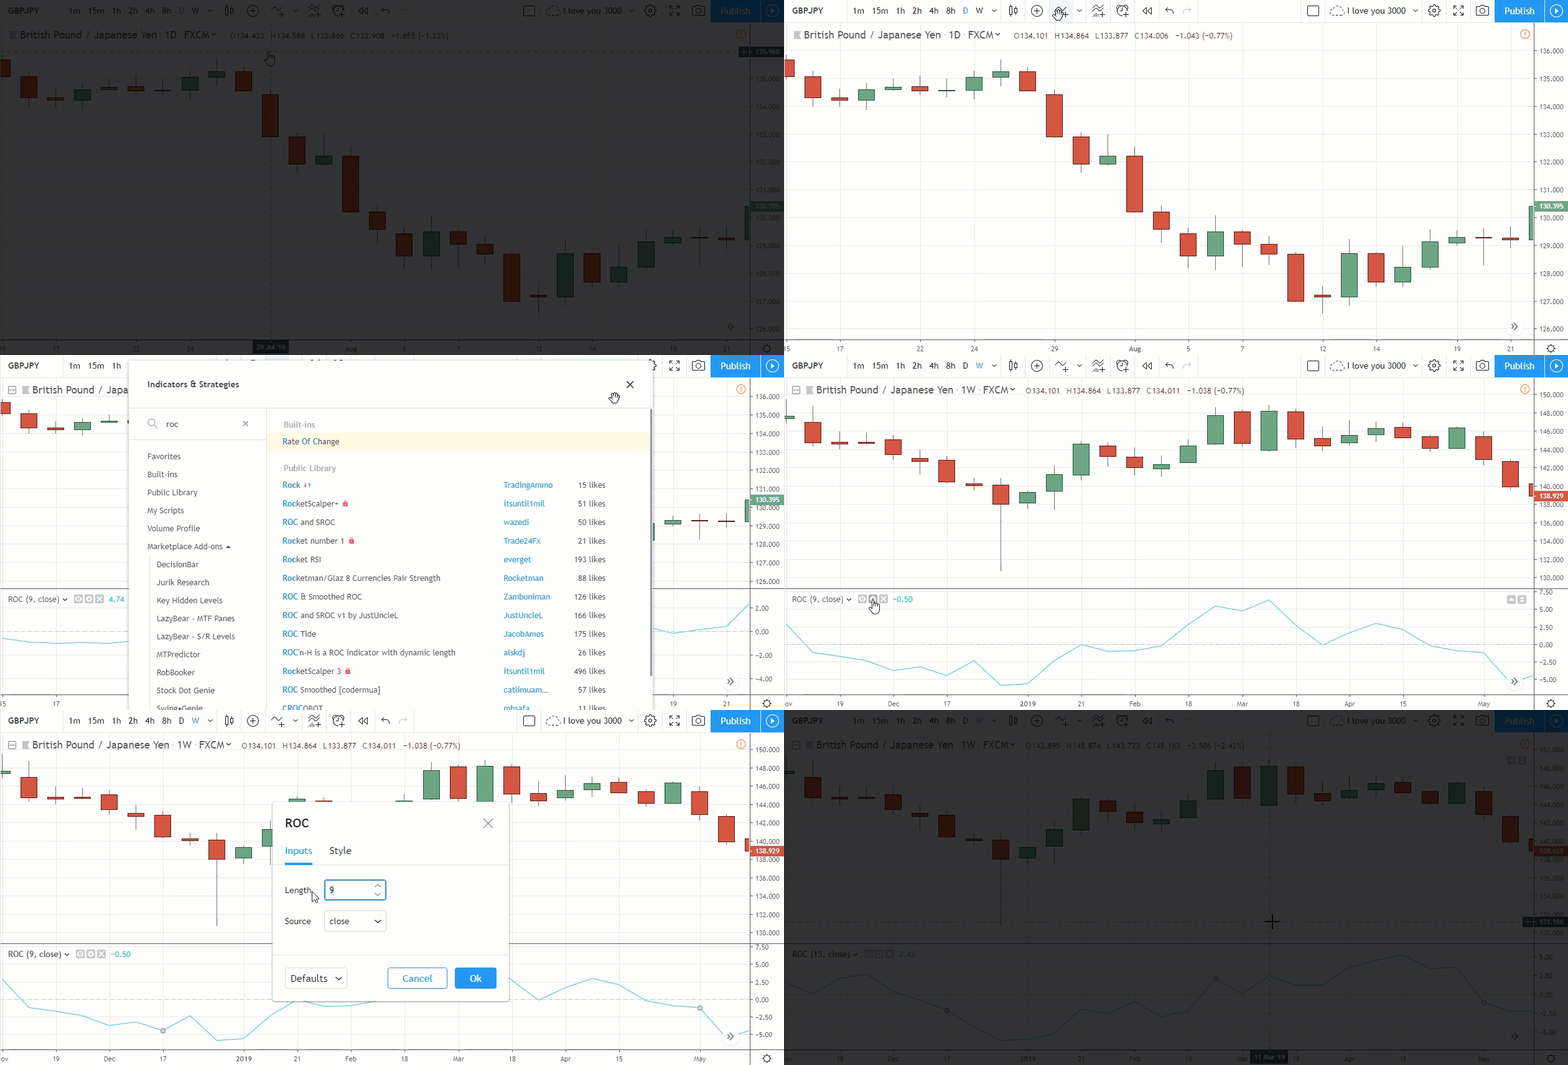
- Insert the Rate of Change (ROC) indicator onto the weekly timeframe
- Change the settings to 15-period
- Do it for all major currency pairs
Here’s how to do it on TradingView:
#3 Rank them from strongest to weakest
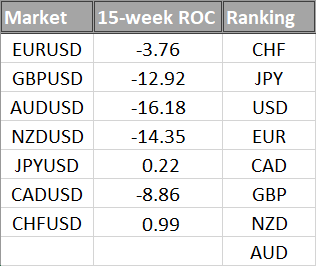
Now once you’ve got the values, you want to rank them from the strongest to the weakest.
The currency pair with the highest value would rank at the top, followed by the second, third, fourth, etc.
Here’s how it’ll look like on excel:
There you go!
Now, you have your own forex strength meter.
Pro Tip:
You can add exotic currency pairs like USD/ZAR, USD/TRY, USD/RUB, etc. so you have more markets to trade.
How to tweak the currency strength meter for your trading strategy
Now, by using the weekly prices to determine strength and weakness, you can avoid false signals from the lower timeframe.
But if you’re a short-term trader, using a weekly currency strength meter such as the 15-week ROC is too long.
So, what now?
That’s where you can tweak your currency strength meter for short-term trading.
So here are some guidelines for you:
- If you trade below the 4-hour timeframe, use 4-week ROC
- If you trade between the 4-hour and weekly timeframe, use 15-week ROC
- If you trade above the weekly timeframe, use 30-week ROC
Now at this point:
You know how your currency strength meter works (without any black box algorithm). And you know how to tweak it to your trading style.
So now the question is…
How do you use the currency strength meter for your trading?
Whether it’s a weekly currency strength meter or a daily currency strength meter?
Well, that’s what you’ll discover next, so read on…
How to use a currency strength meter and find high probability trading setups
Here’s how…
Use the currency strength meter and pair the strongest currency with the weakest one — so you get a strong trending market.
For example, look at the currency strength meter below:
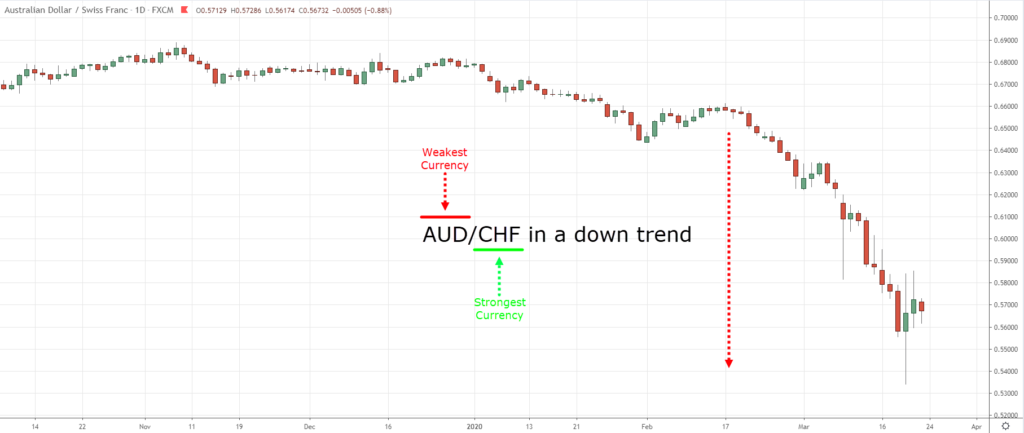
You can see AUD is the weakest and CHF is the strongest.
And when paired together, you get AUD/CHF which is in a strong downtrend…
But recall:
You don’t want to blindly short a market just because it’s in a strong downtrend. Why?
Because there’s no logical place to set your stop loss and you’ll likely get stopped out on a pullback.
So, what’s the solution?
Read on…
How to time your entry with precision so you can find low risk and high reward trading opportunities
You might spot a market that’s trending strongly but, it’s not the right time to enter yet.
So how do you know when is a good time to enter a trade?
Well, you want to trade from an area of value.
For example:
- A respected Moving Average
- Support & Resistance
- Trend Channels
- Trendlines
So, looking back at the AUD/CHF example earlier. Where’s the area of value?
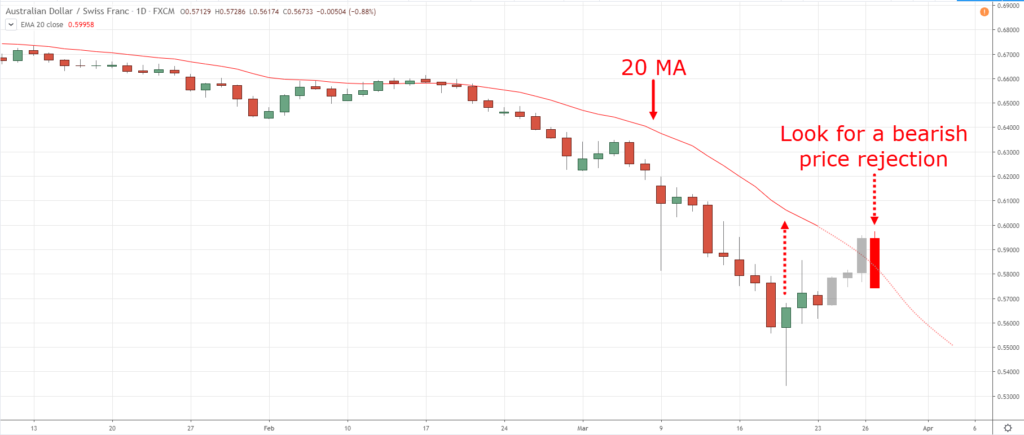
Well, the nearest one would be the 20-Day Moving Average.
This means you want to let the price retrace towards the 20-Day Moving Average first.
Then, you can look for an entry trigger like shooting star, bearish engulfing, to establish a short position.
Here’s what I mean:
Another example…
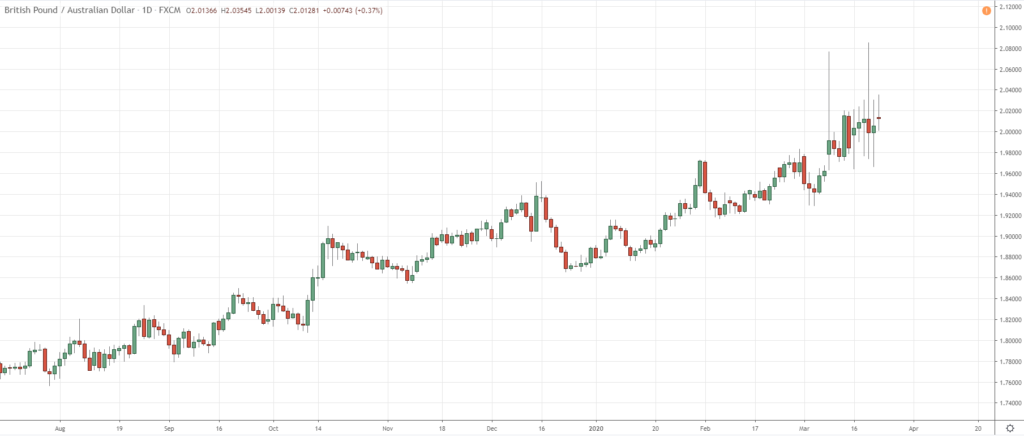
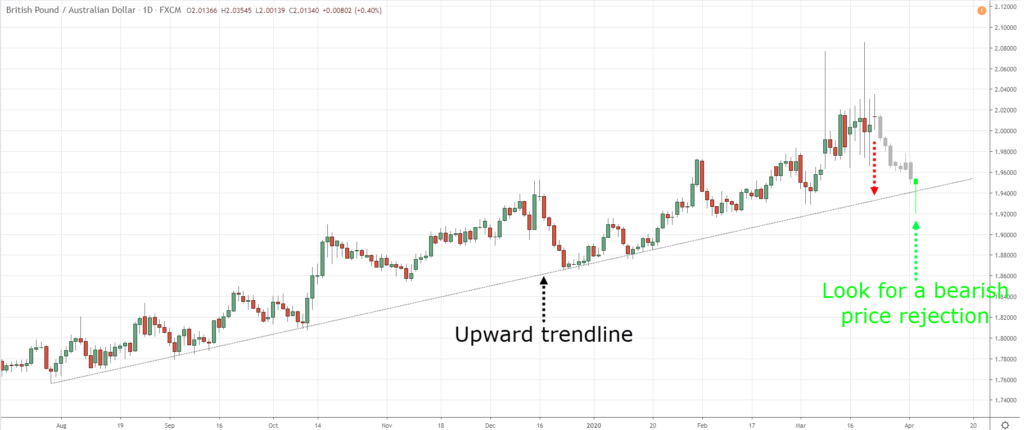
Let’s assume AUD is the weakest currency and GBP is the strongest.
And the chart looks like this:
So, where’s the area of value?
If you look carefully, you’ll be able to draw an upward Trendline connecting the lows.
This means you want to let the price retrace towards the upward Trendline first.
Then, look for an entry trigger to long this market (like a hammer, bullish engulfing, etc.).
Here’s what I mean…
Does it make sense?
At this point…
You’ve learned how a currency strength meter helps identify the strongest & weakest currencies so you can identify high probability trading setups.
Then, we discussed how to better time your entry using an area of value — so you can minimize your risk and maximize your profits.
Of course, there’s much more you can do if you want to improve your price action trading skill… far more than I can fit into one blog post.
That’s why I’m opening up the doors to my premium training program, The Ultimate Price Action Trader (UPAT).
It opens on April 7th, Tuesday, and it’s perfect for you if you want to learn how to become a consistently profitable trader, without relying on fancy indicators, fundamental news, or black-box algorithms.
So if you want to join The UPAT, then keep a lookout for my next email.
For now, here’s what I’d like to know…
Do you see the markets differently with price action?
Leave a comment below and let me know your thoughts…


Great lesson. Rare mind sharing great tip freely.
You’re most welcome, Michael!
Dear…I trade Indian equity markets and index…not forex….also no time to stick to screen all time as full time job….what is your suggestion regarding UPAT…will it useful…
REGARDS
I’ll share more details in my next email so you can better decide for yourself. cheers.
Thank you Rayner for the guidance. Truly appreciate it
You’re most welcome, Zal!
Rayner, can I get the ROC indicator on my mobile phone MT4 setup?
Perfect
Thank you so much for this great insight and deep knowledge.
Although I am still a demo trader but I have learnt reasons behind blowing my account following your teachings
I will plan to follow you in your next teaching.
Tanks again.
My pleasure!
Yes…it is an eye opener.
Price action trading is completely different way of looking at the market. Very professional approach in trading.
Thanksyou
Cheers bud
What about us trading the 15m and 1hr time frame, how many week ROC are we suppose to use?
UPAT details pls
Coming up soon!
The market is always seen differently using just Price action. I believe price action is the ideal way of taking profitable trades at all times. Thanks to you. I’ve been trading using naked chart, only relying on price action and I’ve increased my ROI tremendously.
Awesome to hear that, Daniels!
Yes Sir, when I look at the charts I see a lot of combinations from your teachings which definitely allows me to see the market tricks.
I salute you for the free education still have a lot to learn from you
Thank you
You’re most welcome, Siya!
Who’s the best FX trader online? Y’all know, it is Rayner Teo.
I appreciate your kind words, Sly!
Me as a beginner,am learning a lot .But what am asking,how can I get the strength of a pair?And how does rate of change indicator work?
yes I do
Hi Rayner
Thank you very much for your lessons I can see Trading differently now by learning price action trading. I have lost money on relying on indicators, fundamental news and signals. I will now concentrate on price action trading because I have seen that it works better.
Awesome!
how do you know that USD is on the 4th spot after EUR? There are only 7 major pairs. Is USD fixed at that ranking?
Yes, I’d like to know that, too!
Until I do, have no idea where to place USD.
Hey Fernando. Here’s the answer to our question.
USD is always set at 0 (zero) as it is the base currency.
It’s permanently set to 0. You need to base the currency against something, and in this case, is USD.
Thanks for this, Rayner!
Also how does the recent and continuing madness affect this? Is the 15 period still valid for the daily timeframe, as the last couple of weeks have shown large volatility?
You are a great teacher!!
I am gradually getting to understand the rudiments of trading that my paid teachers never taught me!
Thank you Rayner!!!
You’re most welcome, Rose!
Thanks a million Rayner. I have learnt a lot from continuously following your blog post and applying the lessons to my trading. I see the market simplified and my results has been wonderful.
Great work, Nwosu!
Thanks Rayner, looking forward to your training.
Coming up!
Hi Rayner
Thank you very much for your free lessons I see Trading differently now by learning more about price action trading. I have lost money on relying on indicators, fundamental news and signals. Any suggestions on currency pairs or commodities that I can trade with a small account (300USD)
Thank you for explaining this so clearly, Rayner. Could you please tell me why USD appears in the middle of the ranking after the currency pairs’ ROC values have been ranked strongest to weakest?
I ranked them according to their values. 0 is in the middle of positive and negative value.
Do you have a single course/single subscription that explains all of your tips/ lessons in ONE course rather than reading lots of emails/ watching many you tube videos?
I don’t have a single course that teaches everything because that will be too overwhelming.
But I do have courses that focus on specific methodologies, like price action, systems trading, etc.
Hi rayner. How do I get access to those courses on price action and systems trading.
Hi!
Kindly email us at support@tradingwithrayner.com
Thanks!
Thank you Rayner for this insight into an indicator new to me. My mt4 does not have ROC. May I know how do I download and setup ROC into my mt4?
Use tradingview, it’s easier.
Hi Rayner!
I tried to understand how you rank those pairs from strongest to the weakest, but I could not understand the concept….what I saw is just a random arrangement of ROC, how could -3.16 be higher than -0.22??
Please help.
I trade in Bank Nifty in the Indian Equity Market, can you help me with this?
Thanks for such a wonderful info
My pleasure!
Thanks……I’m improving on Price Action.
Nice!
Damn mr Rayner u like my mentor been watching your learning on the sideline &they made me just cant wait for ALTIMATE GUIDELINE BOOK
Hello Rayner, the table used for USD in the example above. How did you arrive at USD being the fourth strongest Currency since it is standardized as the quote currency.
Anything above 0 goes above it, anything below 0 goes below it.
If all is below 0, it means USD is the strongest.
Hi Rayner
For pairs like usdcad usdchf and usdjpy how you use the roc? You put the same exact value you see on indicator?
If you use currency inverse like cadusd chfusd and jpyusd, is roc value the same when you put it in sheet?
For example, usdchf is 3.0451, but is the same value if you use chfusd?
boss, am grateful for this lesson
Thanks, Godwin!
The best, superb for me.
Thanks, Nicholas!