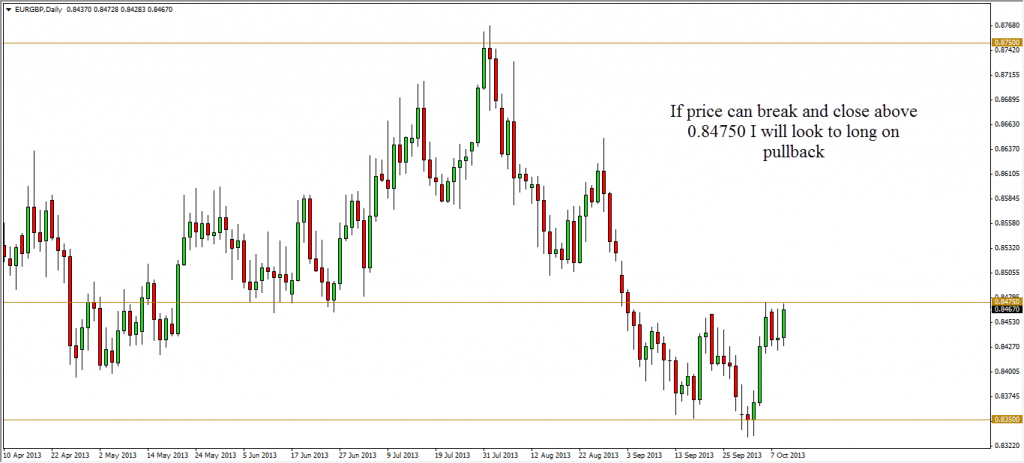
Yeah the Gbp! We have a bullish engulfing pattern on the weekly charts. However looking at the daily, we see resistance coming in at 0.8475. Thus if price can break and close above that level, i will look to long on pullback.
The Gbp Chart:
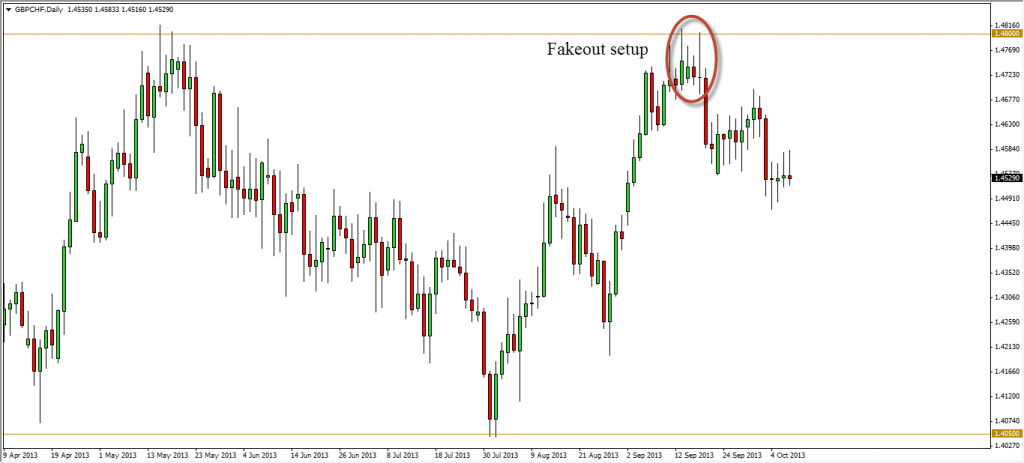
A typical fakeout setup. Notice how price tested the 1.4800 and was rejected. Then it consolidated for 2 candles before retesting it a final time (formation of pinbar). That would have been a signal to get short with stops above 1.4800. Sadly i missed that move.
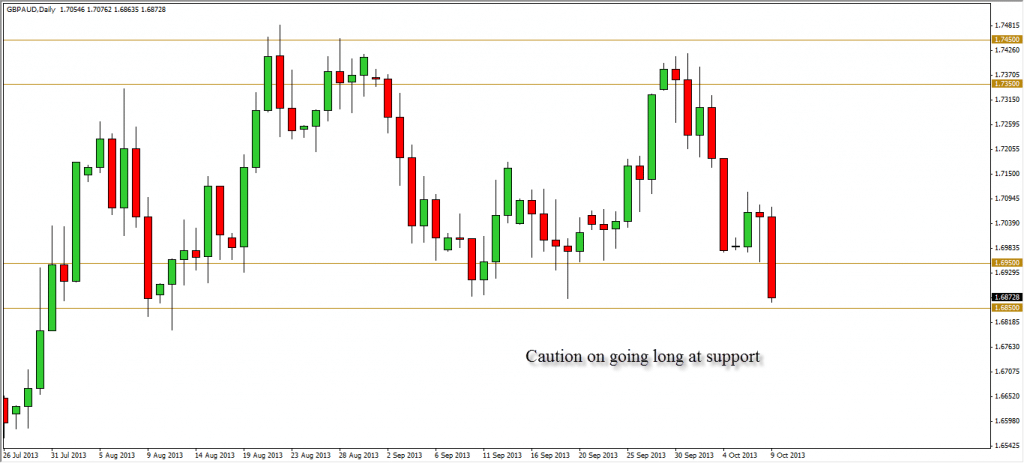
For those bulls who are about to long Gbpaud at support, i would caution you first. Reason being is that level has been tested 3 times and it’s attempting the forth. Whatever order flow which has been there earlier is probably reduced greatly. Also notice the bearish momentum heading downwards? I would rather wait for a bullish price action instead of going in too aggressively here.


Rayner,
Thank you for your charts. They are indeed well explained, and easy to understand.
Yours sincerely
Subashchandra