In this video…
You will learn to discover how to use the moving average to better time your entries and exits, and even “predict” market turning points.
You’ll even learn a useful moving average strategy to profit in bull and bear markets.
Video Transcription
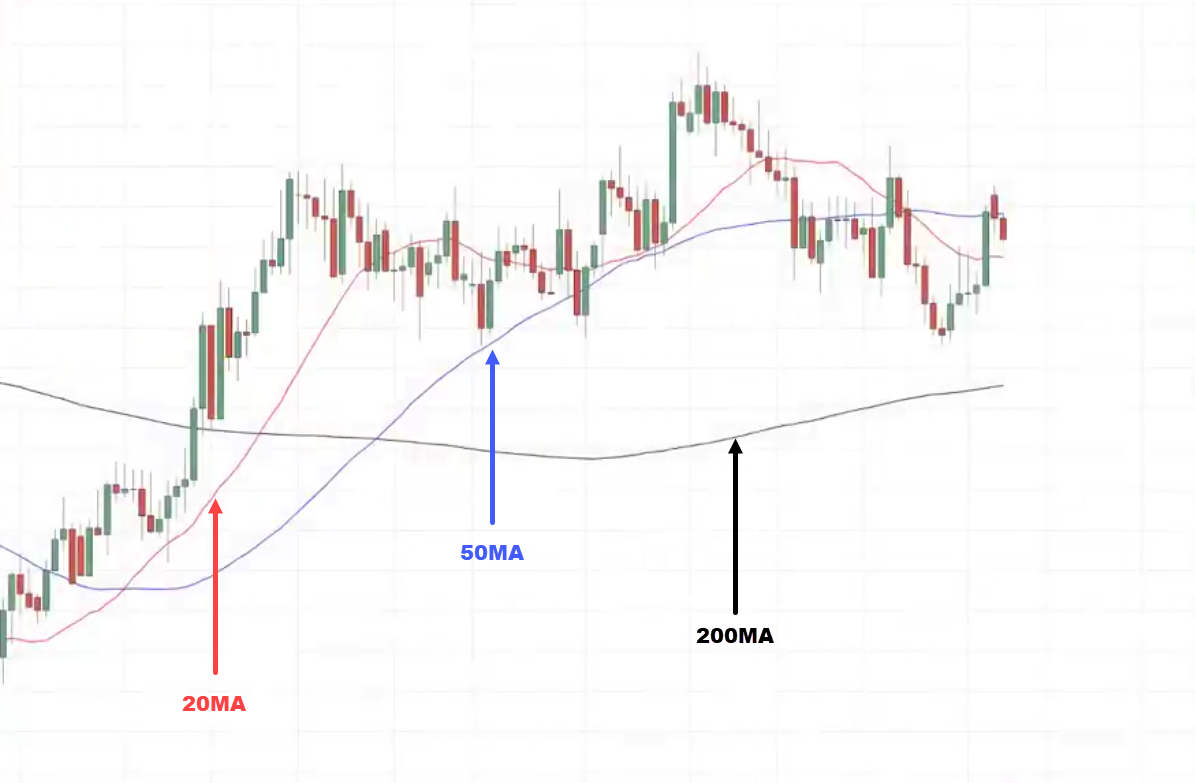
Have a look at this chart over here, I’ll walk you through it quickly:
This red line over here is the 20-period moving average, the blue line is the 50-period moving average, and the black is the 200-period moving average.
Now let me ask you…
Which moving average should you use?
The answer is, that you should be using none of it.
Clearly, in this example, the market isn’t respecting the moving average at all so don’t use it.
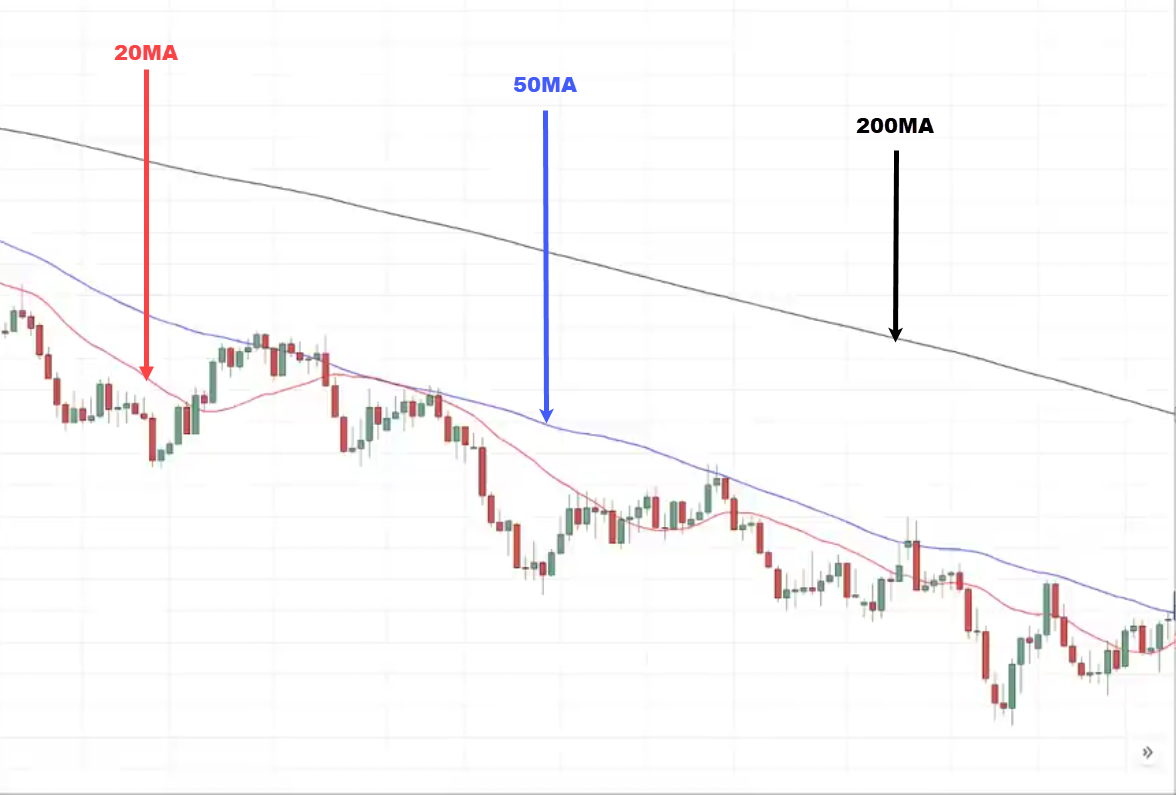
Now, what about this chart over here:
Which moving average should you be using in this instance?
Would it be the red, blue, or black moving average?
The answer is this you should be using the blue moving average.
I’ll explain shortly in today’s training.
But if you’re one of those traders always wonder…
“Rayner, sometimes I use the moving average it works, and sometimes it doesn’t”
If you always feel conflicted with the moving average, then today’s training will help you master the moving average.
Towards the end of this training, I’ll even share with you a moving average trading strategy that you can use to profit in bull and bear markets.
This strategy works for the forex, crypto, and stock markets.
Let’s get started.
What Is a Moving Average and How Does it Work?
The moving average is an indicator that calculates the average price over a fixed period.
If you have a 10-period moving average, on your chart, it simply calculates the average price over the last 10 candles.
If you’re on a daily timeframe, it calculates the average price over the last 10 days.
If you are using a 50-day moving average, it calculates the average price over the last 50 days.
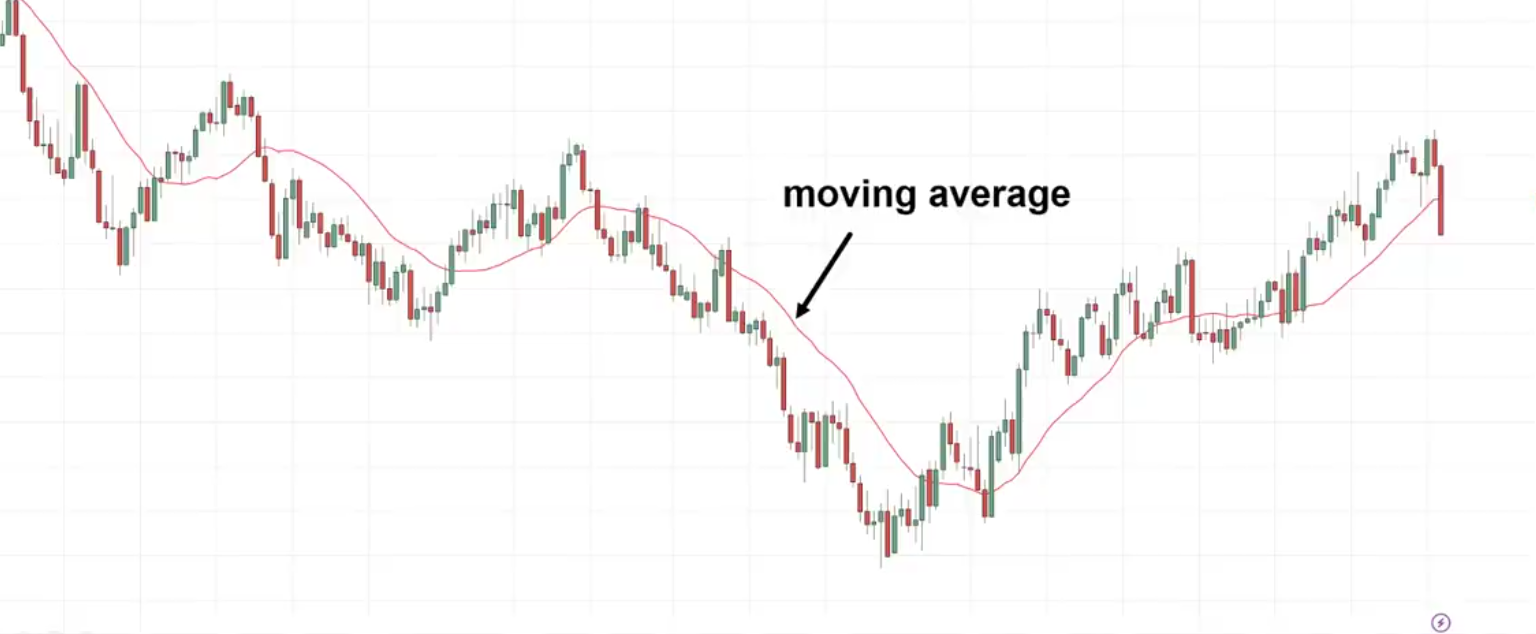
Example:
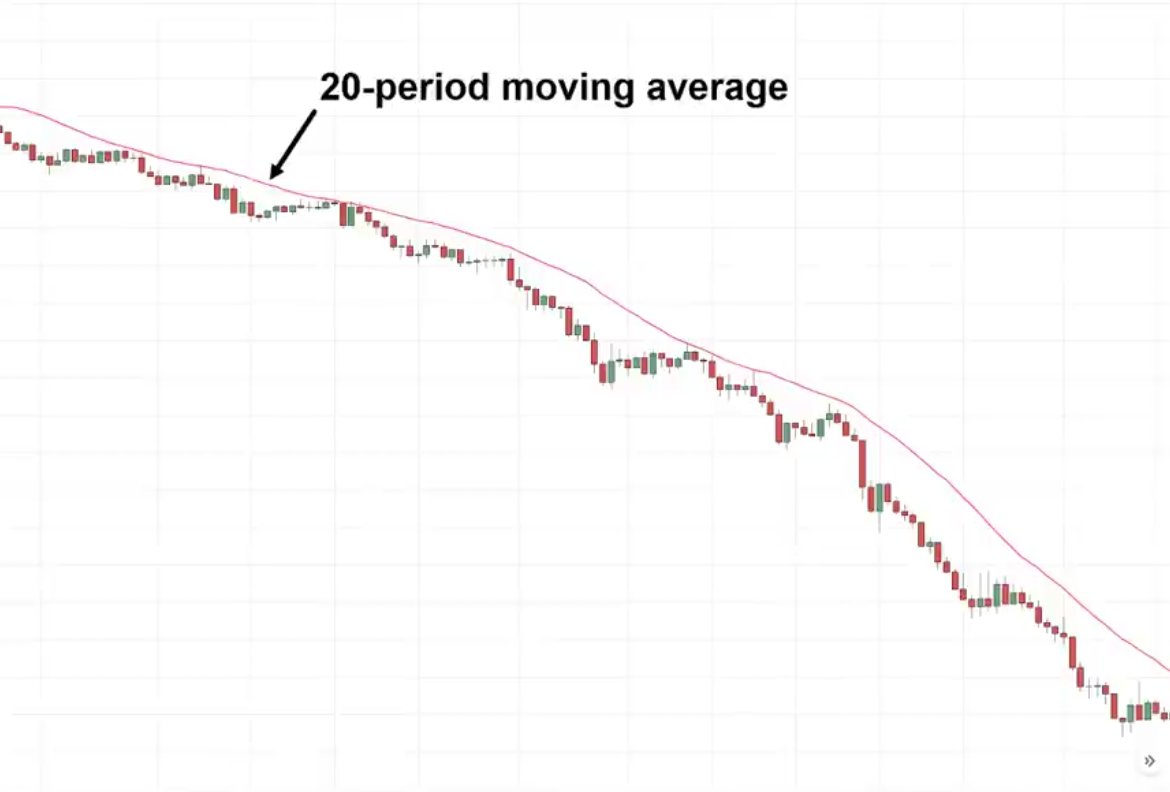
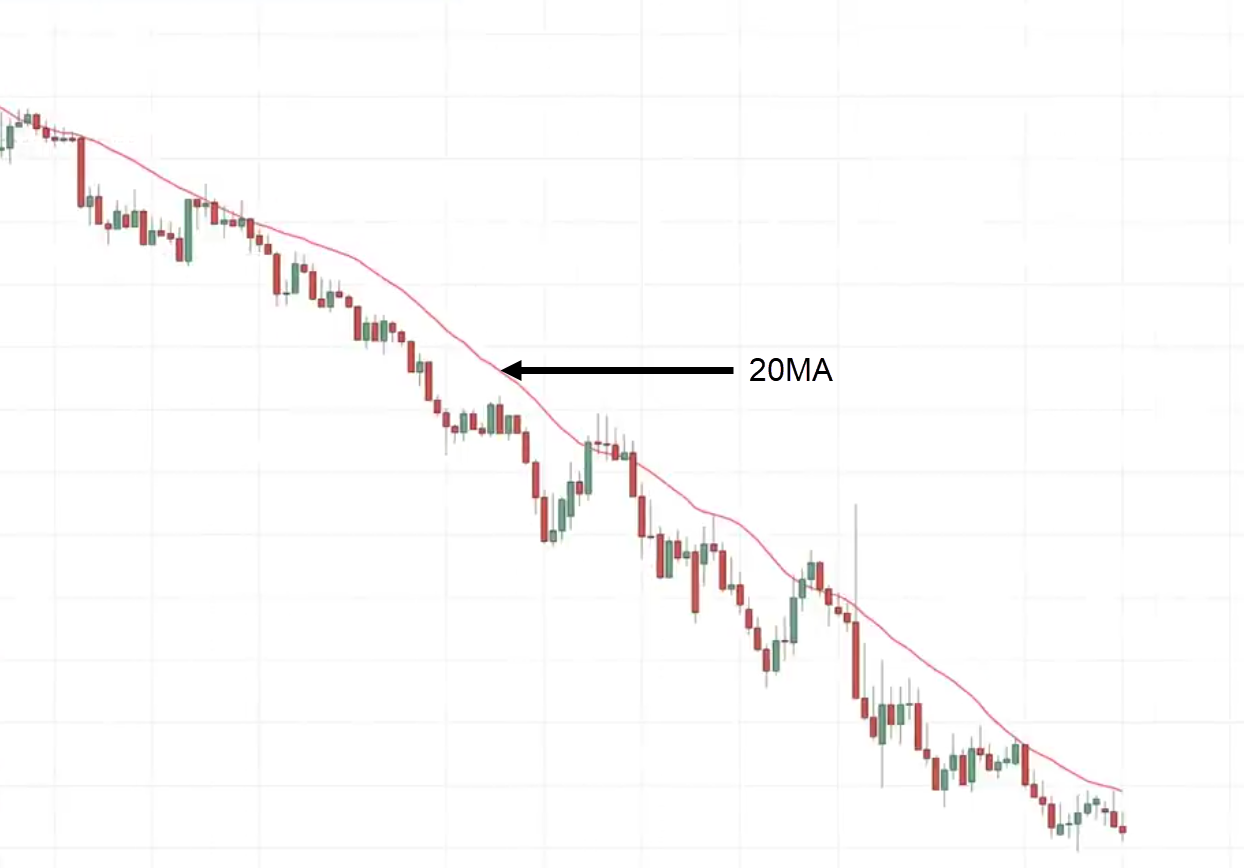
The red line is the moving average.
In this case, it’s a 20-period moving average.
One thing about the moving average is that you’ll notice it tends to follow the price.
You can see the price has declined lower and your moving average is heading down as well.
You might be wondering…
Why does it happen?
How The Moving Average Works
Let me explain.
The reason is that it calculates the average price over a given period.
Example:
You have a 5-period moving average, for an Apple stock. The stock price for the 5 days are as follows:
On the first day, the stock closed at $1
On the second day, the stock closed at $2
On the third day, the stock closed at $3
On the fourth day, the stock closed at $4
On the fifth day, the stock closed at $5
How do you calculate this 5-period moving average using the data that you have?
You just simply take the values from the first day to the fifth day and divide them by 5.
In essence, in this case, it’s a simple moving average we are calculating.
(1+2+3+4+5)/5 =$3
The 5-day moving average in this case is $3.
Just remember this number moving forward.
On the sixth day, the stock closed at $6
$(1,2,3,4,5,6)
How do you calculate the 5-day moving average on the sixth day?
Now we have six values on the chart.
If you are dealing with moving average you have to take into consideration the recent 5 days so in this case the most recent closing price over the last 5 days is:
$(1, {2,3,4,5,6})
You will ignore the first day, as you are not dealing with a 6-day moving average.
{2+3+4+5+6}/5 = $4
And so on…
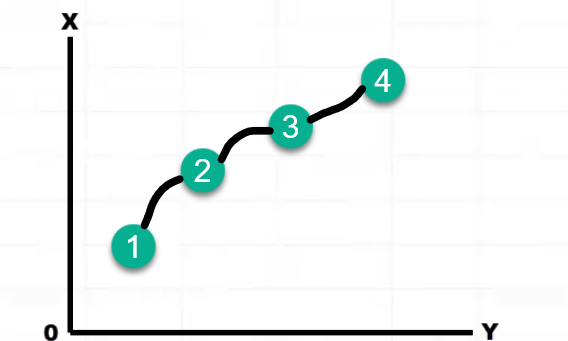
What happens is that on your chart,
Imagine this is a chart:
What happens is that they will connect these dots as lines on your chart, and that’s how your moving average is shown by calculating the average price over the last 5-days.
And of course, if your values get smaller in a descending order the moving average would point down as well.
That’s how your moving average works.
When to Use the Moving Average
Moving Average works best during a trending market. Here’s why.
Have a look at this chart:
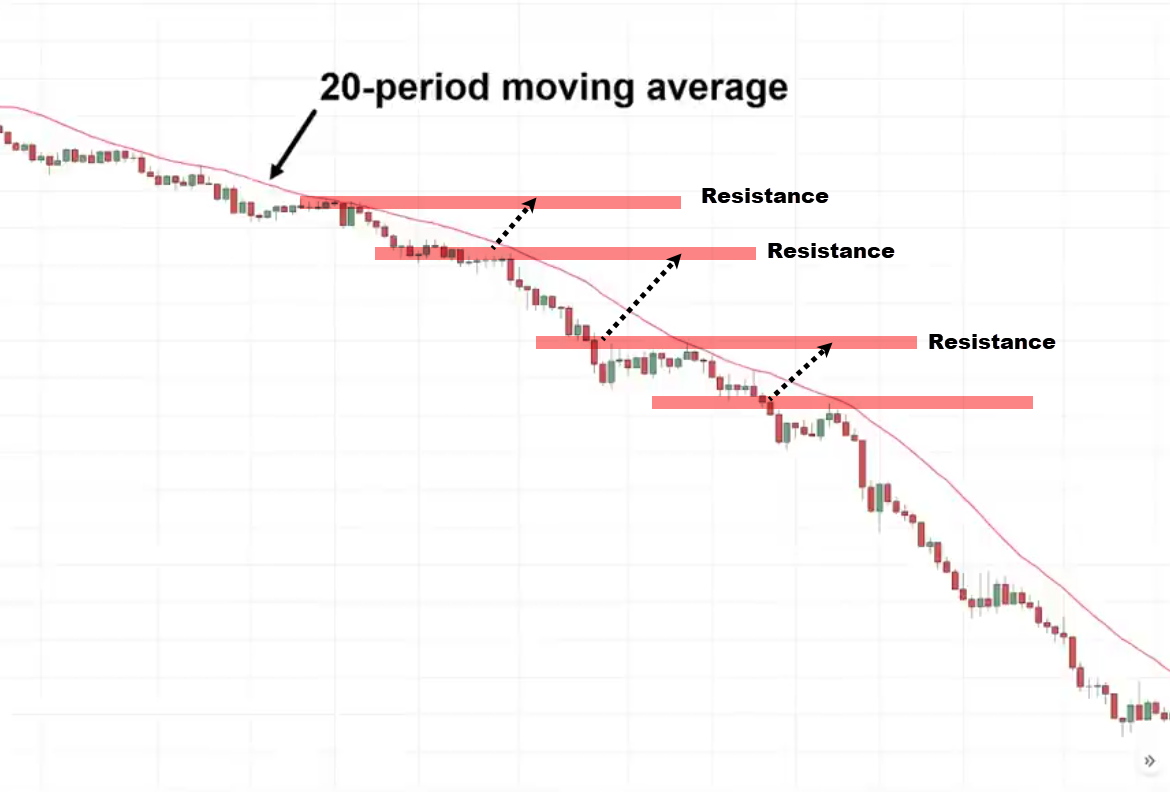
You can see that this market is in a downtrend.
The red line is the 20-period moving average. If you use this moving average for this market condition, you can see that you will be able to spot numerous trading opportunities.
You can see how the market bounced off at the moving average a couple of times.
These are all potential trading opportunities to short this market and ride the move downward.
Example:
If you are a trader who relies on support and resistance, you will be disappointed because the price never comes back to resistance. It just continued hitting lower.
There would be a lot of missed opportunities if you don’t have additional techniques in your toolbox to trade the markets.
This is a powerful arsenal.
Example:
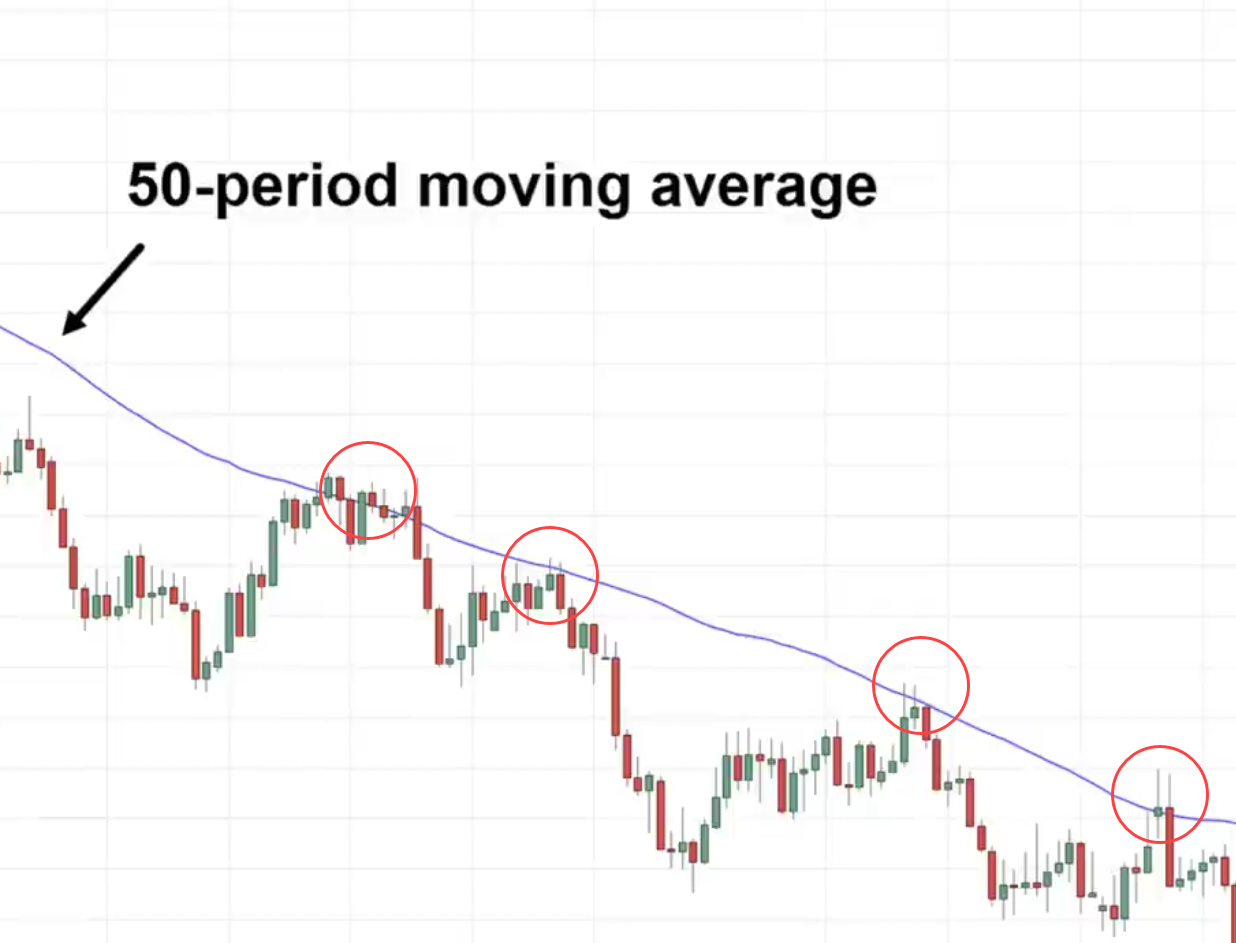
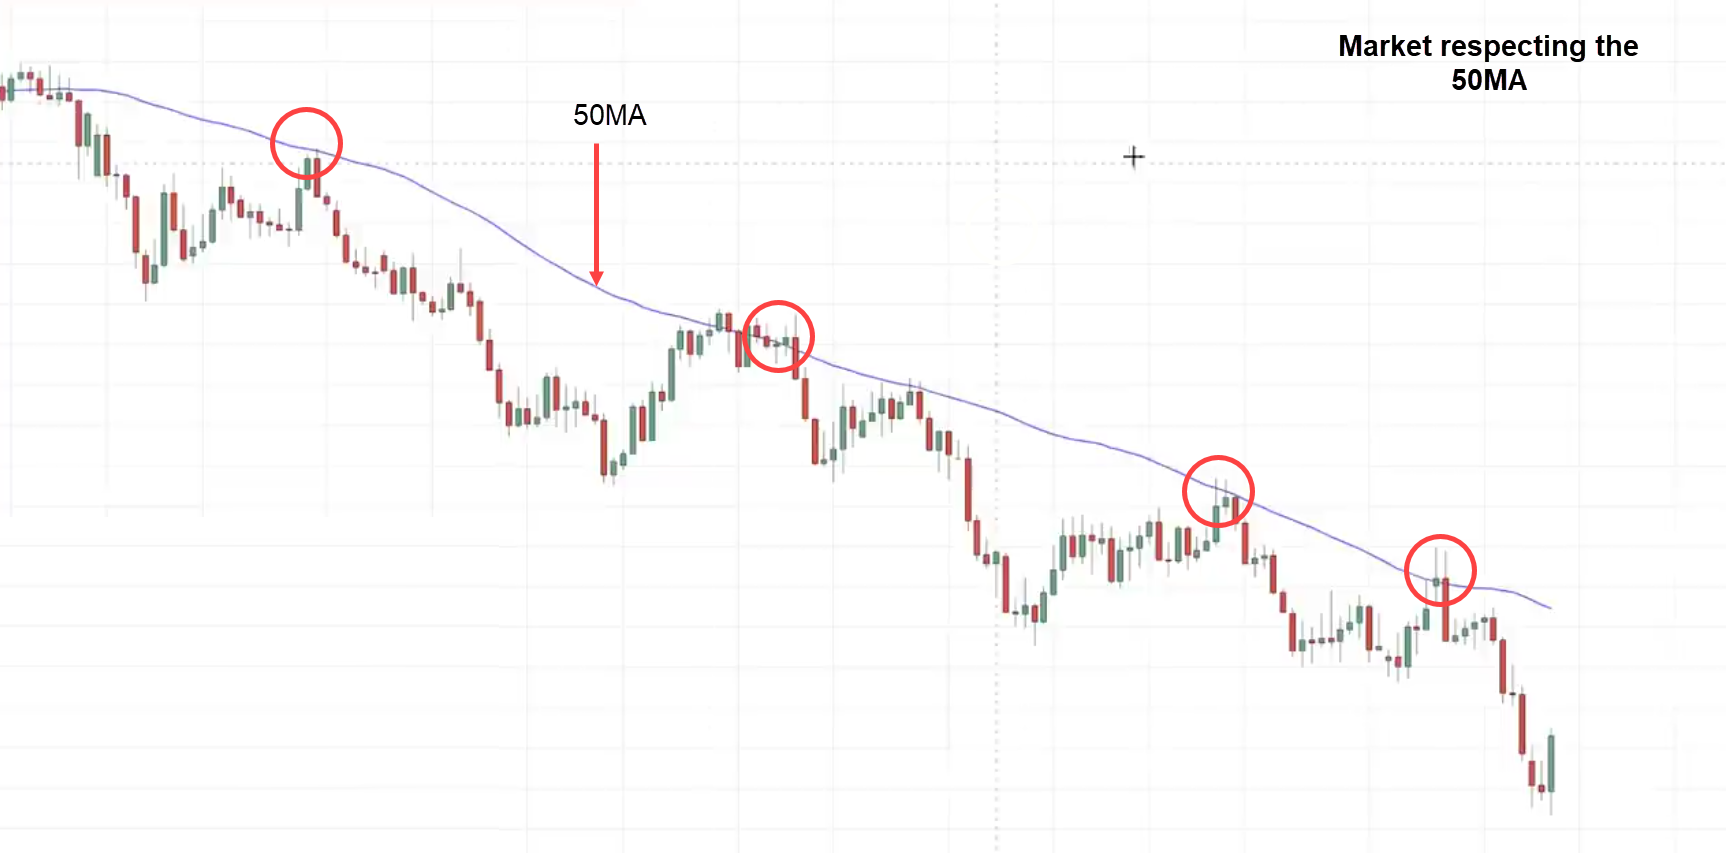
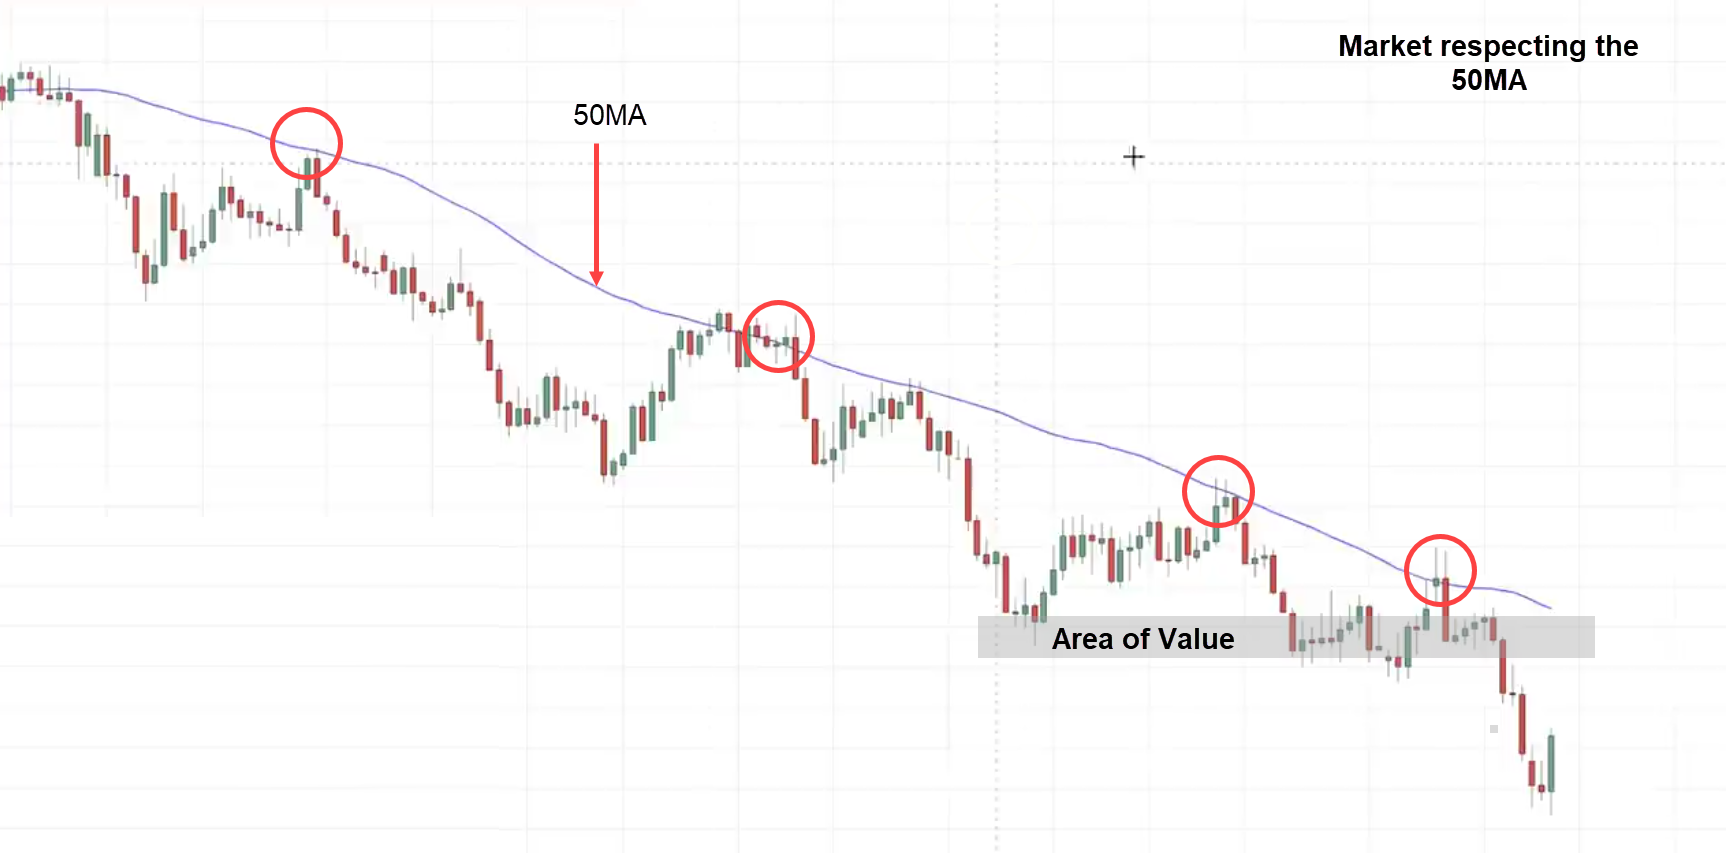
50-Moving Average
You notice how the market respects this particular moving average in this trending market condition.
The price bounces off the moving average nicely.
Later on, I’ll share with you which is the best-moving average to use.
When Not to Use the Moving Average
Ranging Market:
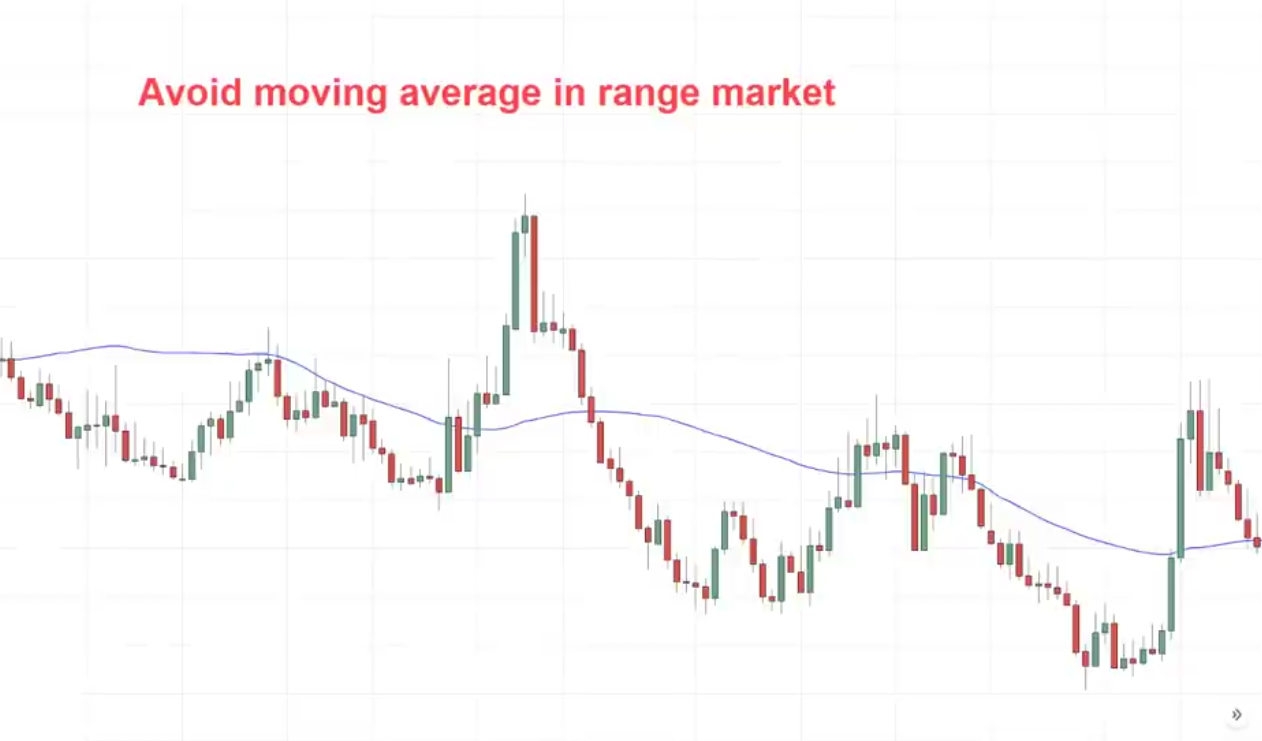
This is a perfect example:
When it’s a range market you don’t use the moving average.
Whatever moving average you have on your chart, the price will just slice through it like a hot knife through butter.
The price comes in and cuts through the moving average hits lower and goes up.
You can see that during a range market, the moving average is not effective and you only want to use the moving average when the market is trending.
It’s key to be able to identify trends.
How to Identify the Trend
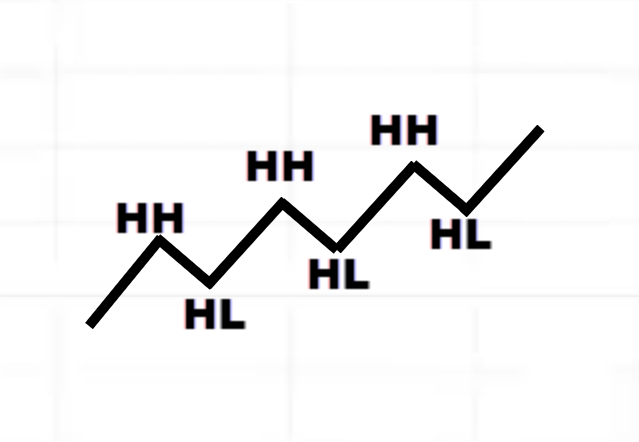
A market is said to be in an uptrend when it consists of a series of higher highs and higher lows.
Example:
Why is this called a higher low (HL)?
Because the low is higher than the previous low.
Why is this called a higher high (HH)?
Because the high is higher than the previous high.
Does it make sense?
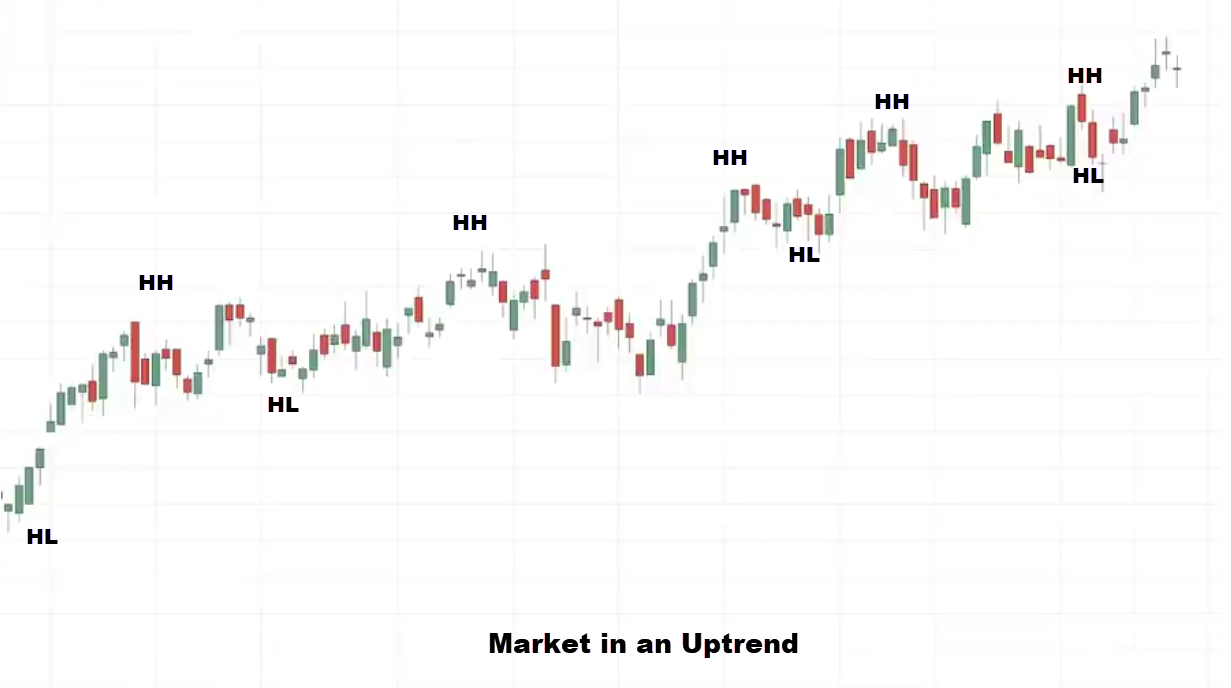
Example:
This is what we call an uptrend.
We have a series of higher-high and higher-low
You can see that when the market is in an uptrend it will consistently form a series of higher highs and higher lows.
Some of you might be thinking…
“Rayner, no this is not as easy as it seems because there are times when I see the market is in an uptrend like this then it goes lower and it continues up higher”
Let me ask you, Rayner…
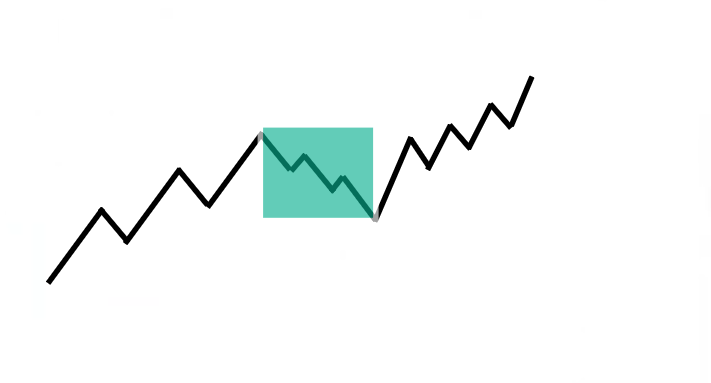
Is this now in a downtrend because we now have a lower high and a lower low?
That’s a good question…
In a market structure, in an uptrend, you don’t always get a series of higher highs and higher lows because there are times when the market can make a pullback, and within the pullback the market gets messy. It forms a lower high and a lower low.
Sometimes the market could go up and chop into a range then you think it’s a reversal and it breaks up higher.
How do we know whether an uptrend is intact or not?
This is important.
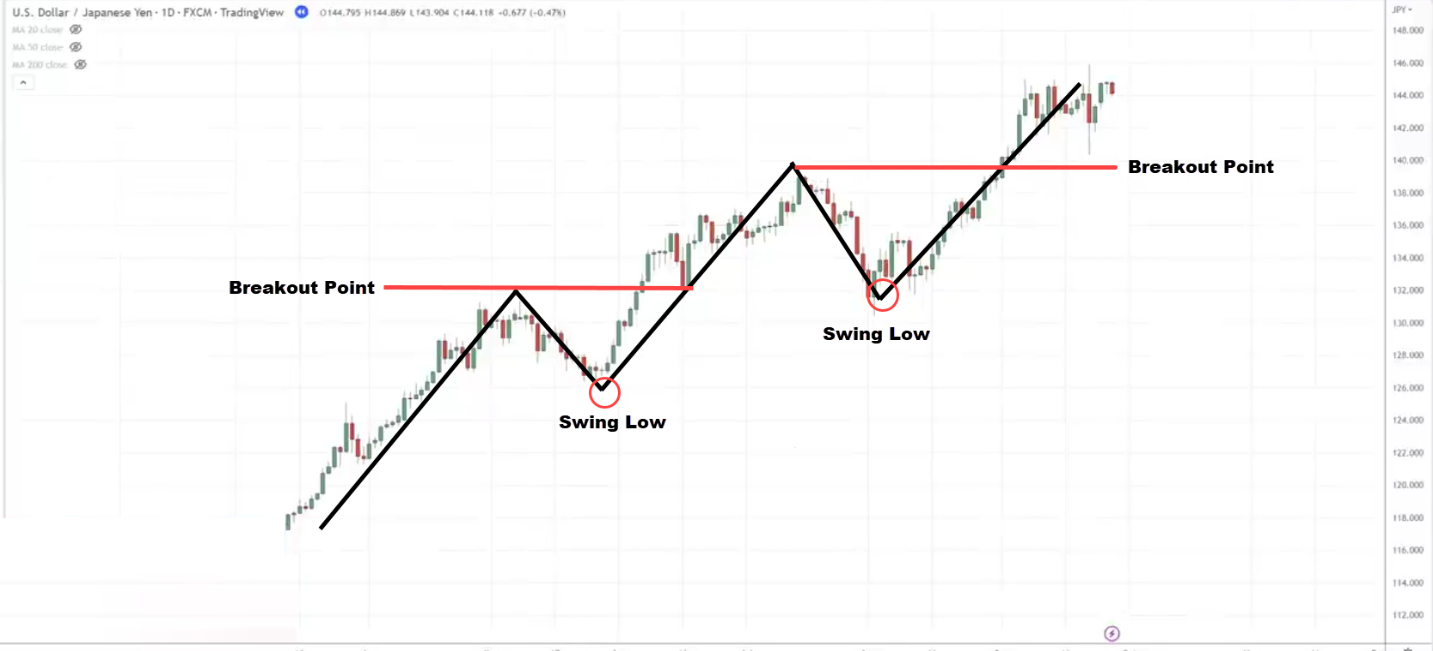
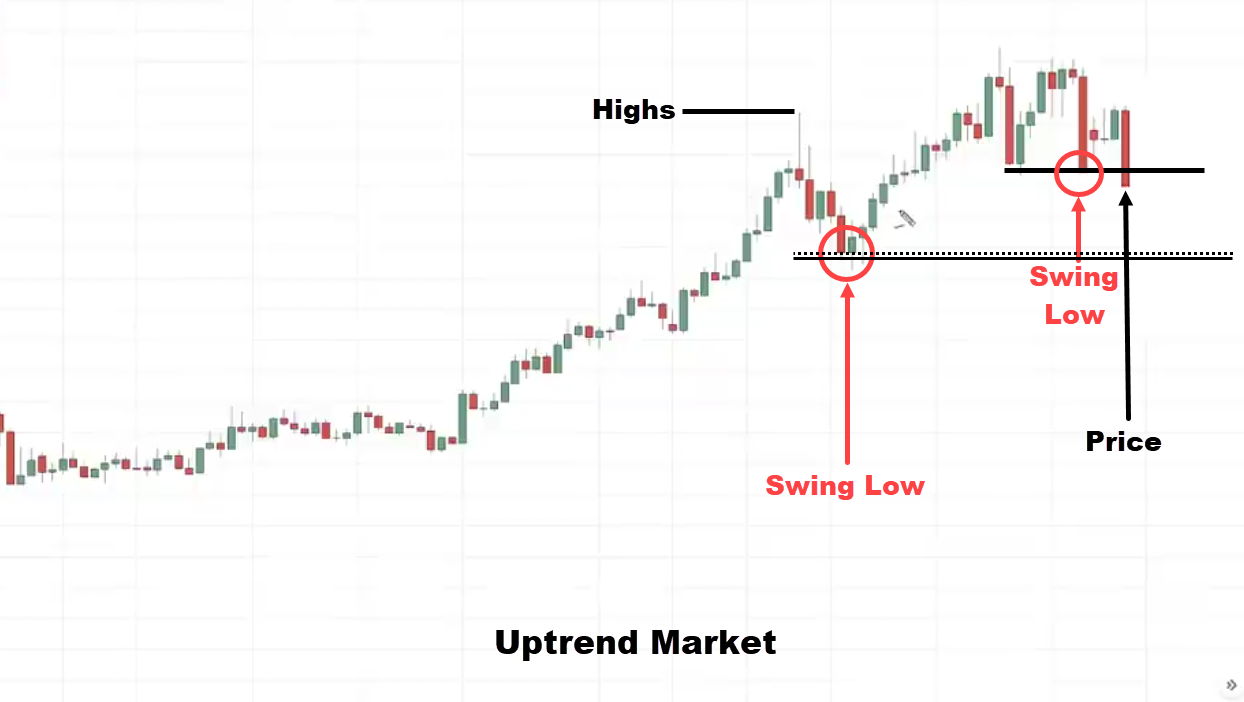
- An uptrend is invalidated only after the price breaks below the swing low (that precedes the breakout)
What do I mean by this?
If you look at an uptrend, the price goes up and down.
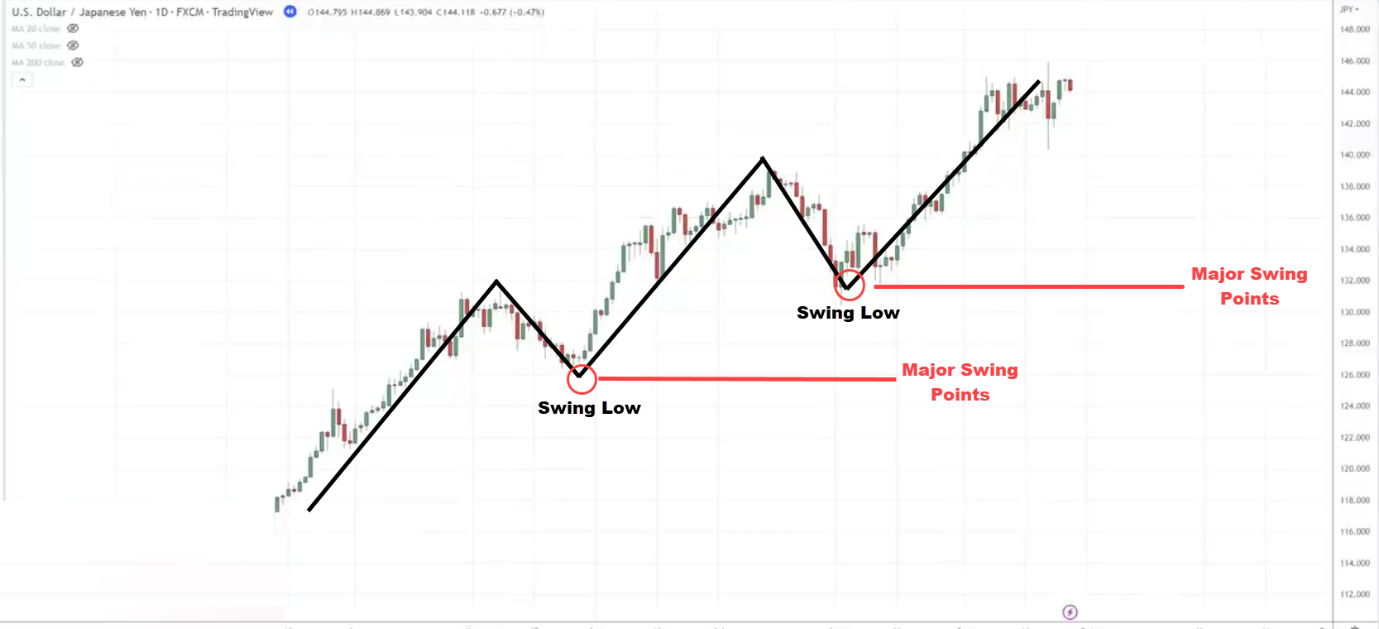
When we talk about the swing low, the swing low that precedes the breakout, we are referring basically to a major swing point on the chart.
When I talk about major swing points, it can be hard to decide like for me, I know this is a major swing point. Here is an example:
But to new traders, they can’t tell.
How do we know that’s a major swing point?
You want to look at where the market broke out previously.
We can see over here previously, that this was the breakout point:
Where is the swing low that happened before the breakout?
The word “precedes” means “before”.
You can see the swing low that happened before the breakout.
In other words, this uptrend will be intact unless the market has broken and then closed below this swing low until that has happened, we will say that the uptrend is still valid and we are expecting higher prices to come.
Example:
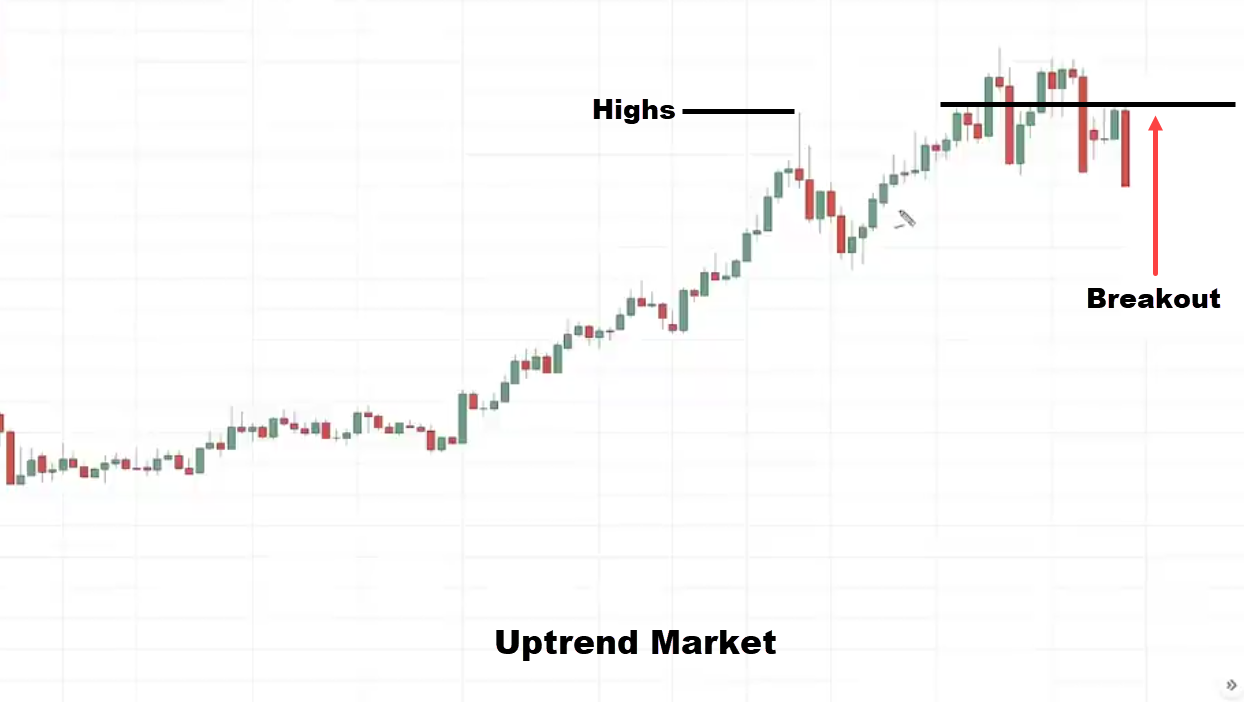
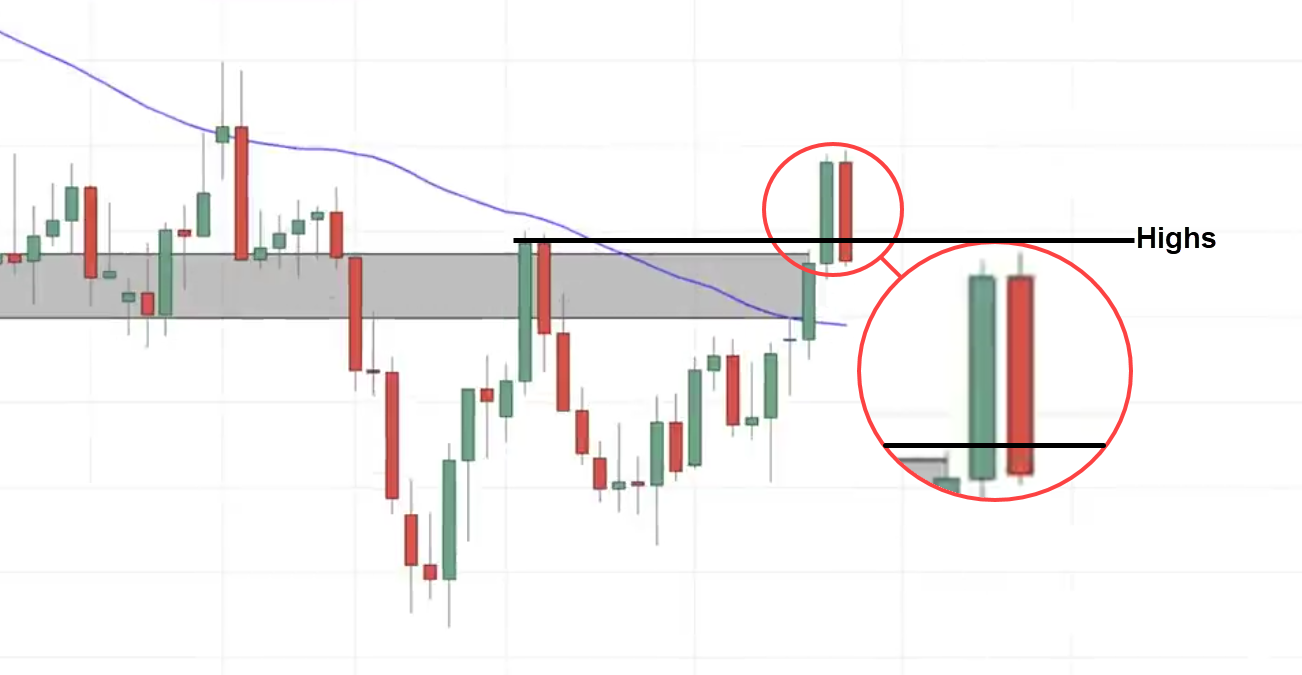
If you look at this chart.
When the market breaks out of the highs, you have to ask yourself…
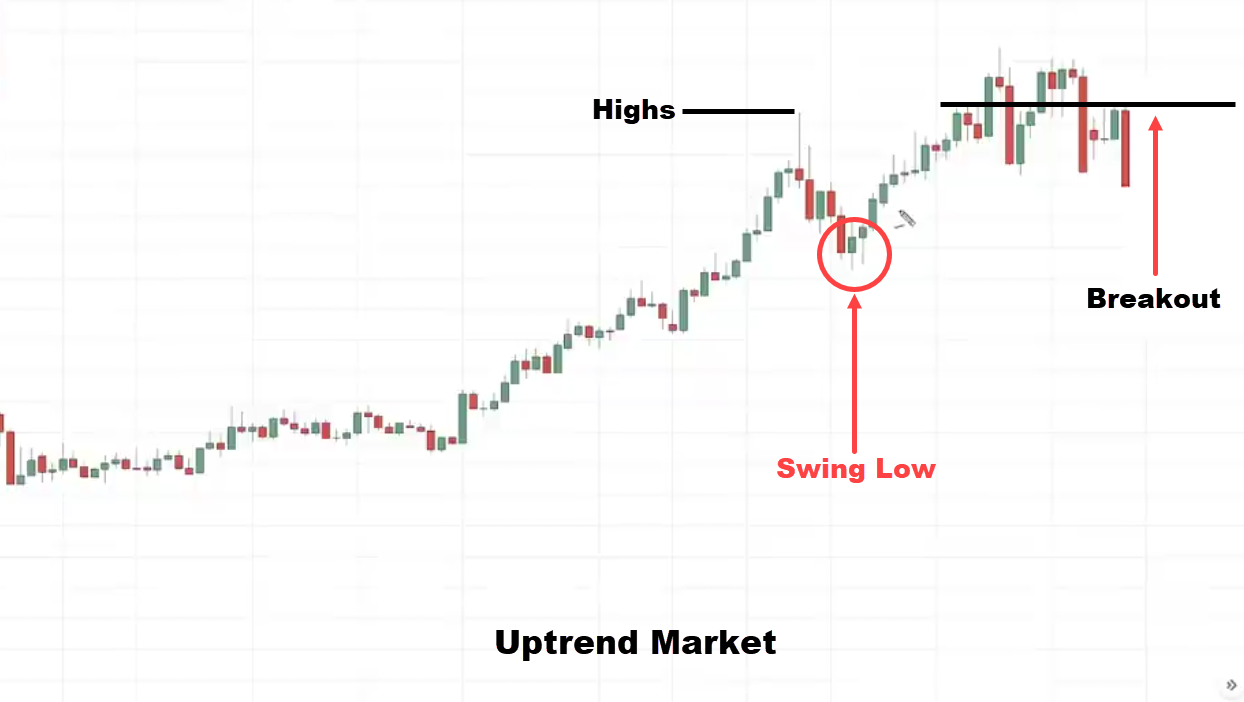
Where is the swing low that precedes the breakout?
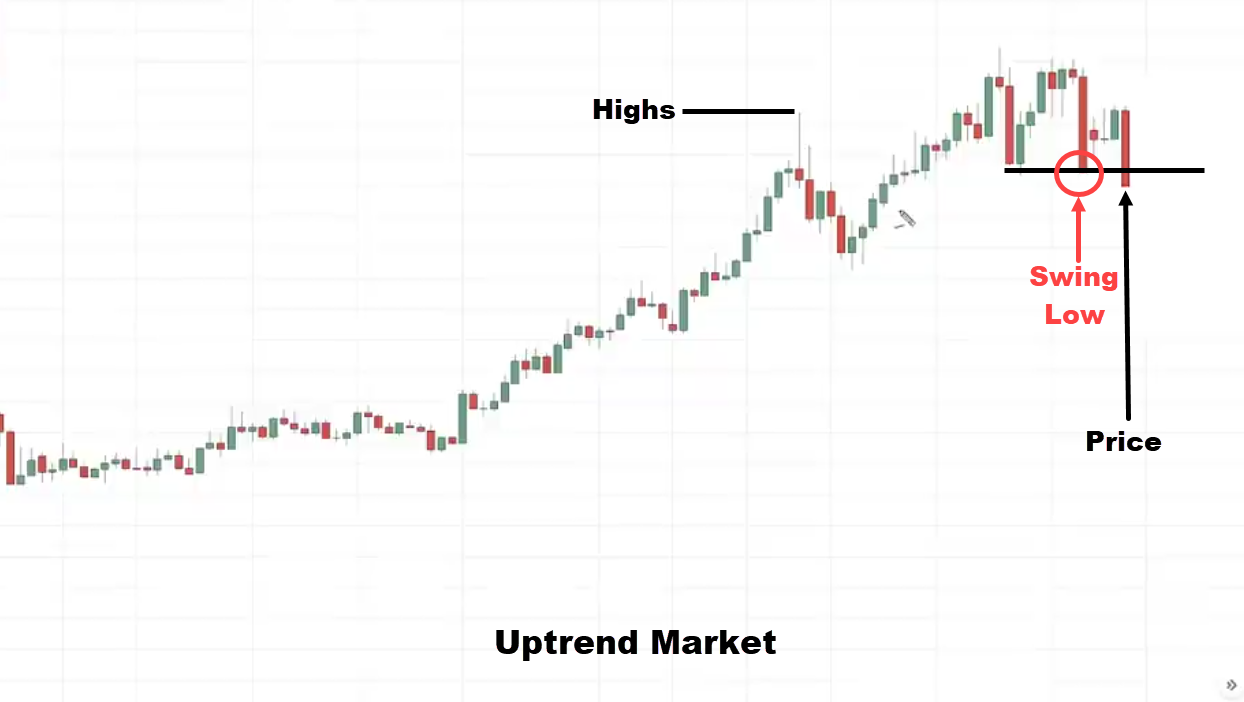
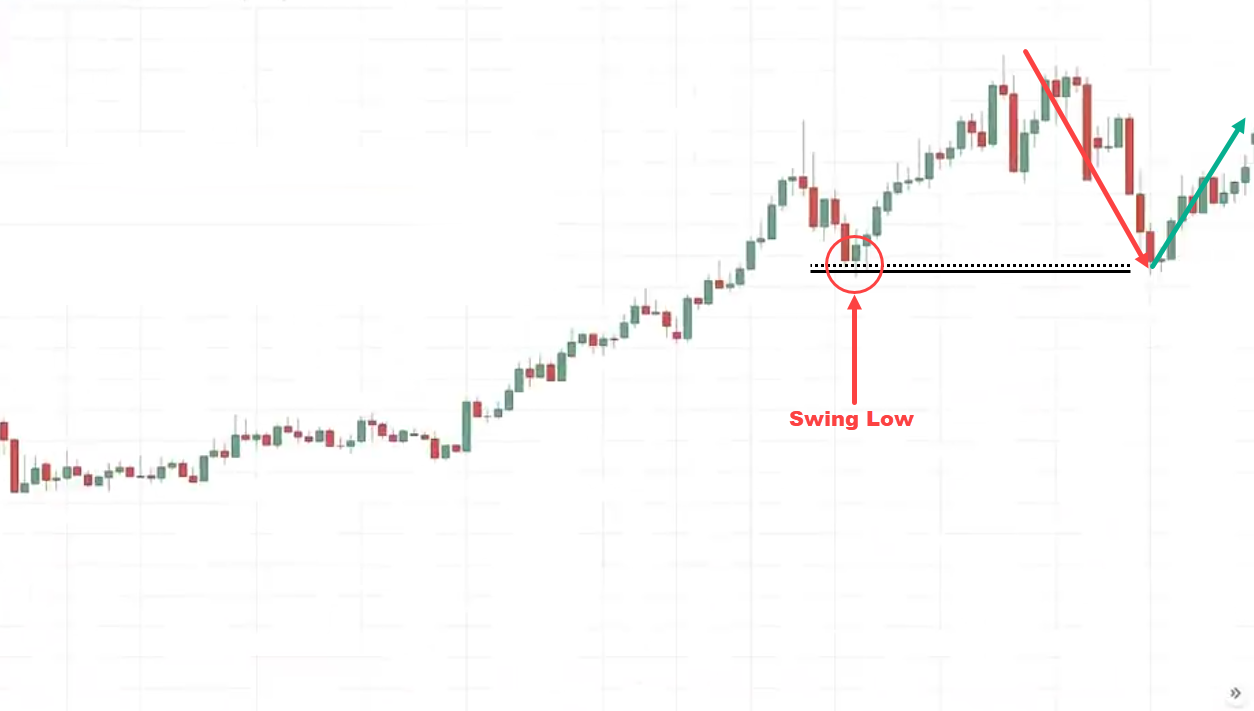
When you look at this chart you can see that the market has broken and closed below this swing low. This is what I mean:
My question to you now…
Is this uptrend still intact or it has been invalidated?
The answer is the uptrend is still intact because it did not break below the swing low that precedes the breakout.
You can see what happened next. The market dipped down and then continued up higher.
Because this is the swing low that you want to pay attention to. Only if the market breaks and closes below it we can say the uptrend is no longer intact and could go into a range or reverse lower.
Always remember, that the uptrend is invalidated only after the price breaks below the swing low that precedes the breakout.
How to Identify the Area of Value
How do you identify the area of value?
There are two things that you must have…
The two test criteria.
What do I mean by that?
Let me give you an example:
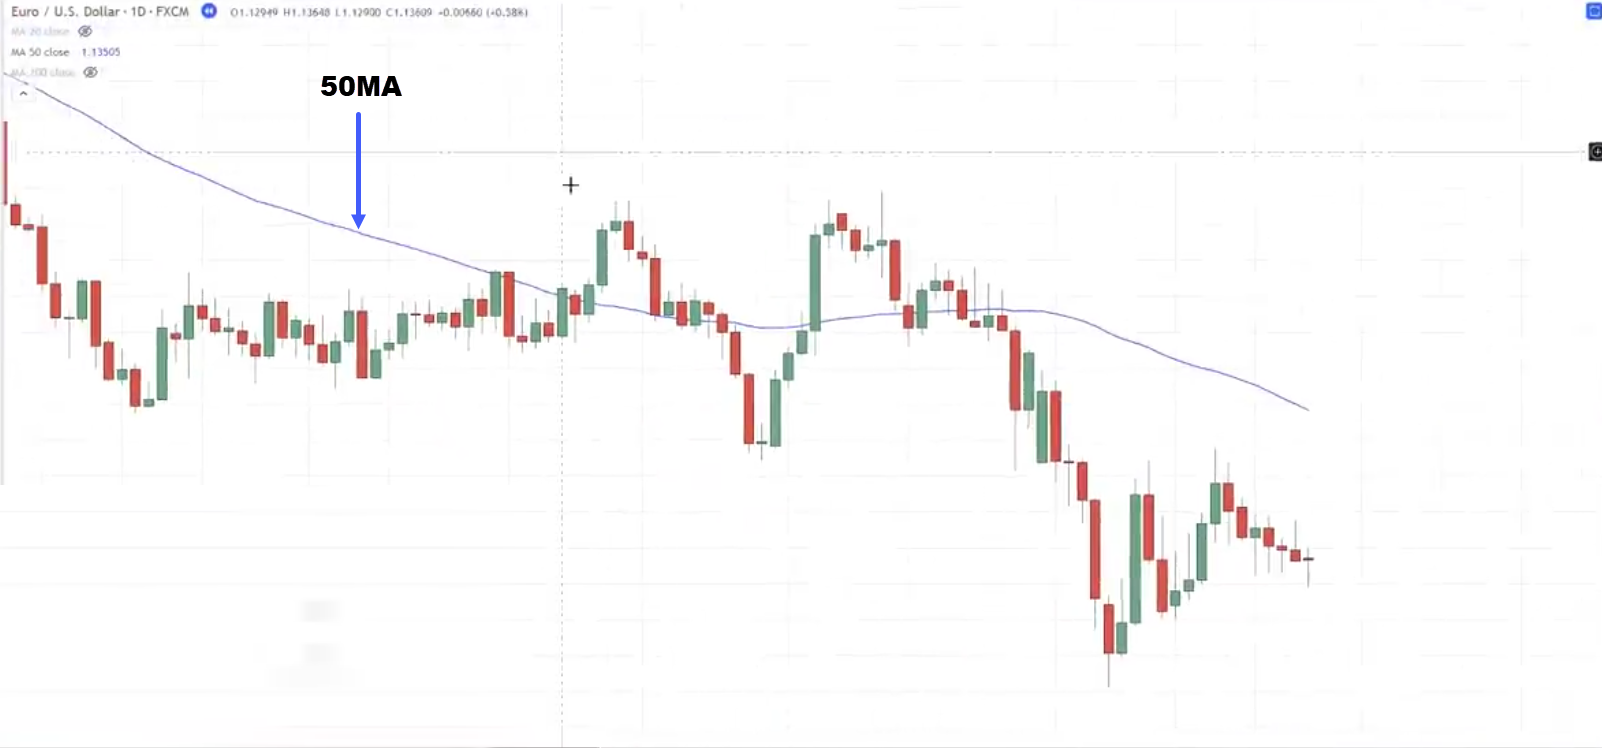
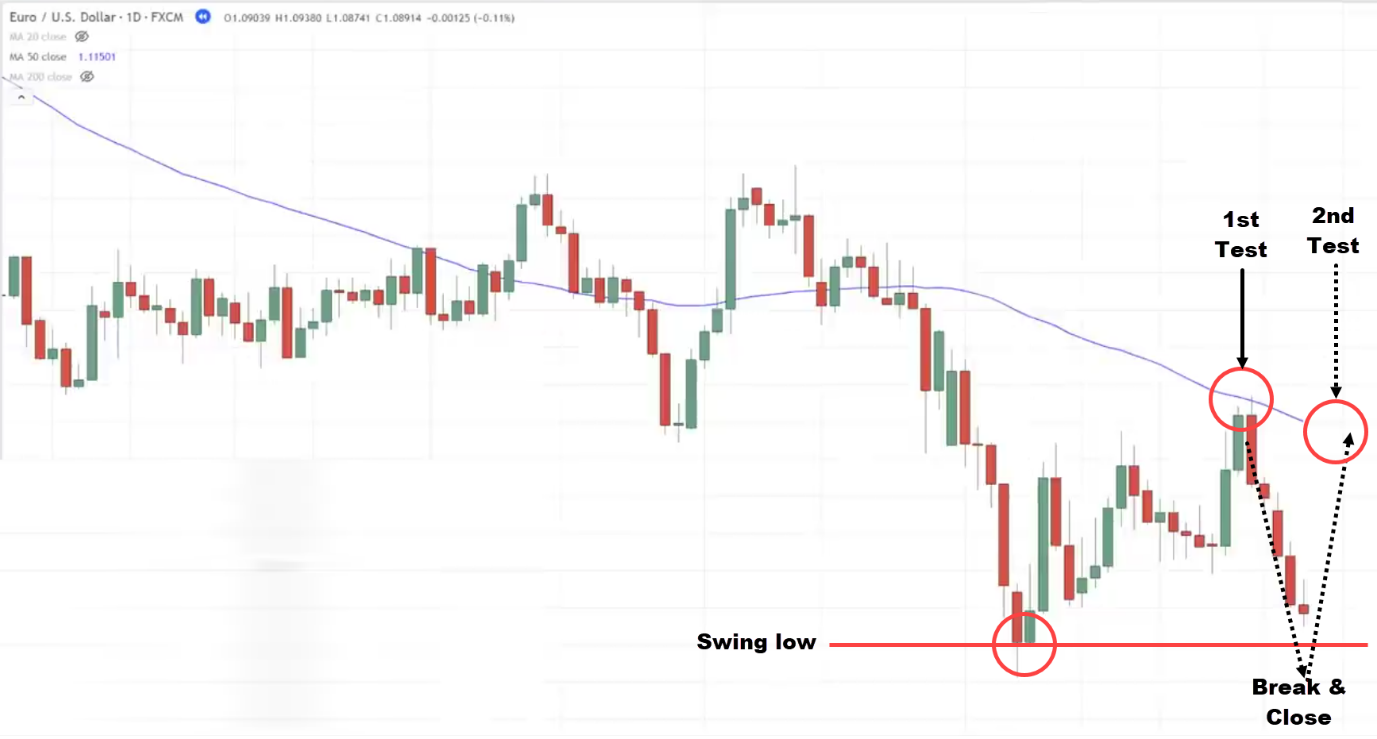
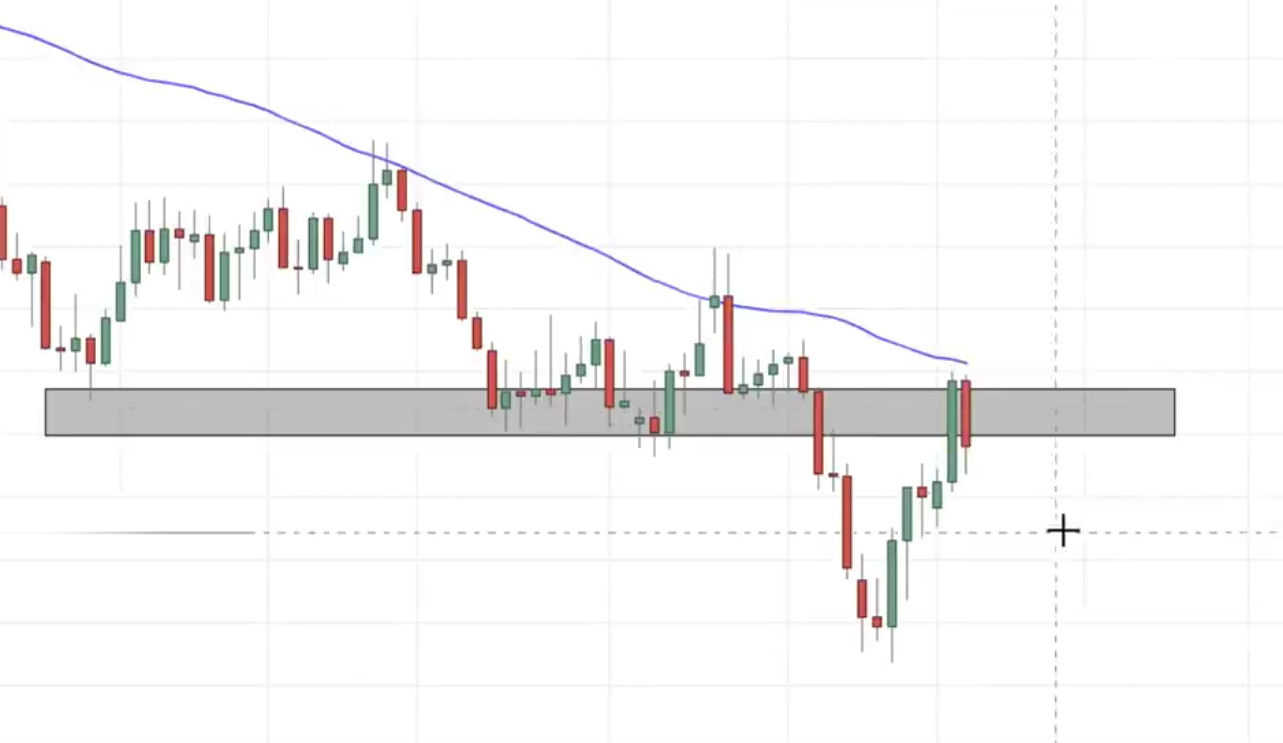
I have overlaid the 50-period moving average.
At this point, the market doesn’t seem to be respecting the moving average.
What do I mean by the two test criteria?
Very simple…
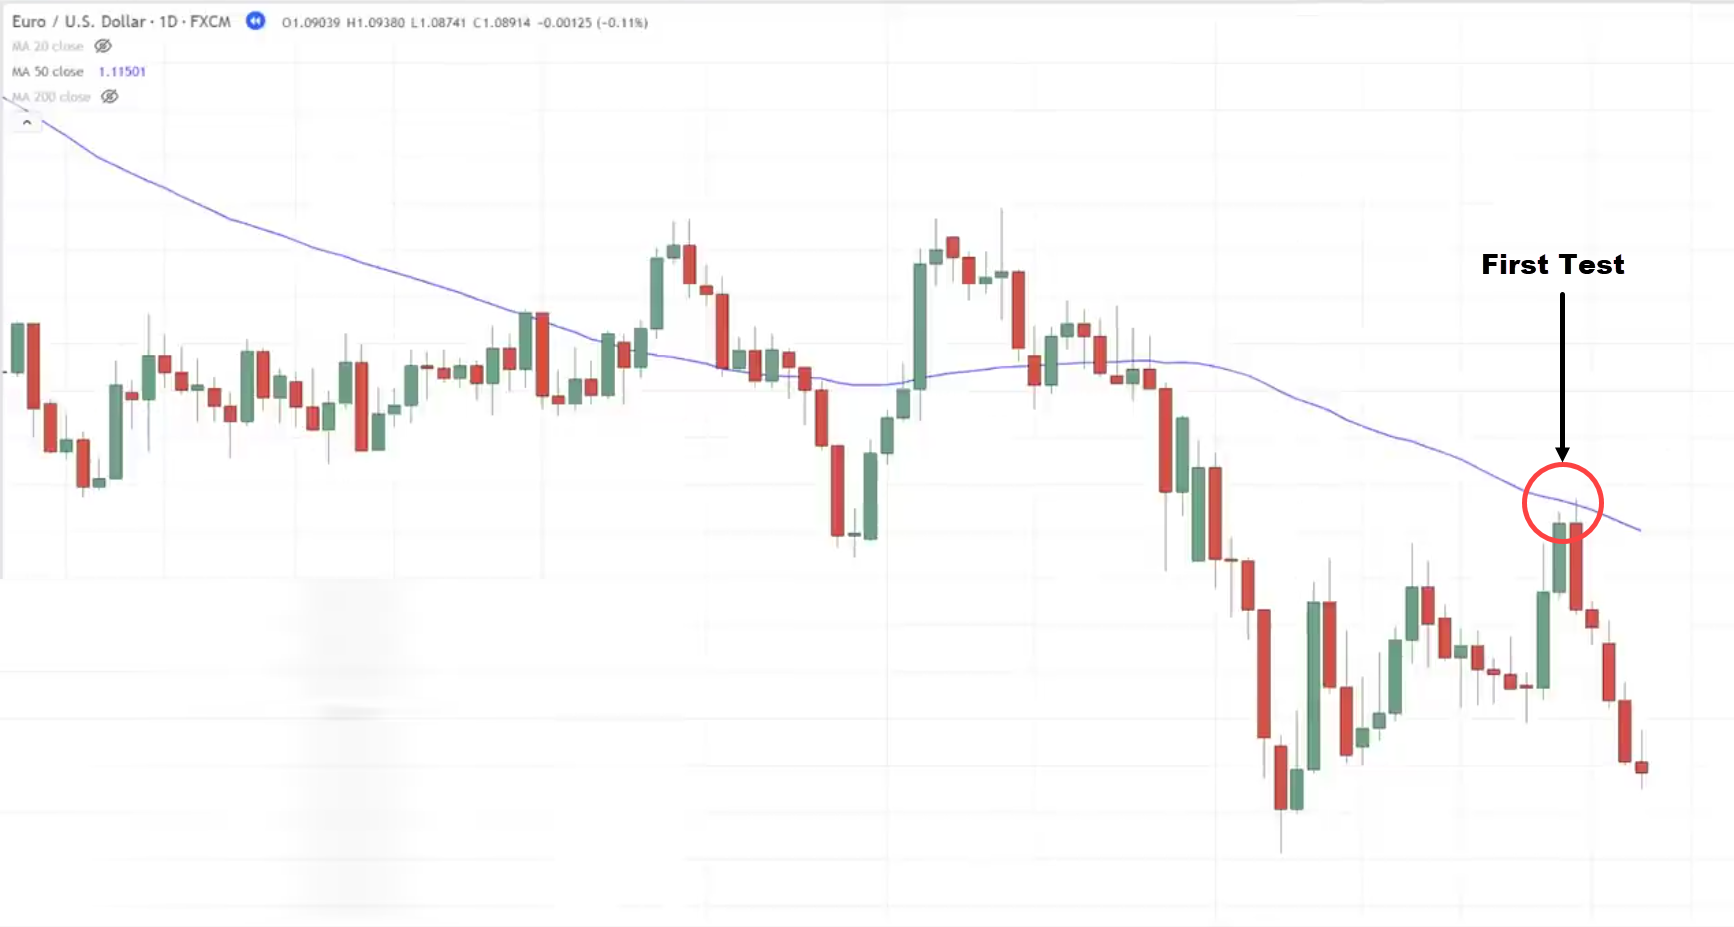
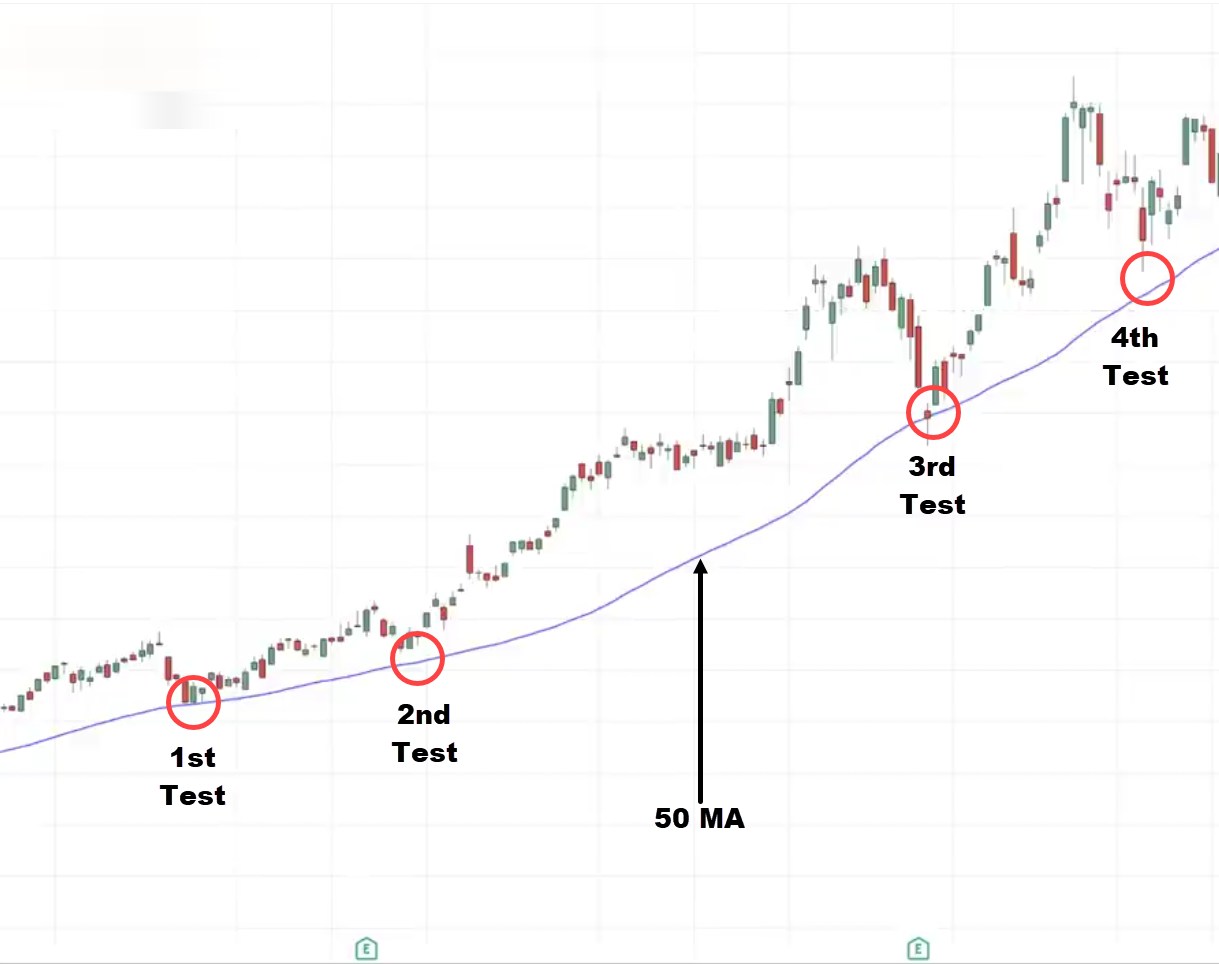
In this case, the market bounces off the 50-period moving average, so we have one test and we are looking for at least two tests for the market to confirm and tell us that it’s respecting this moving average.
This is where you want to pay attention to for at least two tests, we already have one test.
The way I define the two tests is that the market must break below the swing low and retest the moving average to confirm it as a second test.
This means the market must come down and break below the swing low and then hit up higher and retest a second time. Here is what I mean:
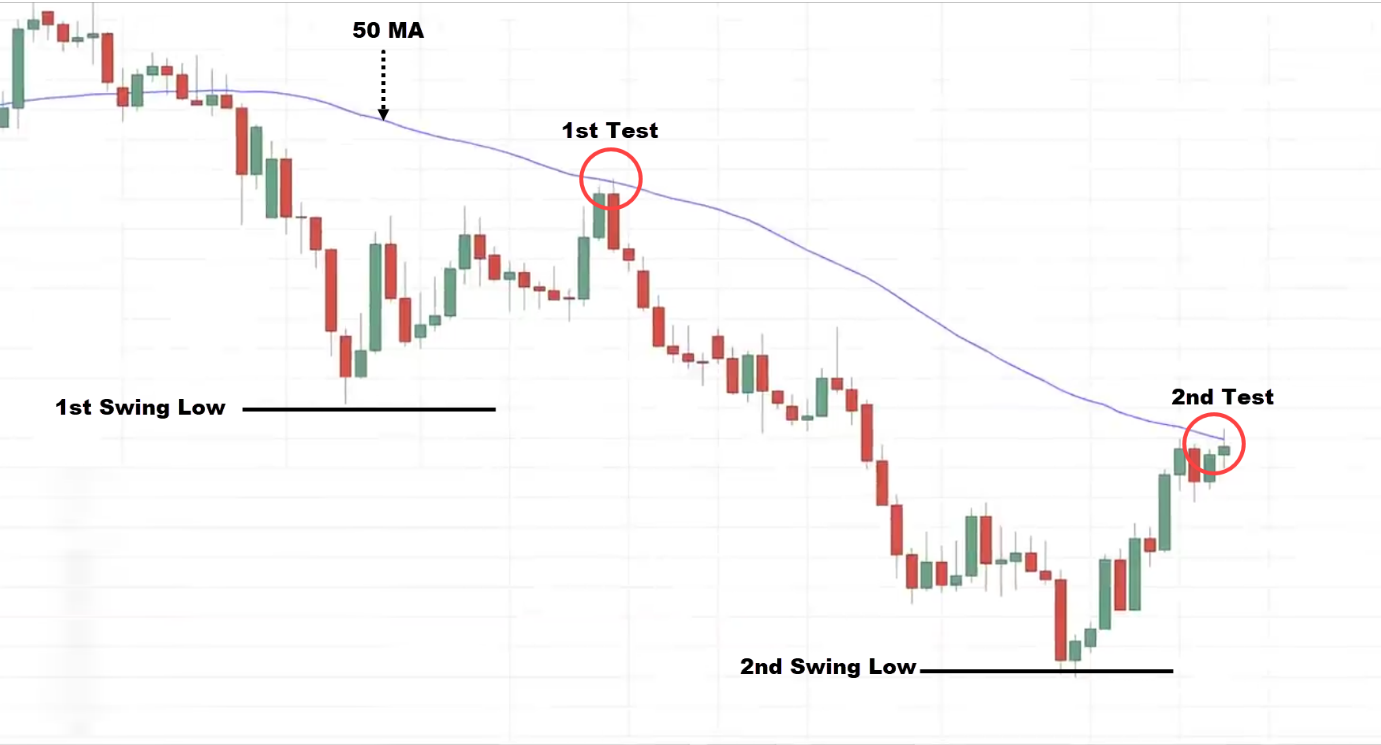
Only then will I consider this a second test. Because I still want to see the market rejected here to confirm there are at least two tests. Let’s see what happens:
Now we have our two tests.
But there’s a technique that I want to share with you…
I’m not going to short this market now: I’d like to see it rejected at the moving average to confirm there’s a two-test.
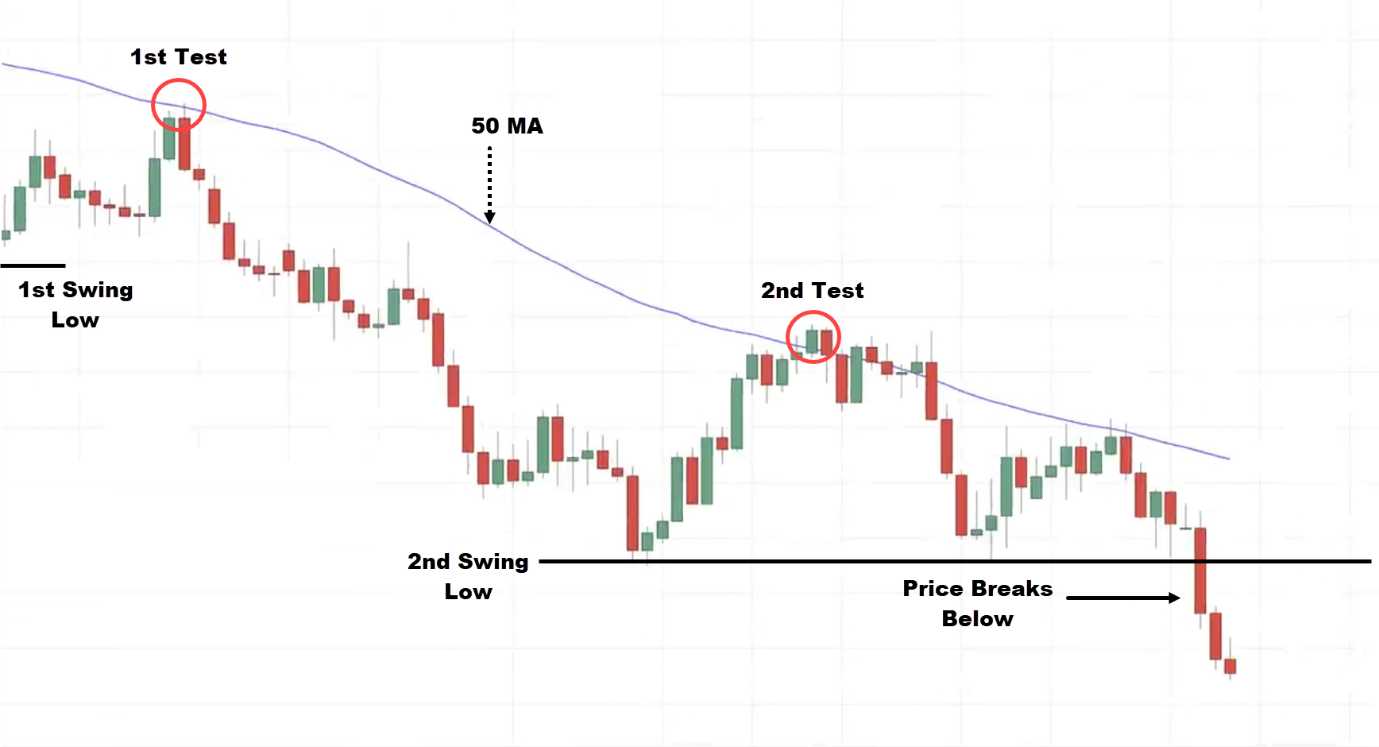
I’ll wait for the price to break below the second swing low to confirm there are at least two tests in this particular market. Here’s what I mean:
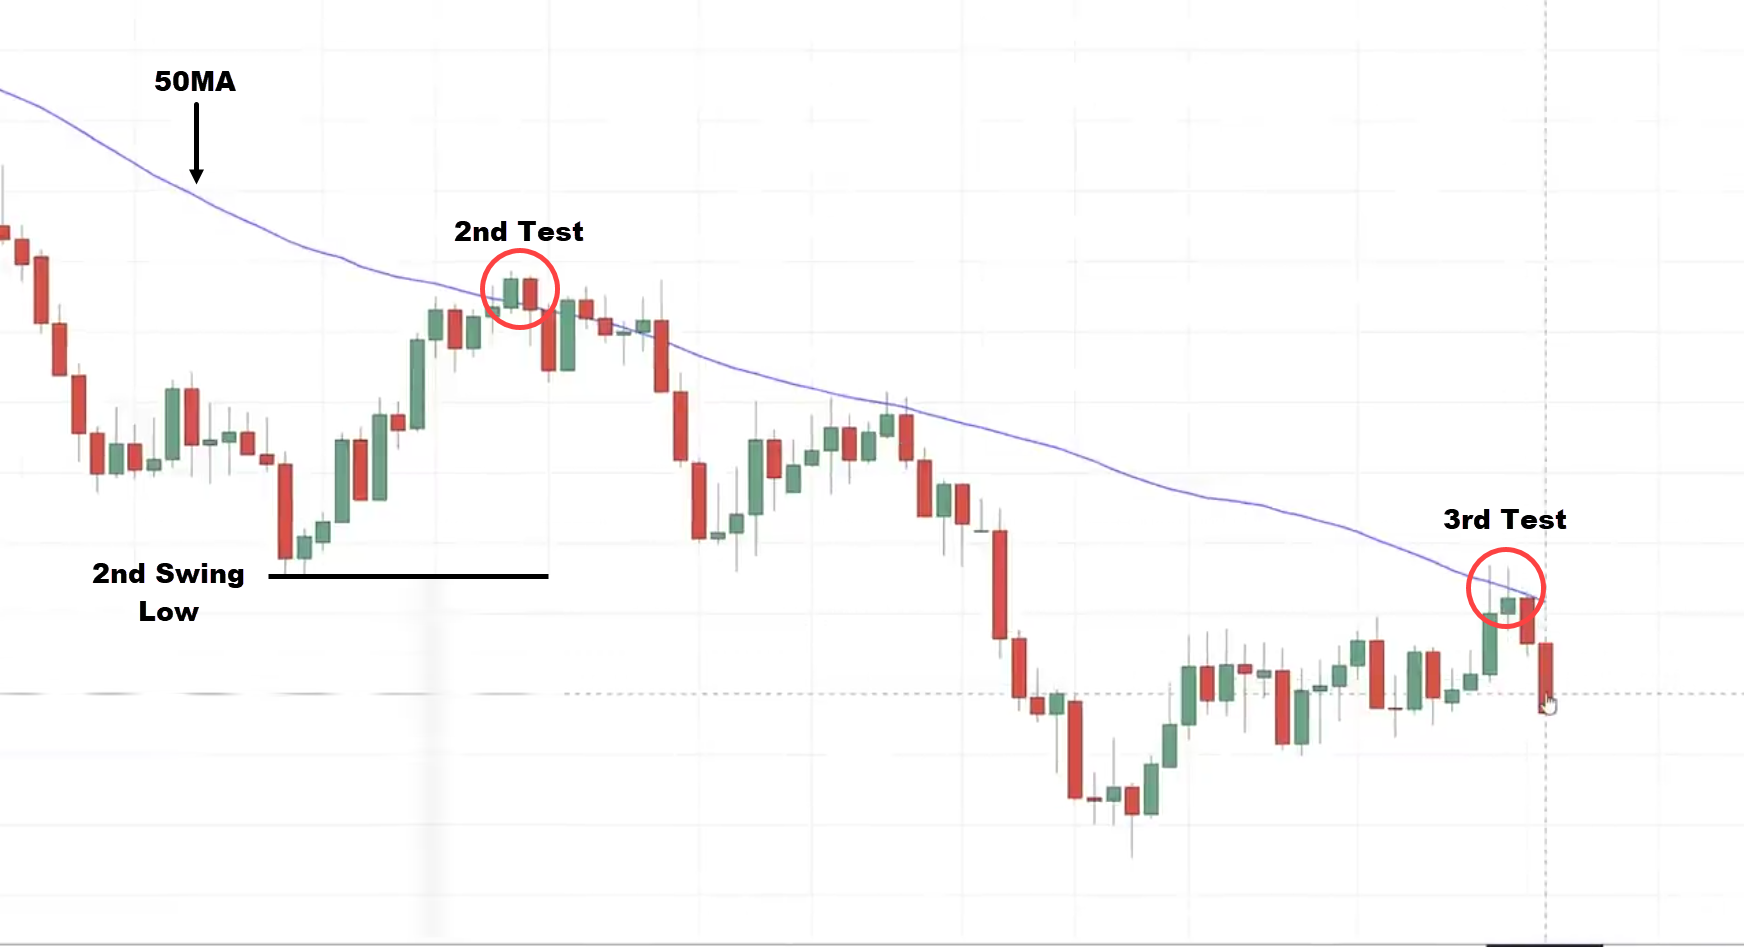
I can then look for potential trading opportunities on the third test:
Recall, my rule for the market to consider a test is that it must break below the swing low.
Which is the Best Moving Average?
You might be wondering…
Which is the best moving average?
The answer is there’s no best-moving average.
Because it depends on the type of trends you are dealing with.
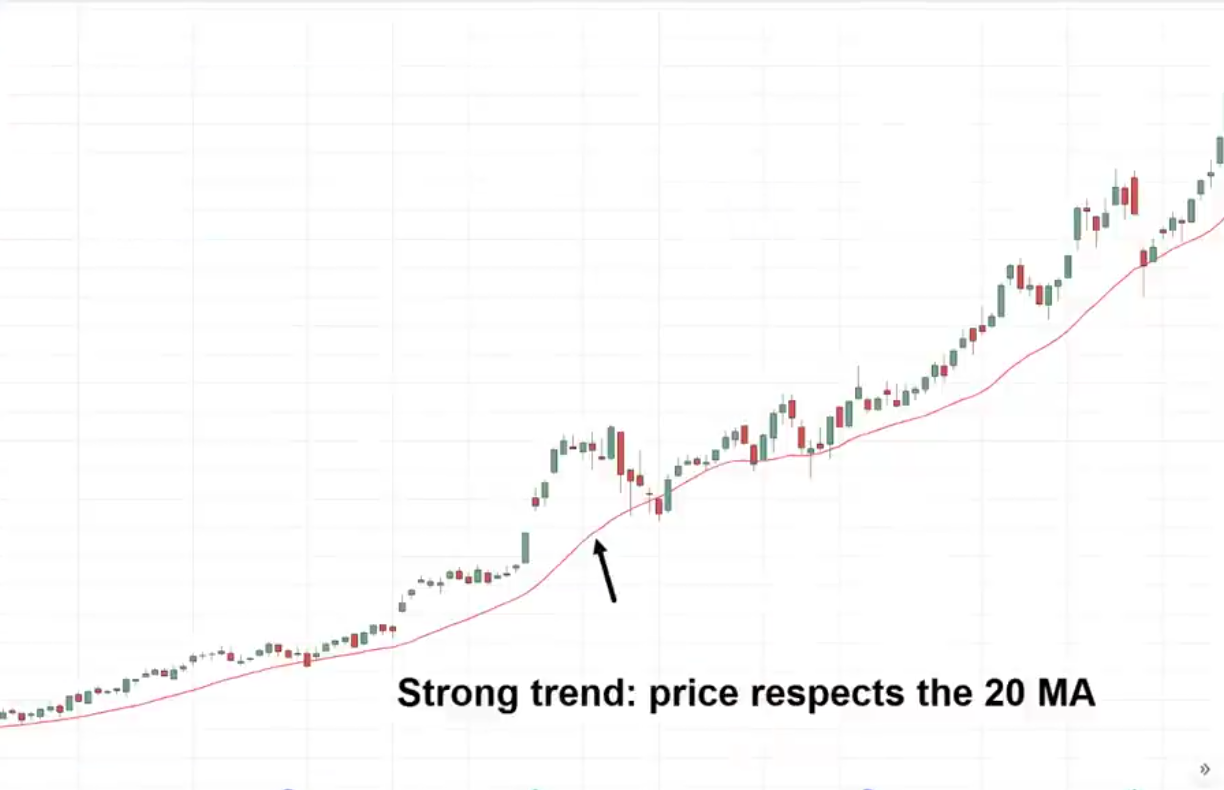
Strong Trend:
If you notice that the market is in a strong uptrend, the right moving average would be the 20-moving average for that market condition. Here’s what I mean:
How do you identify a strong trend?
You notice the depth of the pullback is relatively shallow. Always pay attention to the pullback.
If you notice that it’s shallow, the 20-period moving average will be a better fit for the kind of market condition.
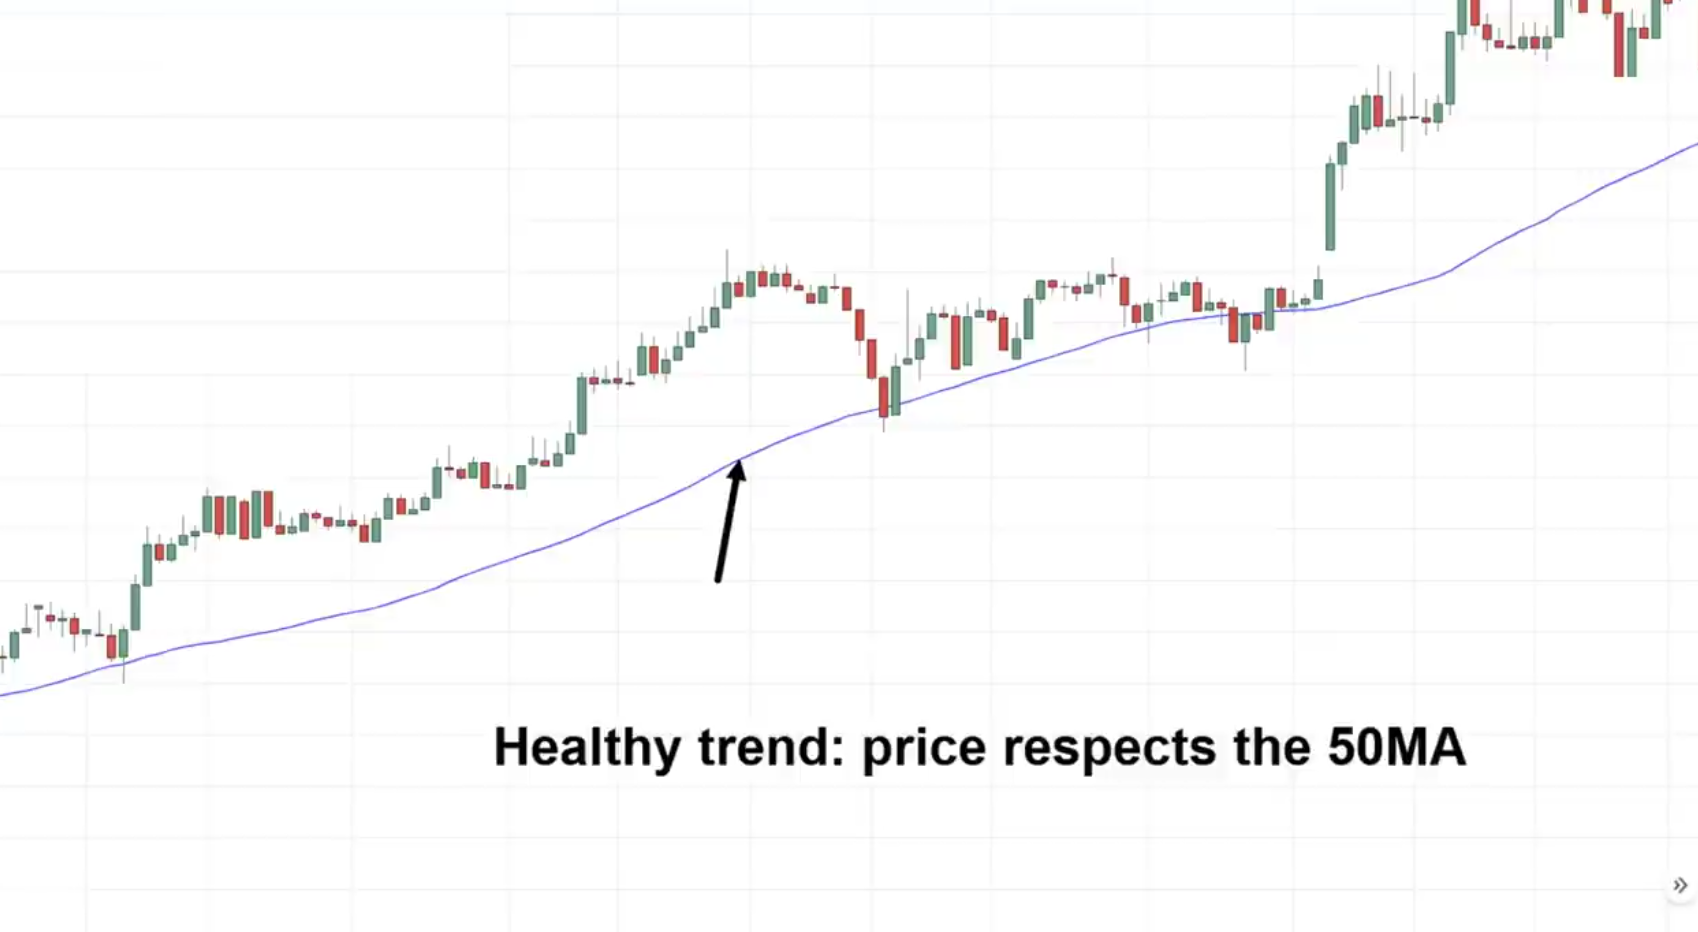
Healthy Trend:
If you notice that the pullback is a little bit deeper, then this is what I call a healthy trend.
This is where the 50-period moving average will be more applicable in this case. Here’s an example:
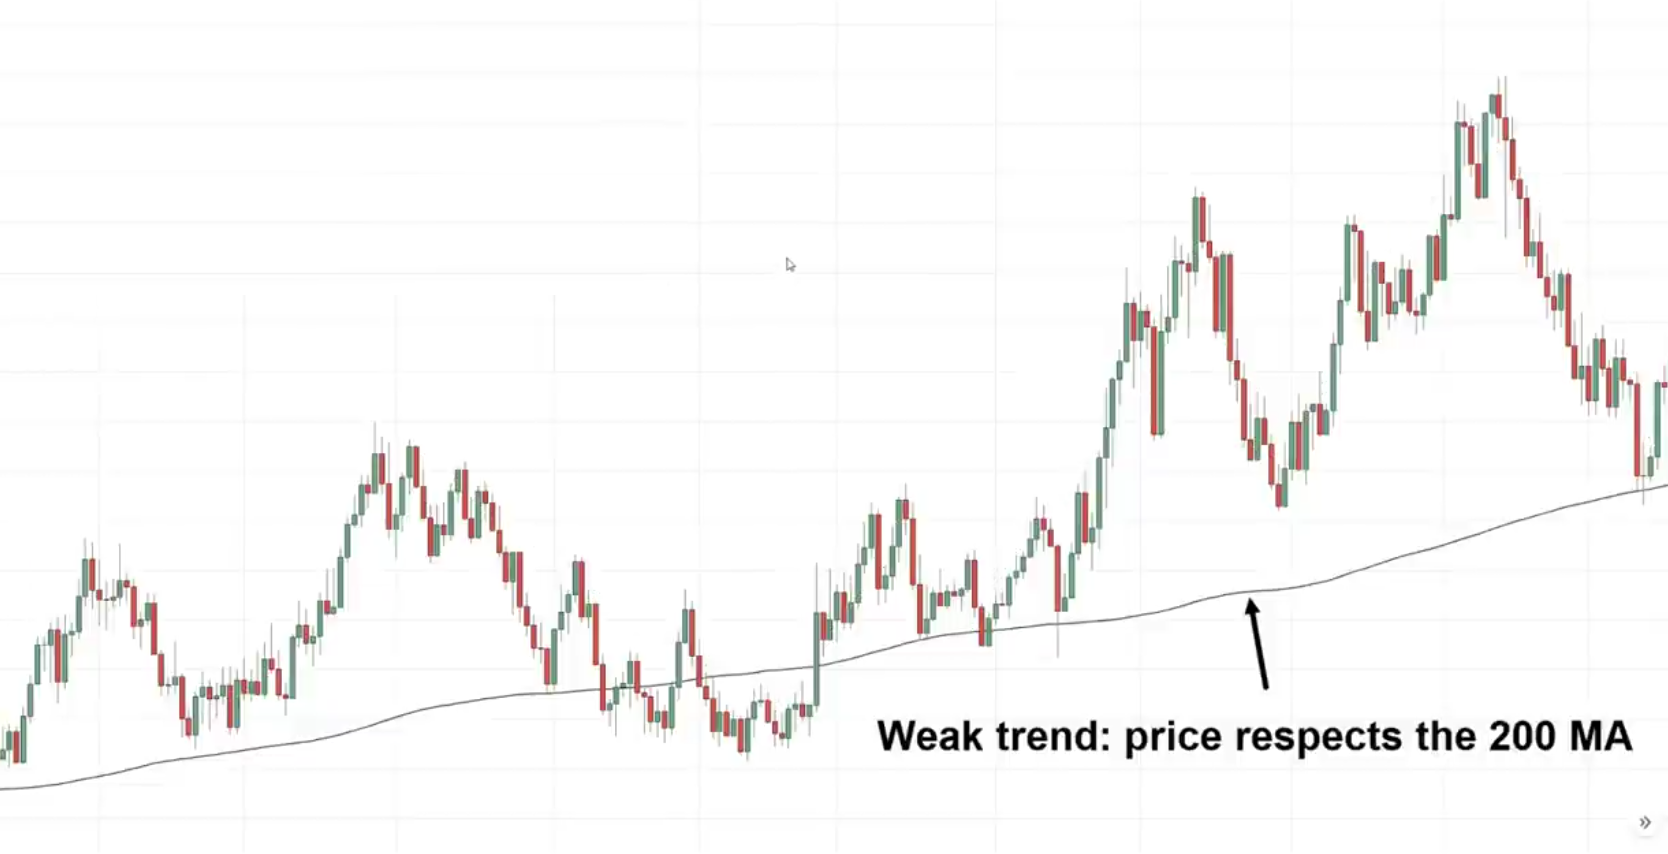
Weak Trend:
When you notice that the pullback is strong and huge, then this is what I call a weak trend.
In a weak trend, you can use anywhere between 100-200 period moving average.
You can use these moving averages to identify the area of value. Here is what I mean:
Trading Examples
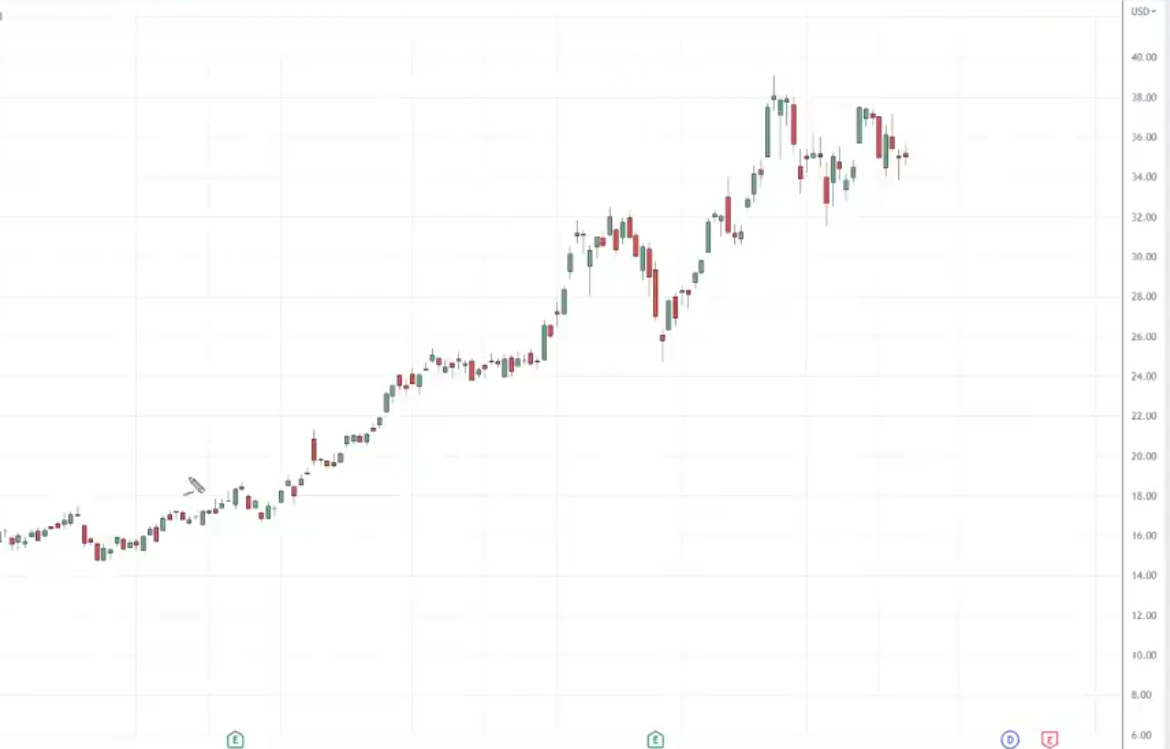
Take a look at this chart:
It’s in an uptrend.
Now that we know that this stock is in an uptrend, we can use the moving average indicator to help us identify the area of value.
In this case, it seems like a healthy trend.
I’ll overlay it with the 50-period moving average.
Let me walk you through and identify the number of tests:
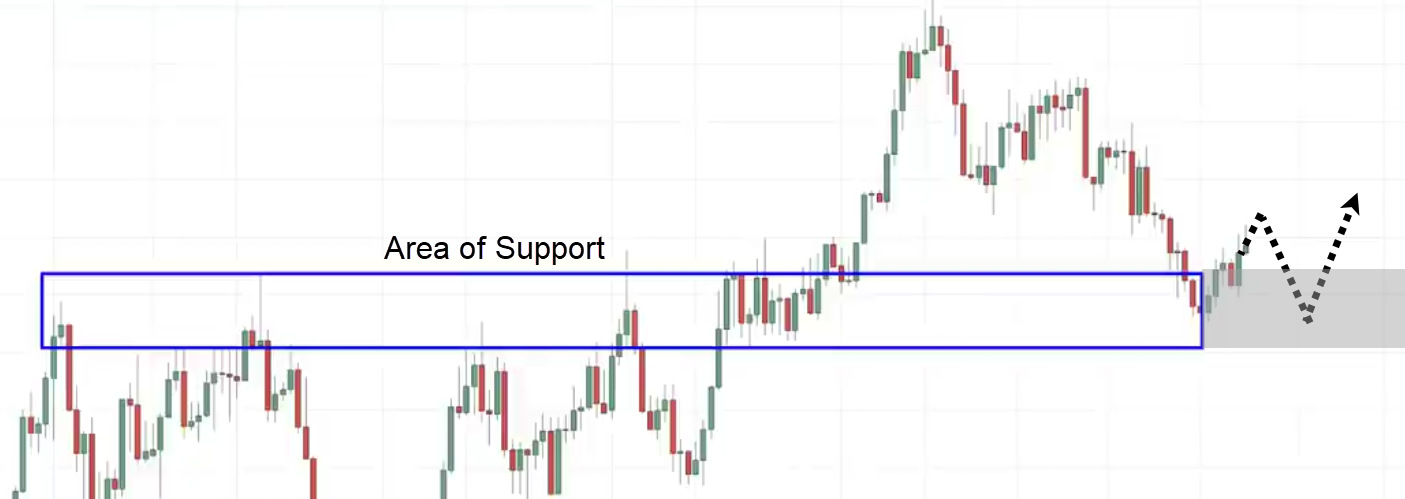
This market respects the 50-period moving average and we use this as an area of value to identify potential trading opportunities.
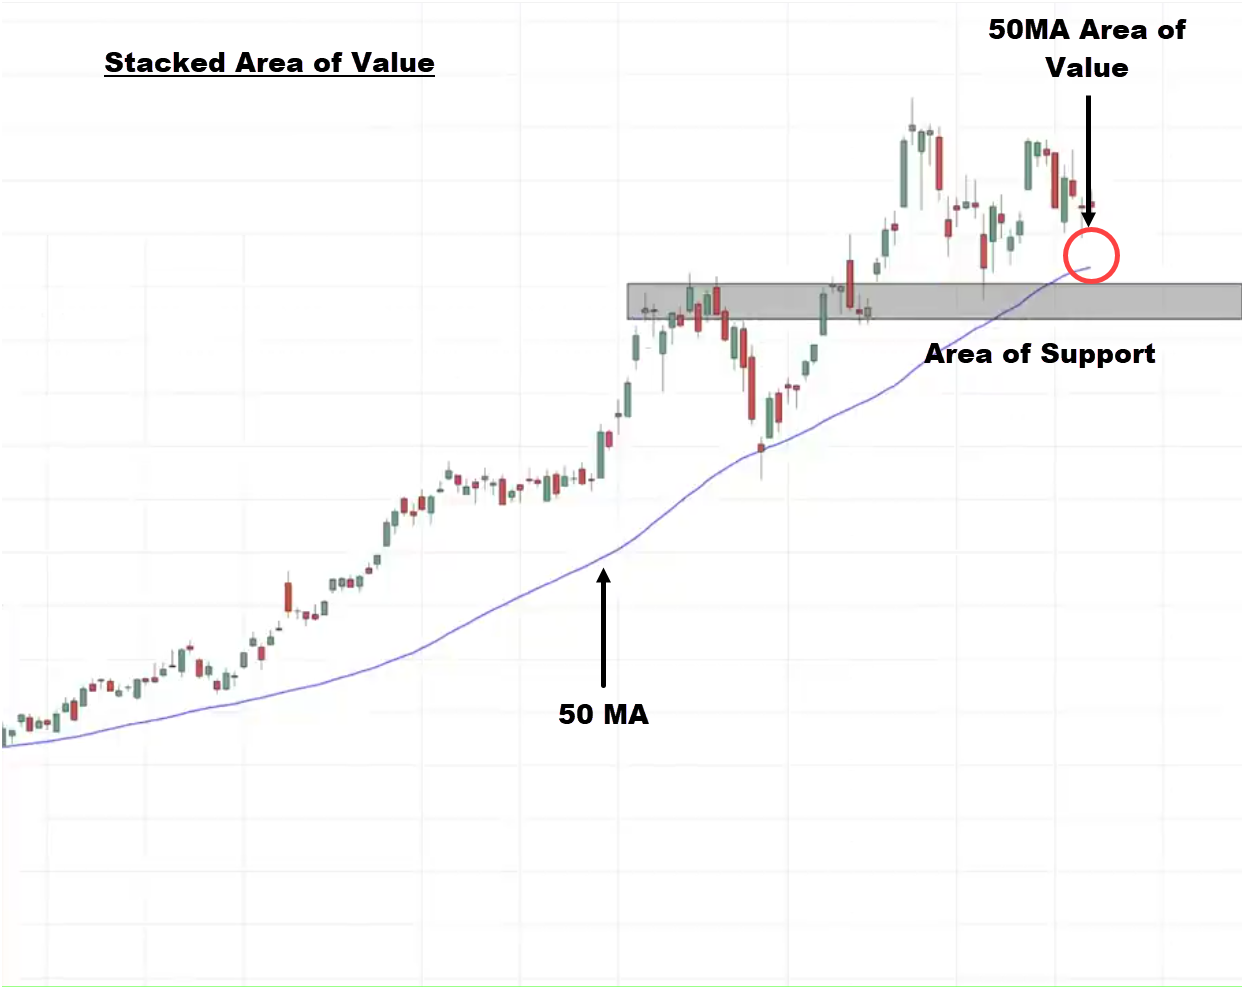
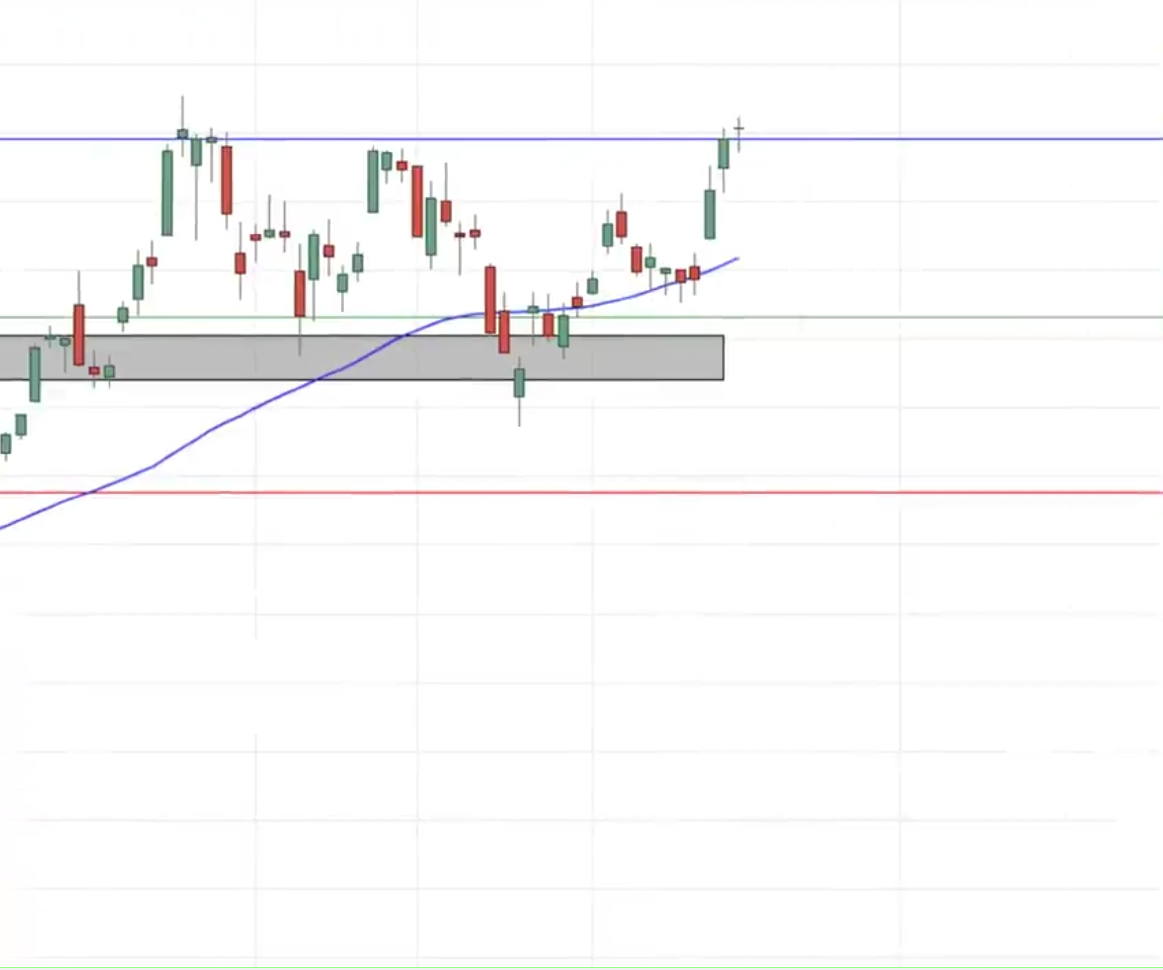
If you look a little bit closer, you’ll notice that this market is also near the area of support at the 50-period moving average.
This is what we call a stacked area of value because you have the 50-period moving average acting as an area of value, and an area of support which is near the 50-period moving average also acting as an area of value so you have two areas of value, which coincide with each other.
This makes the area of value even more powerful.
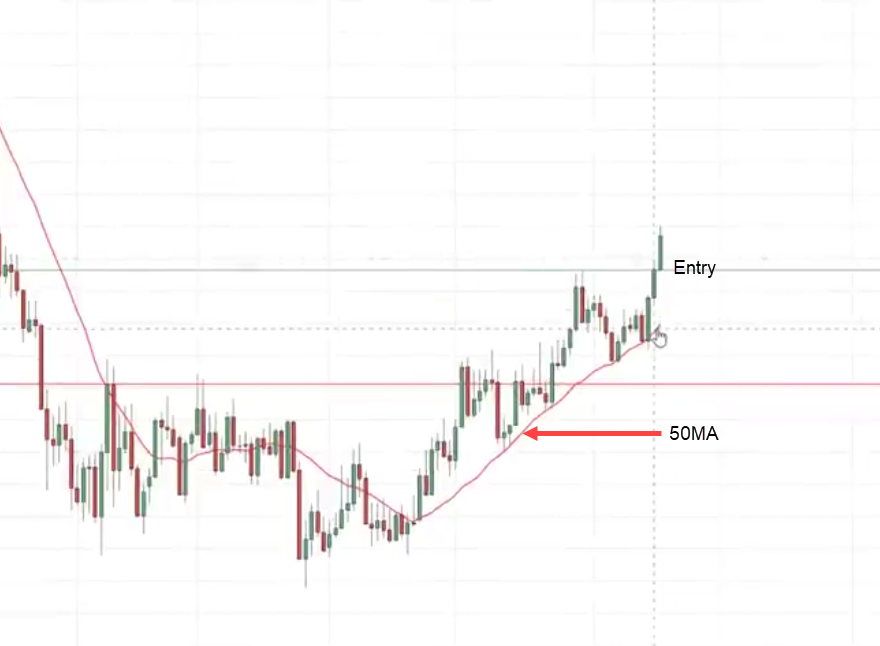
What I’m looking for now is an entry trigger to tell me that buyers are stepping in and about to push the price higher.
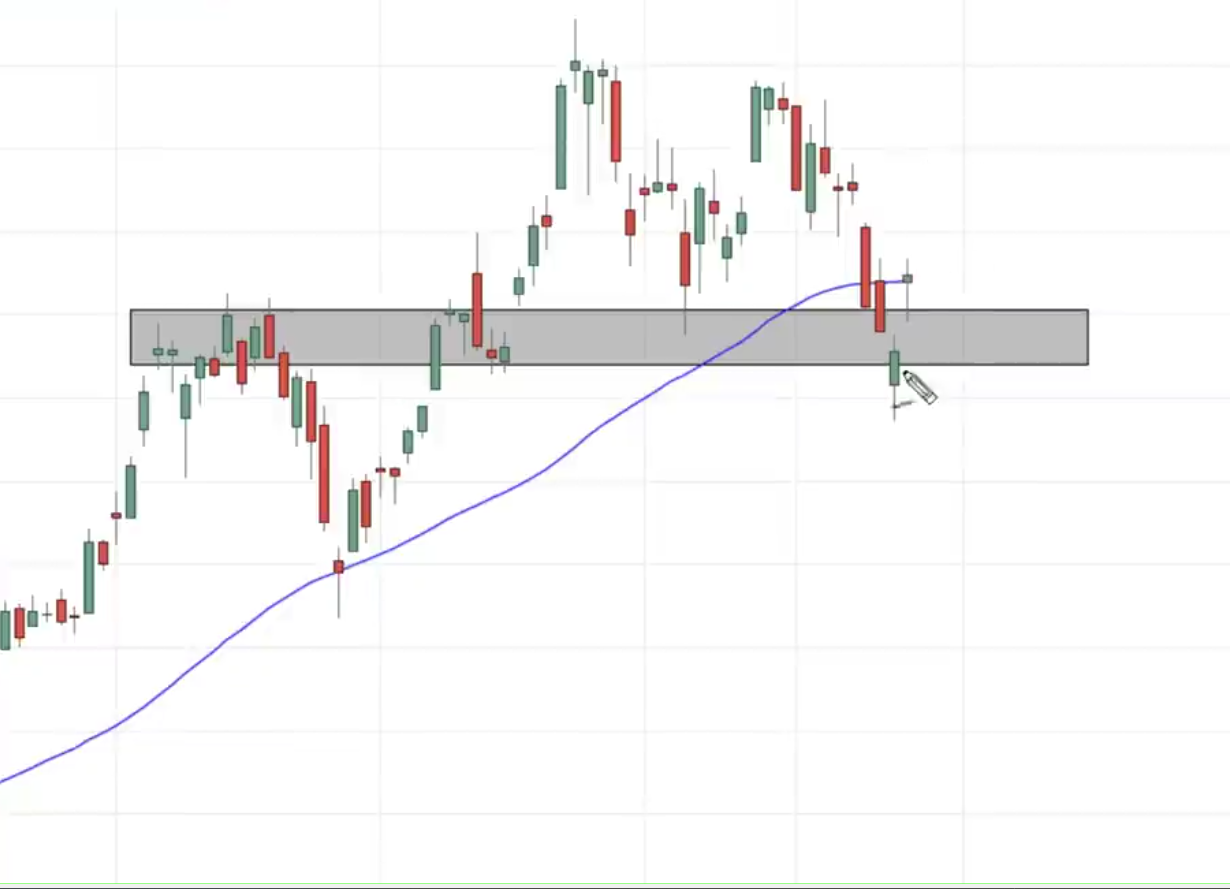
I’m looking for the price to come towards the area of value breaking below the 50 moving average and then quickly get rejected from it closing back above support, something like a false breakout.
Alternatively, you can also look for a bullish reversal candlestick pattern like a hammer showing you a sign of strength that this could be an entry to go long.
I want to see the market have a higher close back about support.
Let’s see what happens next.
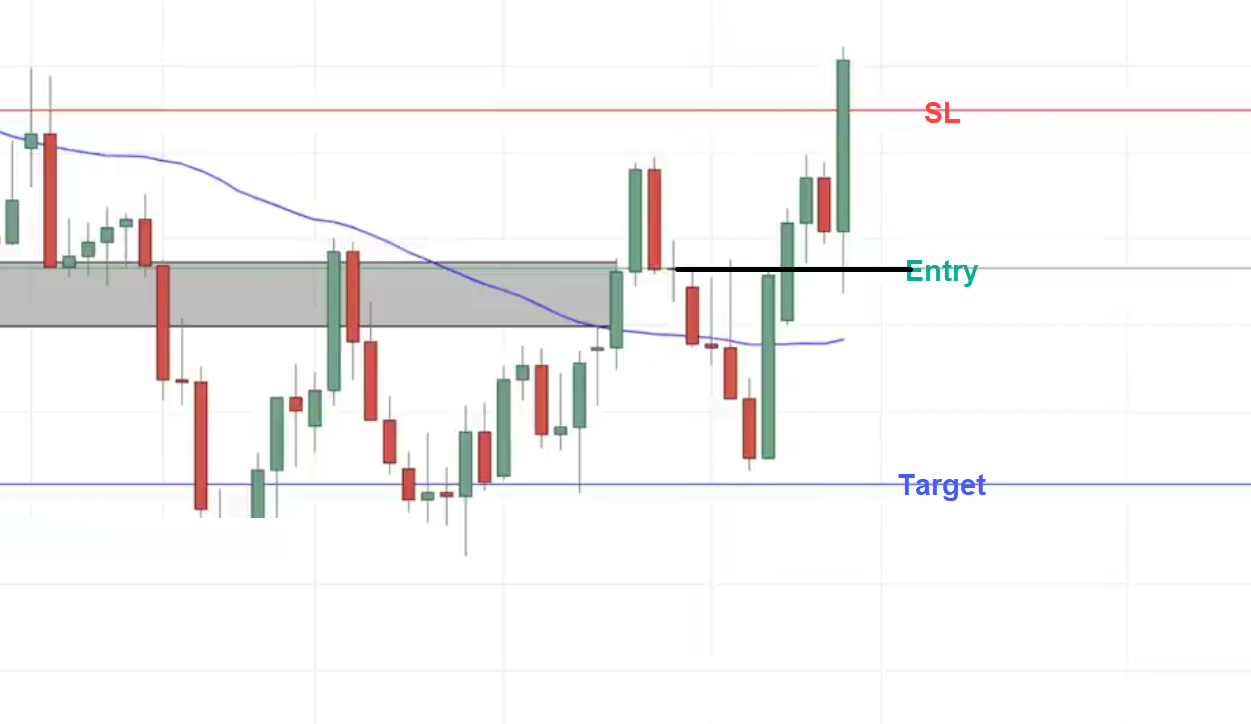
This is what I mean:
You can go long on the next candle open.
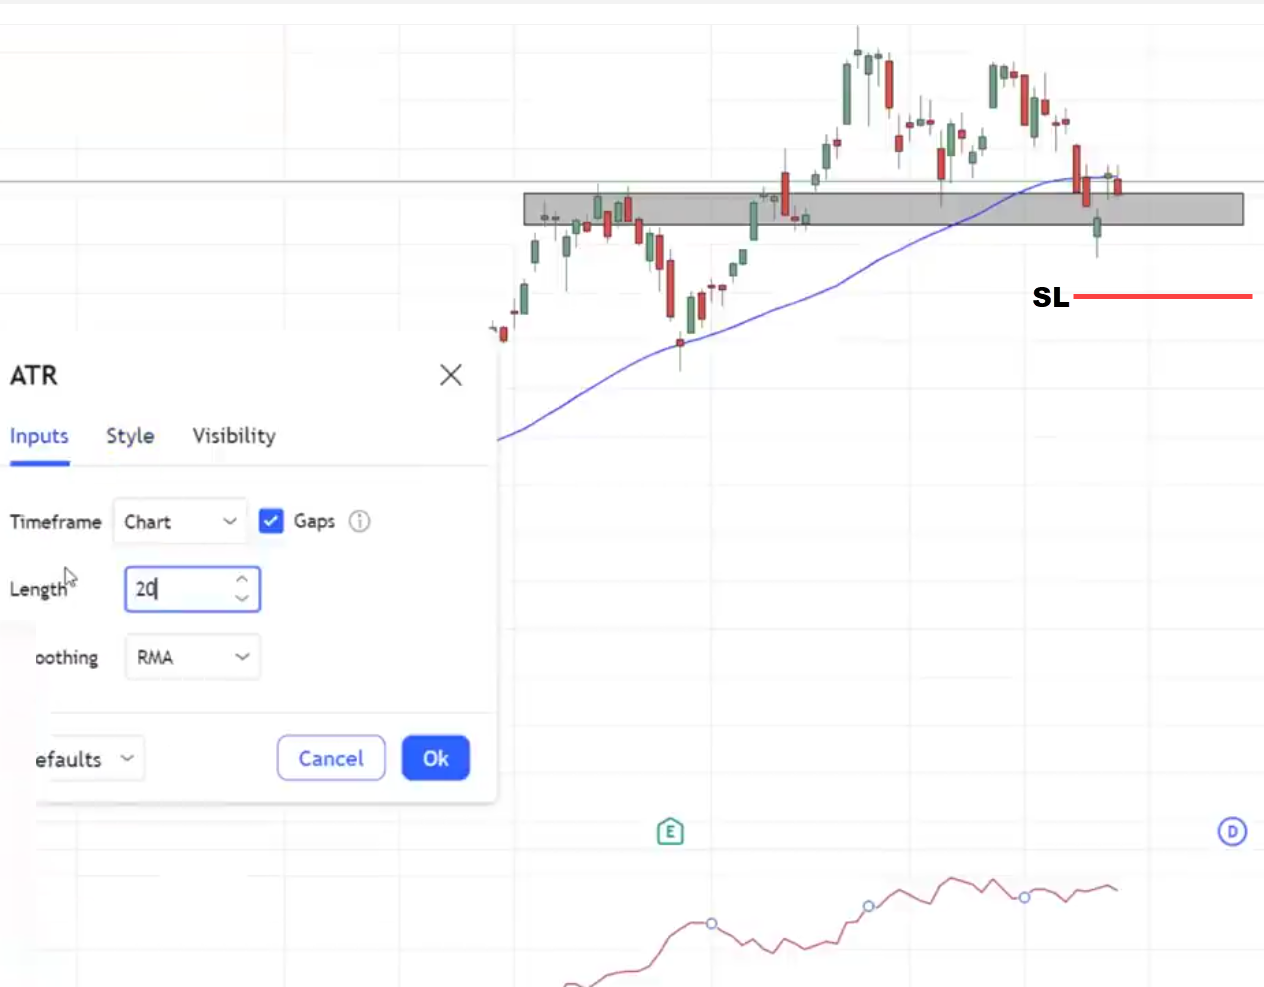
Stop loss would be somewhere a distance below. To make it more objective you can use the 20-period ATR:
What about targets?
You can set your target before the recent swing high.
This is where potential selling pressure could come in and could be resistance.
Just to be conservative to capture one swing. You can just look to take profits before the recent swing high:
As you can see the market eventually reaches our target.
It’s a winning trade.
Next…
Multiple Timeframe Secrets
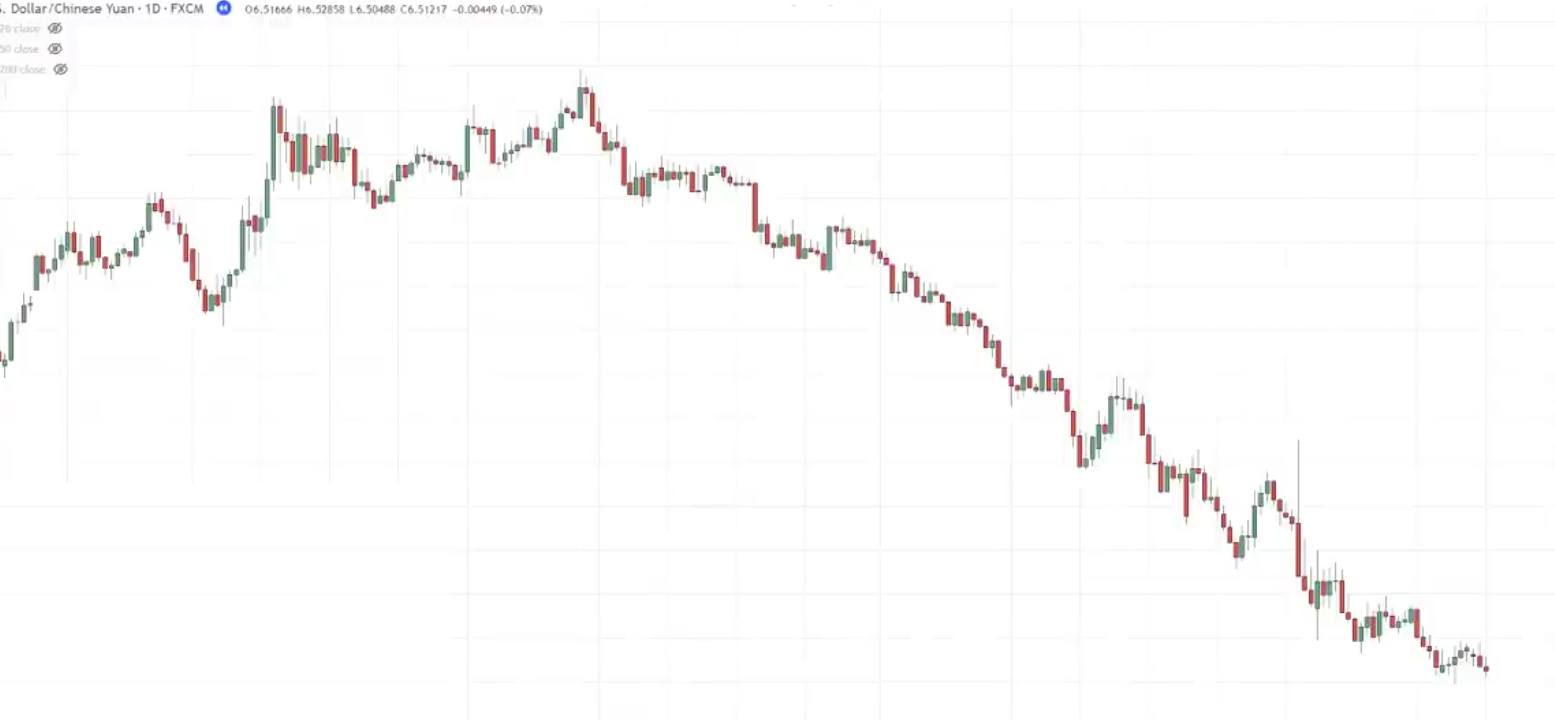
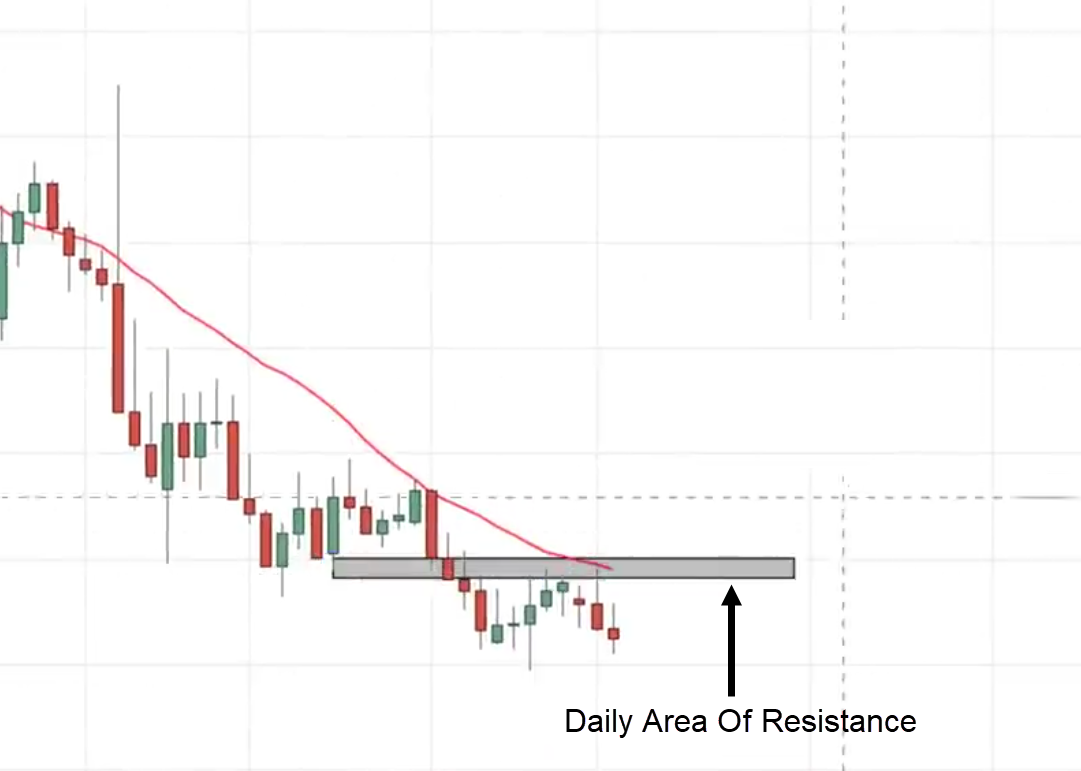
Have a look at this trend over here:
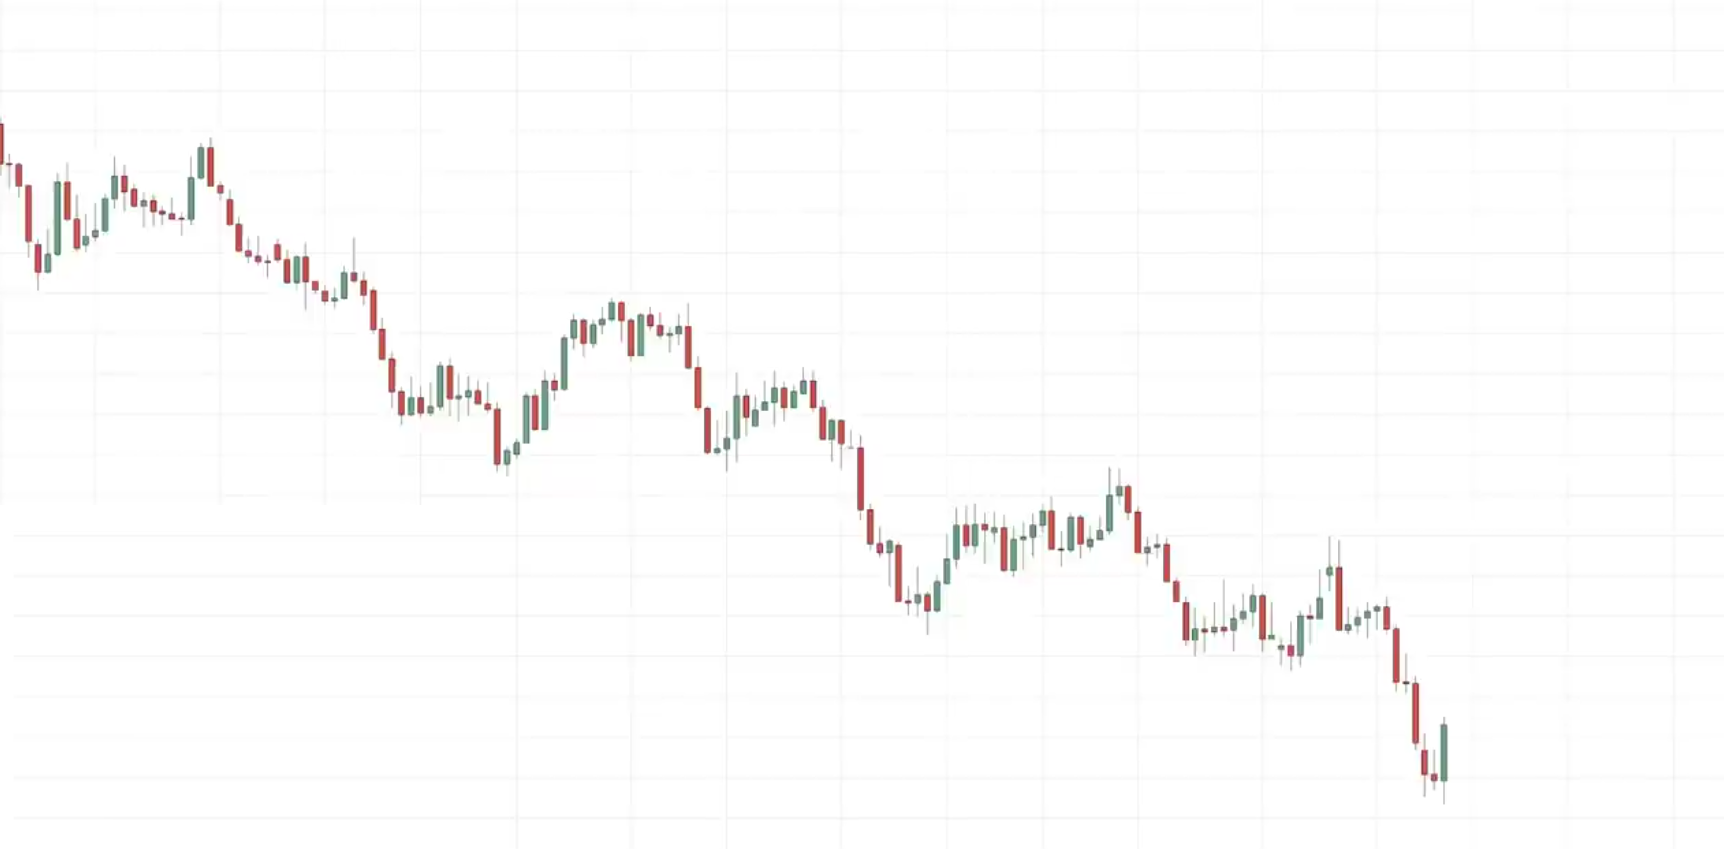
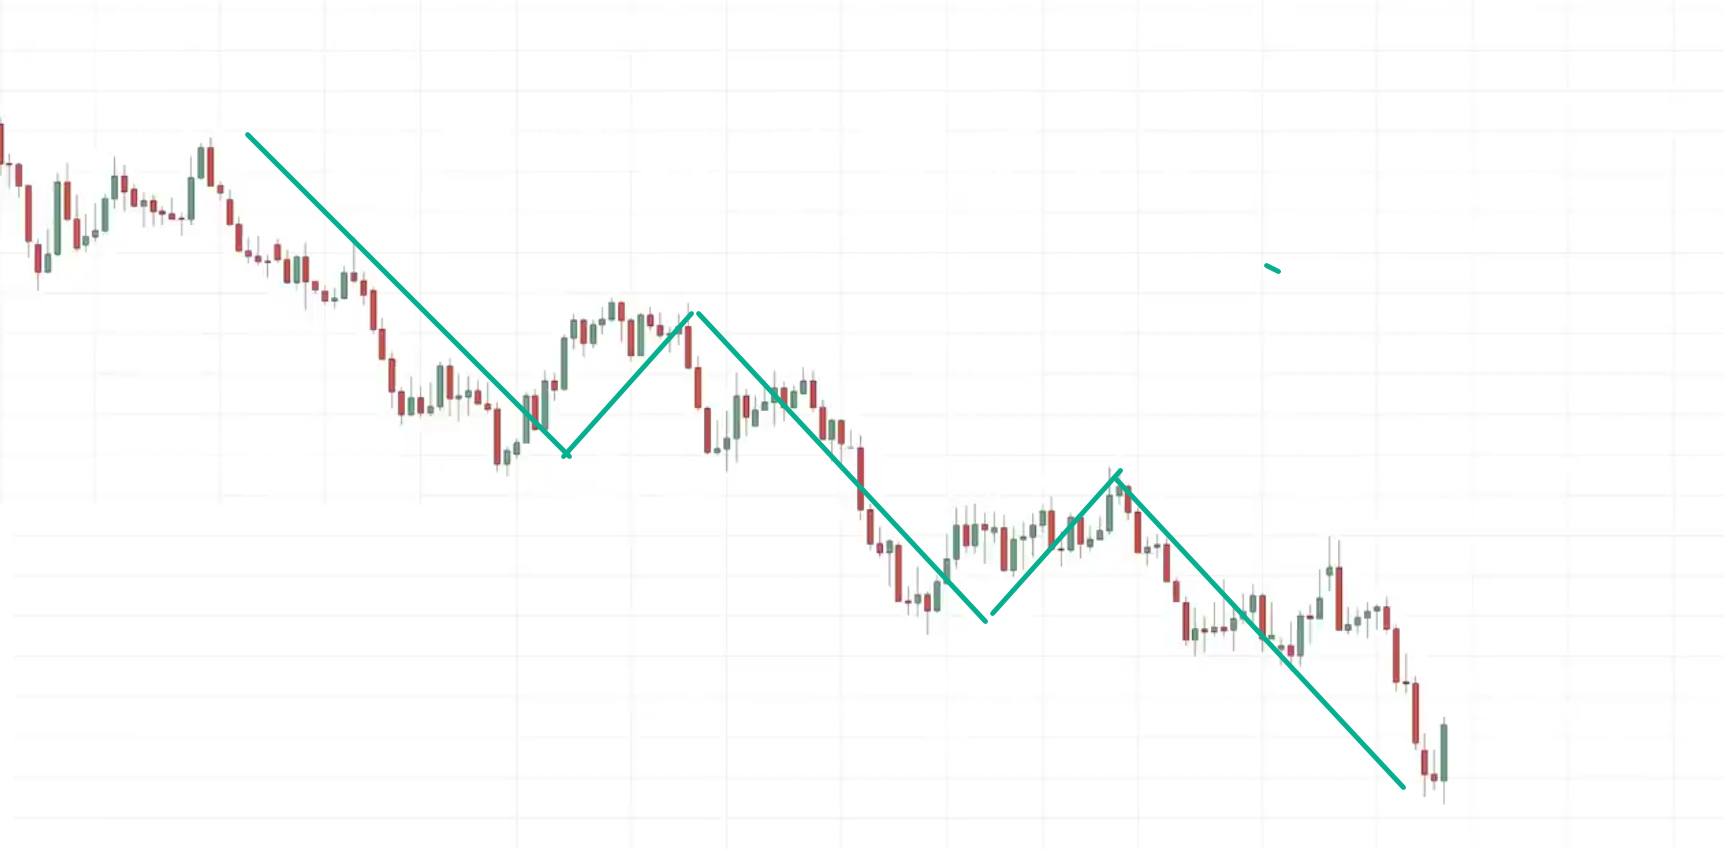
The market is in a downtrend
What type of trend do you think this is?
A strong, healthy, or weak trend?
You can see that the depth of the pullback is relatively shallow.
Based on the look of the chart, the market is likely to be in a strong trend.
That’s where you can use the 20-period moving average to help you identify the area of value.
The market tested the 20 MA several times.
You can see that the market respects the 20-moving average.
When you are trading with a strong trending market, you have to be fast. You will realize how the candle came in towards the 20MA and quickly got rejected.
The market moves very quickly with you grabbing a piece of the move if you are not paying attention.
To slow the pace down, there’s one trick you can use and it is called “The Multiple Time Frame Analysis”
Going down to a lower time frame to time your entry, you realize that you have more time to better time your entry.
The price is testing the 20MA
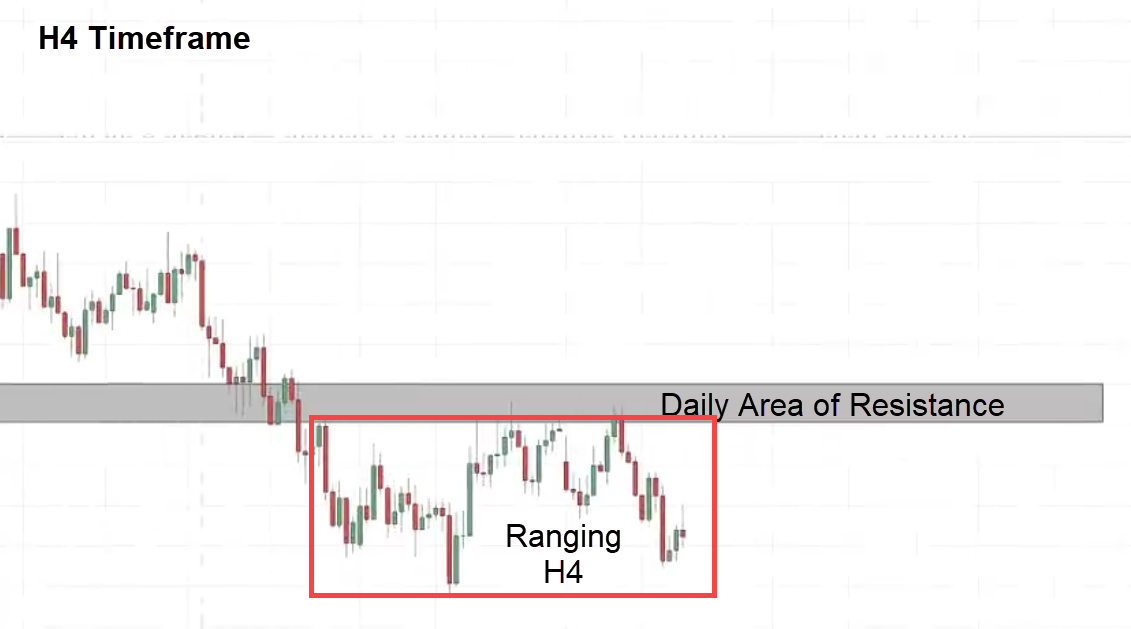
Once I have that, I will go down to a lower time frame like the H4 to see what the market is doing:
The area of resistance is the same area of resistance you saw on the daily time frame.
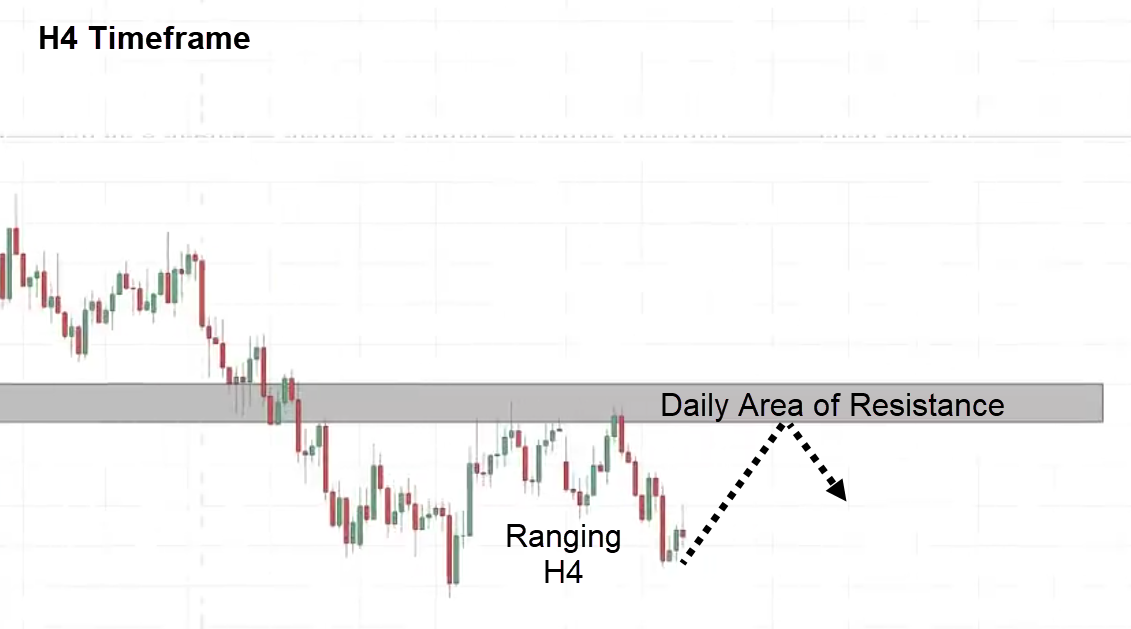
It seems to be ranging in the H4 timeframe.
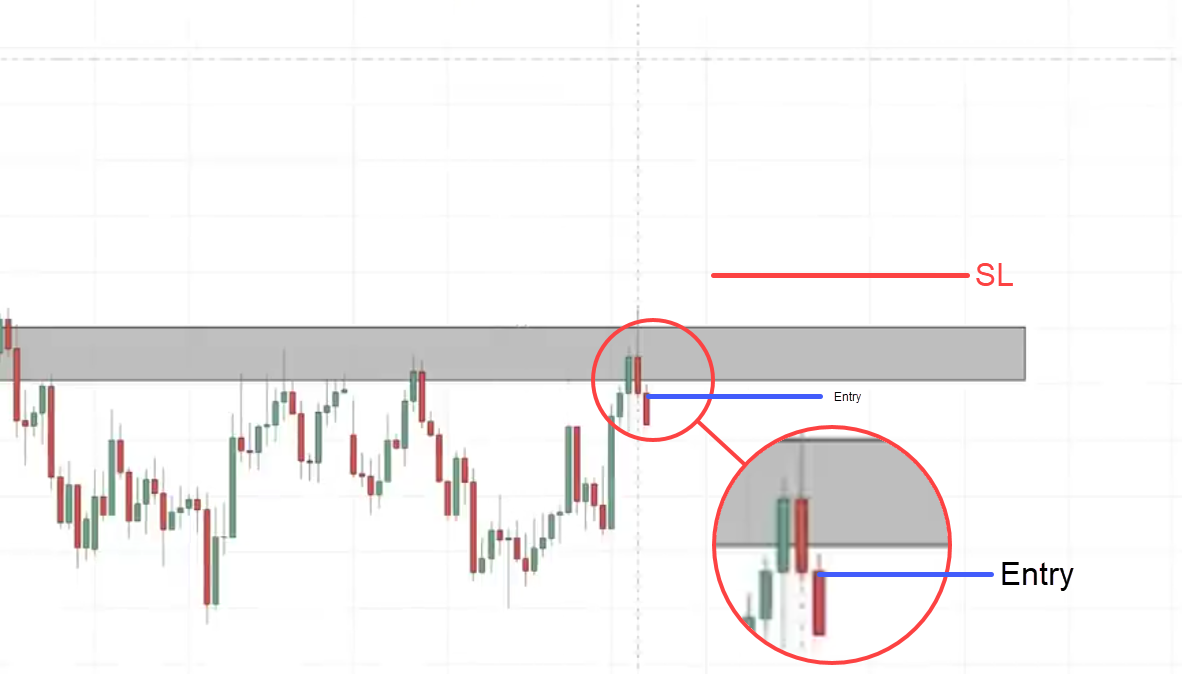
To trade this little mini range, the entry triggers I’m looking for is very straightforward
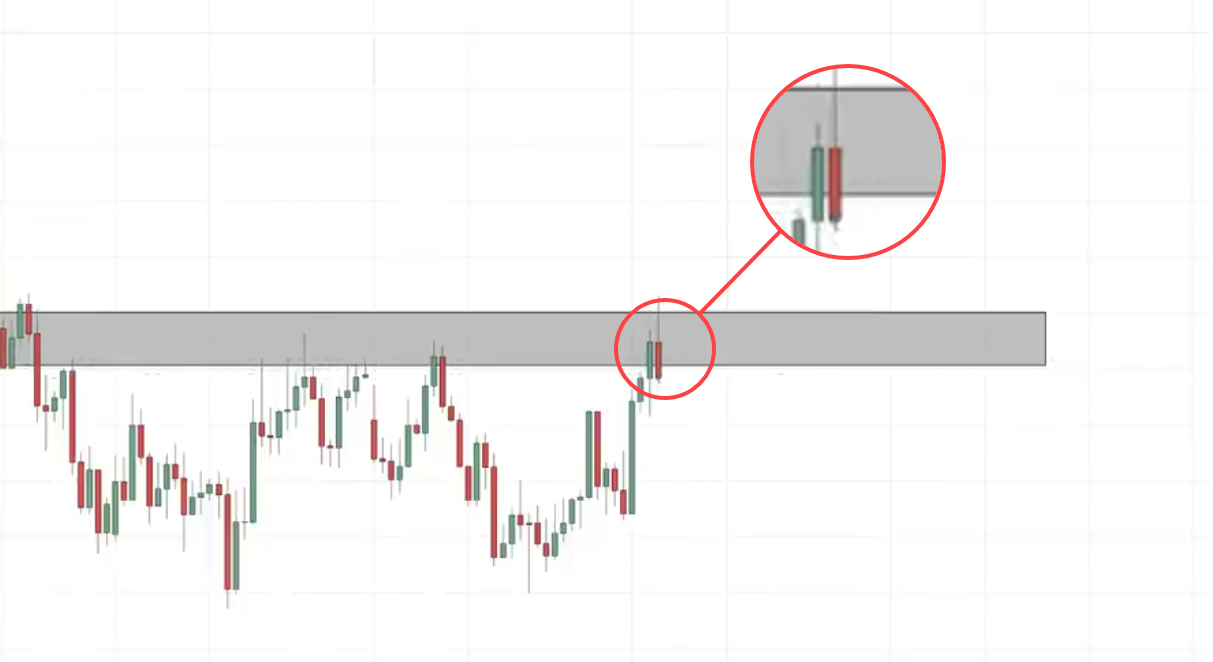
I want to see the price come towards the area of resistance and then get rejected quickly below resistance.
This is what I mean:
This simply tells me that…
“Hey, the market tried to break higher but there’s no buying pressure to push the price higher”
Instead, what you have is selling pressure coming in and that’s why the market closed below resistance.
This is what I’m looking for.
You can get a reversal Candlestick pattern like a shooting star.
That’s another entry trigger that you can use to go short.
Let’s see what happens…
You notice how the candle breaks out nicely and the next candle the market gets rejected and closes near the low.
What does this tell you?
“Hey, the buyers tried to break out higher but couldn’t find the energy to push it higher”
Instead, the sellers came in and pushed the price near the low.
This is a valid entry trigger to go short on the next candle open.
For your stops, I like to set it at 1ATR above the high:
What about Target?
Knowing that the overall market is bearish on the daily timeframe, you can have multiple targets.
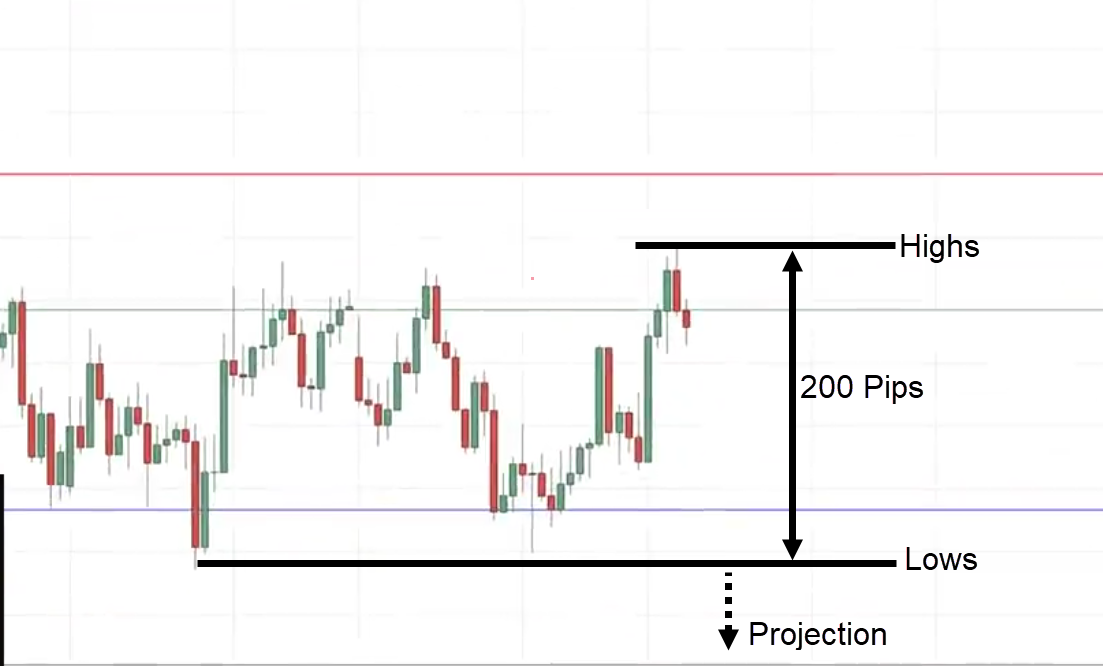
Another technique that you can use to set your second target is what I call a “price projection technique”
What you’re trying to do in essence is to measure the range.
This is what I mean:
From the high to the low.
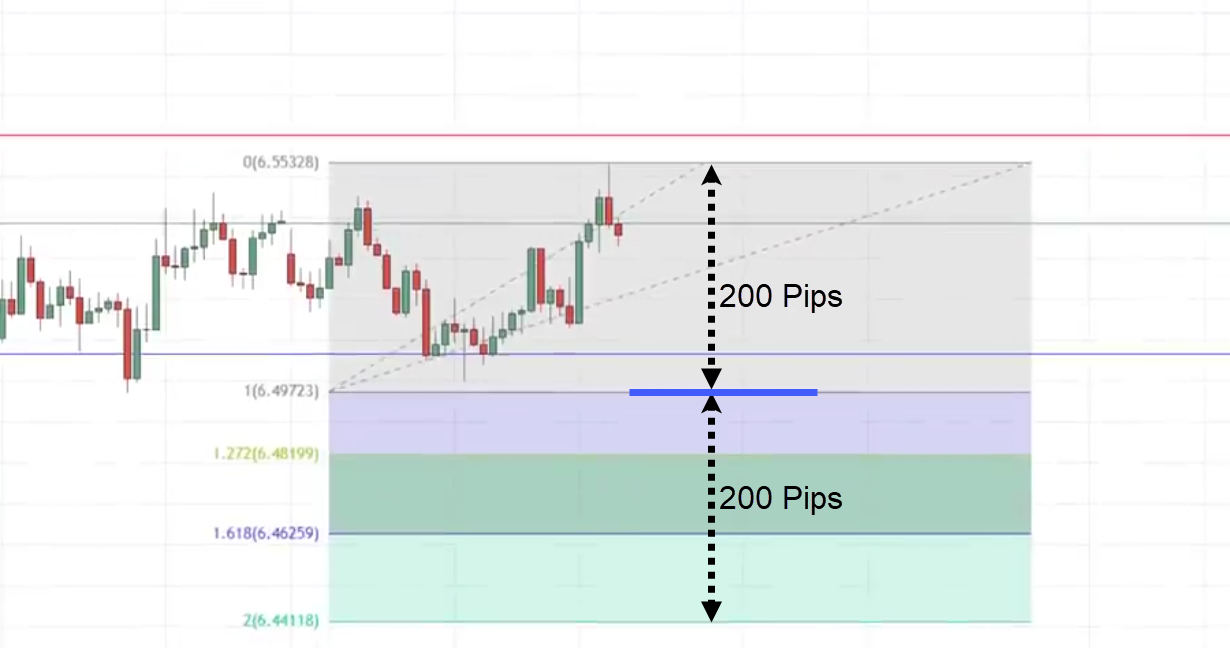
Let’s assume it is 200 pips.
What you want to do is project it lower by another 200 pips.
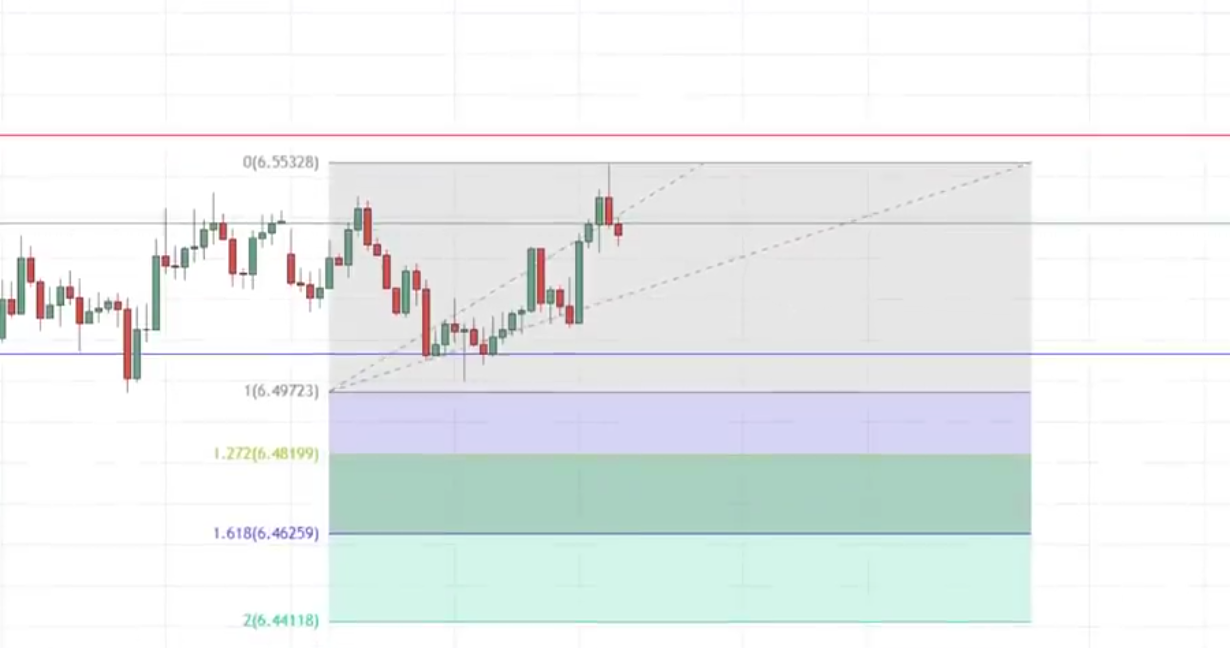
You can use tools like the “Trend Based Extension”
We are paying attention to 2.0 in the indicator.
It projects down the same 200 pips lower for our second target.
For my second target, I’ll just put it slightly above 6.44
Let’s see what happens next…
In this case, you can see that the market went a little bit against me and started to move in my direction.
Finally, we reached our second target.
This is a winning trade.
The First Pullback Strategy
Let me walk you through the next trading strategy using the moving average.
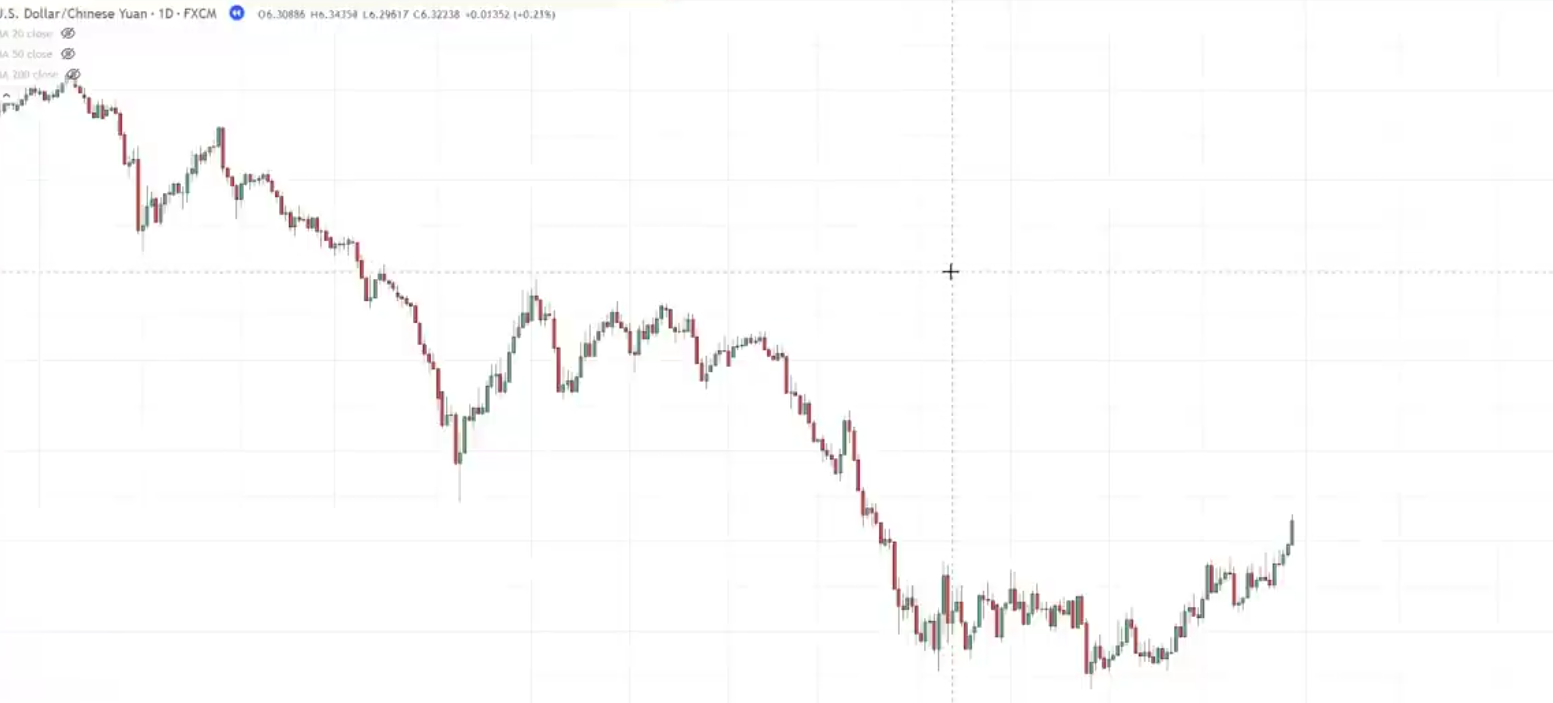
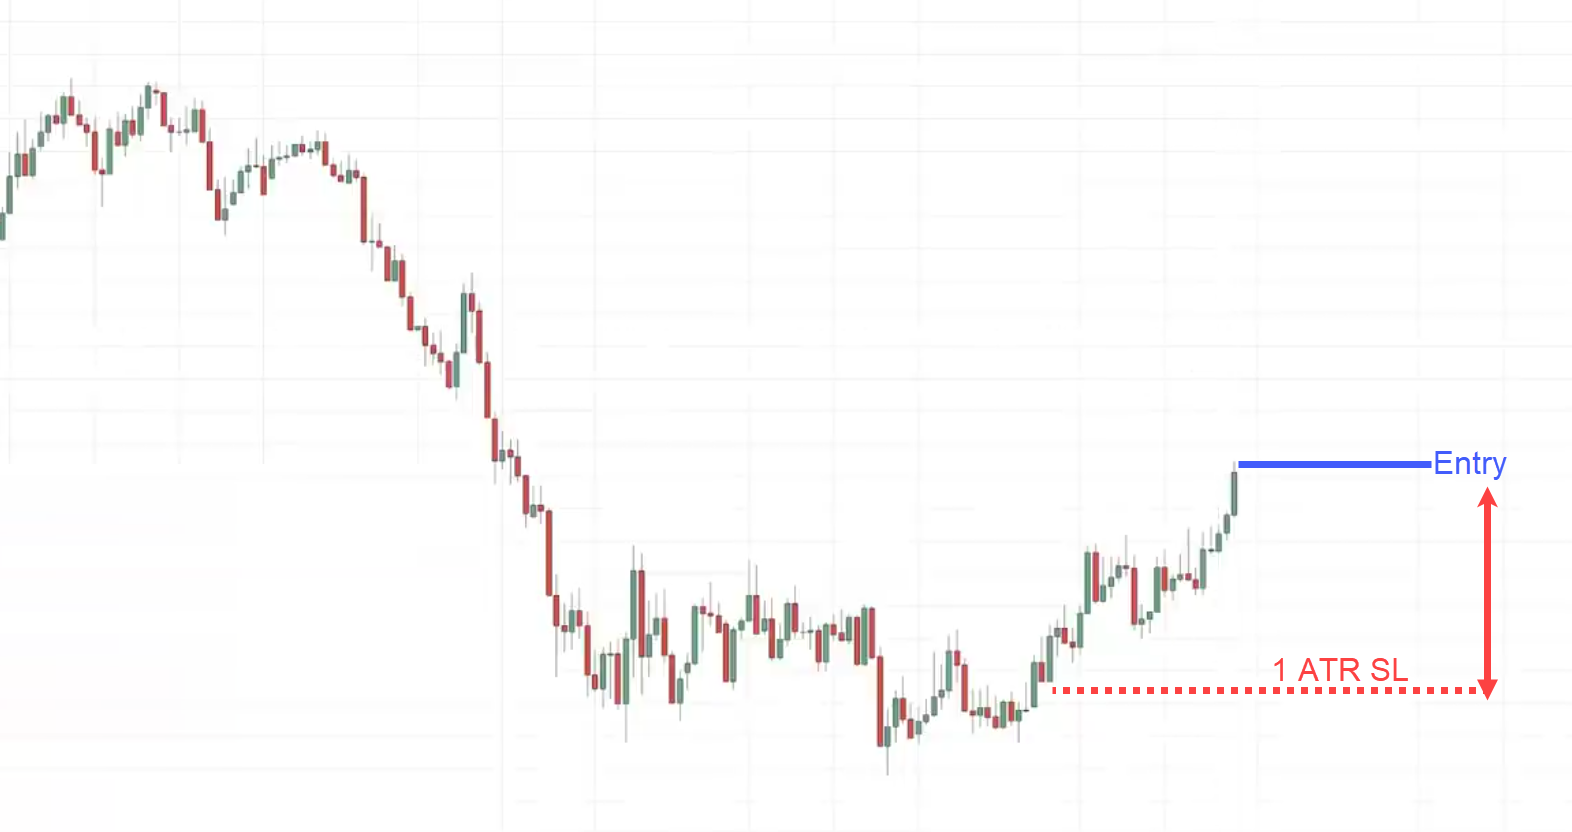
Previously the market was in a downtrend.
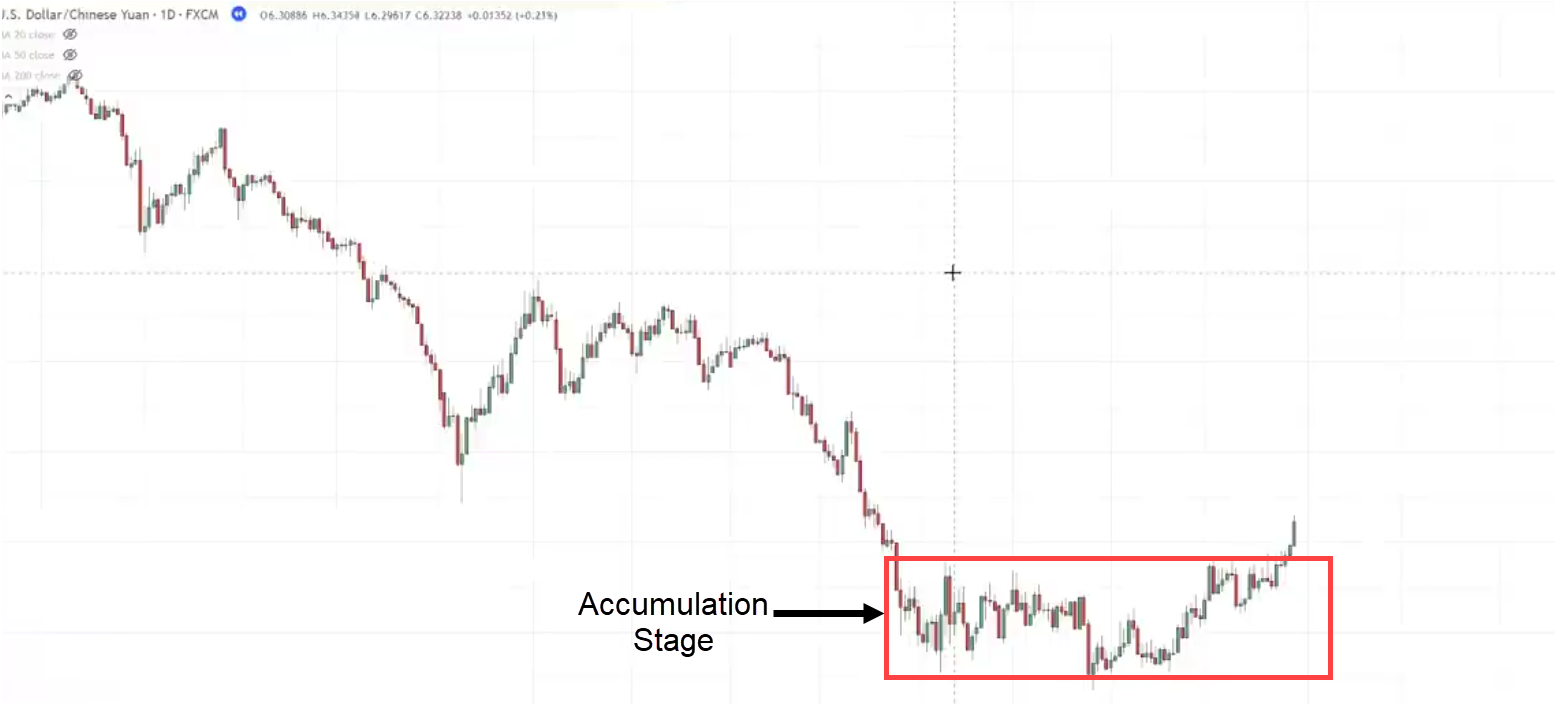
The price made a series of lower lows and lower highs and then recently it broke out of this accumulation stage:
Notice how the market got into a range.
Many traders thought the range would break lower.
But guess what it did, it broke out higher.
This breakout could potentially be the start of a new uptrend.
How can you get a low-risk entry to start this new trend?
The moving average can help you.
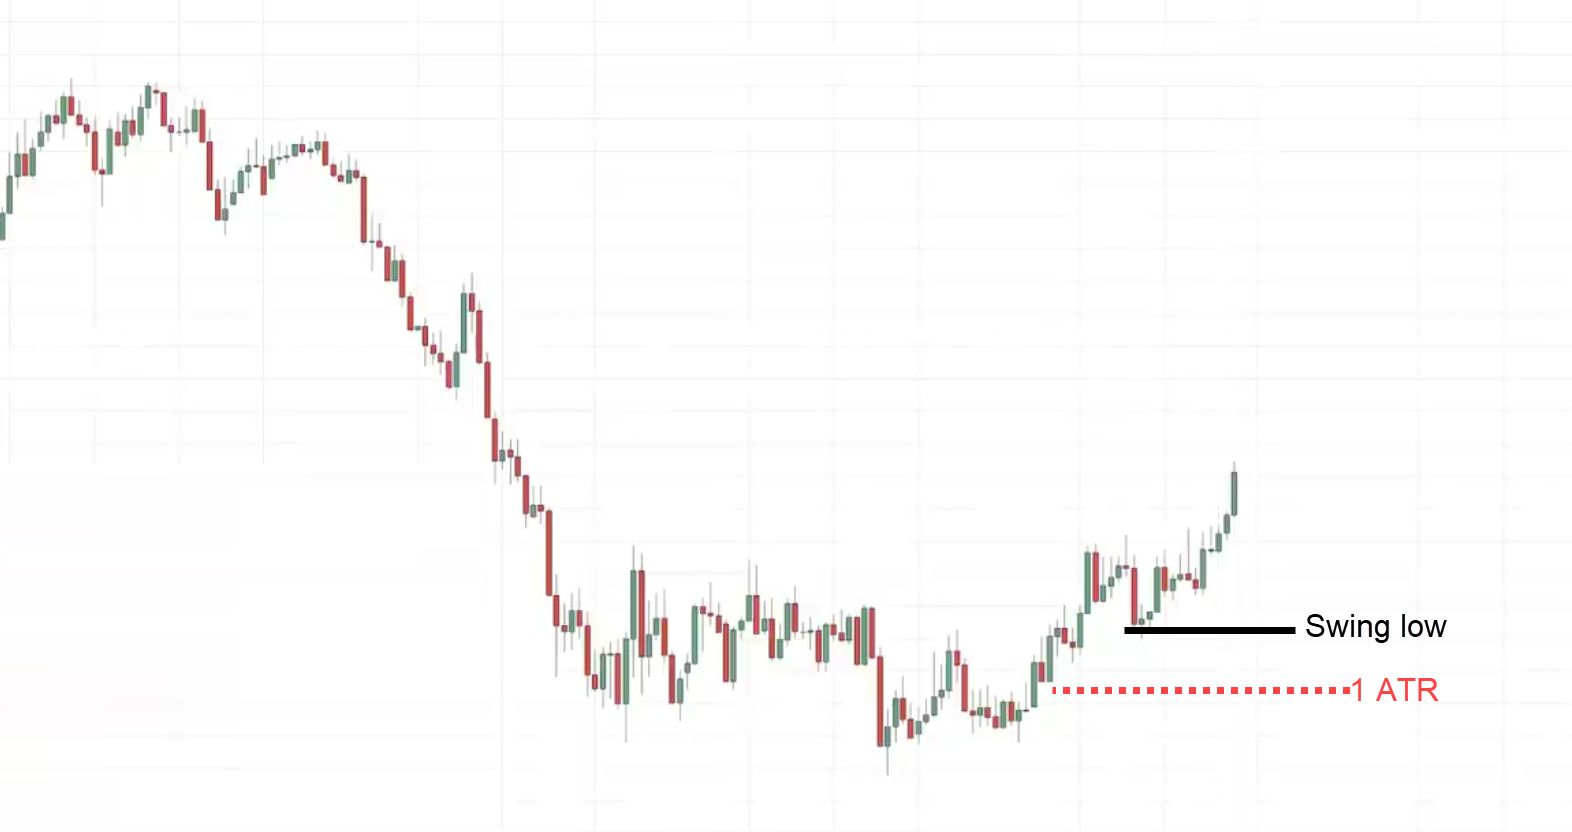
At this point, I won’t recommend buying yet because there’s no logical place to set your stop loss.
If you want to set your stop loss, I would say the nearest logical one is to reference this swing low.
Your stop loss 1 ATR somewhere here:
From your entry point to your stop loss, you can see that it’s a very wide stop loss.
If your stop loss is so wide this means that the market has to move much in your favor just to allow you to earn 1R on your trade.
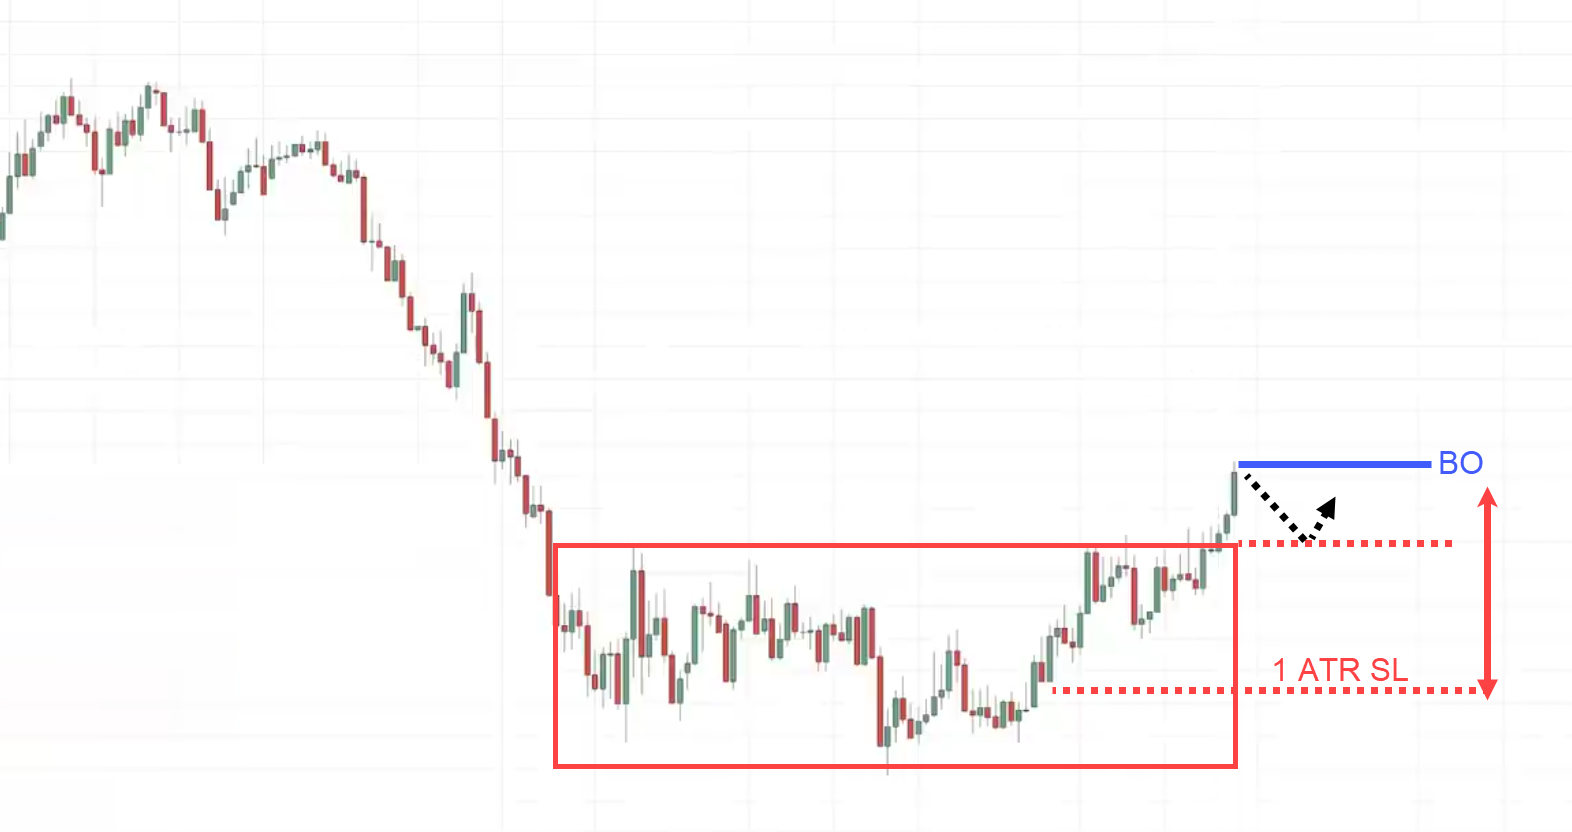
What you can do instead is what I call the “first pullback”
Why is it called the first pullback?
You can see that over here is the breakout point. This is what I mean:
If it does make a pullback, this is the first pullback after the breakout.
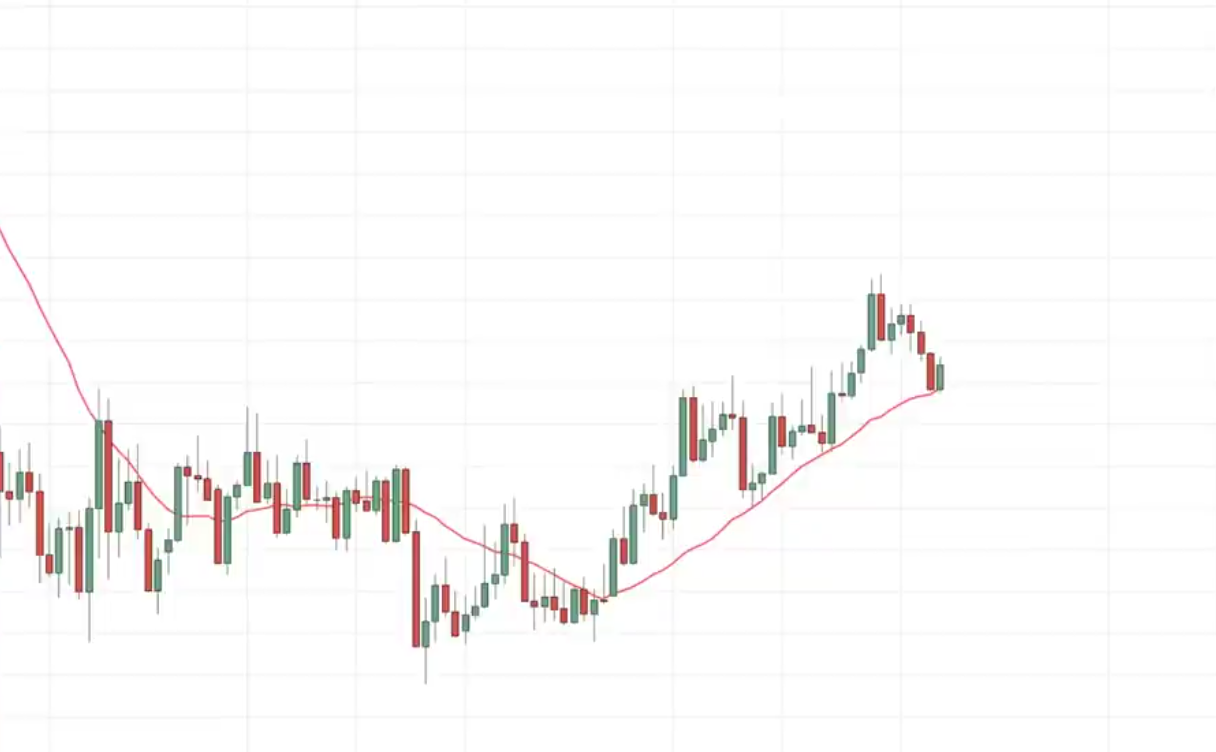
In this case, I like to overlay with the 20-period moving average.
You want the price to retest the 20MA.
Why is that?
Because as it touched the 20 MA this means the pullback has occurred.
Giving it enough time to gather strength to take the wave higher.
In this case, the price has now retested the 20MA.
This is what I mean:
You can go down to a lower time frame like the H4 timeframe.
Over here you have a price rejection.
This is the previous resistance that became support.
What I’ll look for is on this time frame if it happens is that…
I look for a bounce up here and look for another retest down low of these lows
Then get rejected and close back up of this area of support
This could be something in the form of a hammer.
When this happens, I’ll be looking to enter on the next candle open.
You can use a buy-stop order above the recent swing high for an entry.
My stops will go a distance below the lows.
A possible target could be just before the recent swing high as your first target.
I like to go with a trailing stop.
Why is that?
As I’ve shared earlier, you can see that this market previously was in the downtrend.
Then we have this accumulation stage, and the price breaks out of it, making a pullback.
If it breaks up higher and if the trend continues up higher, you don’t want to have just a 1:1 risk to reward on the trade because you’re going to be leaving a lot on the table.
How can you go about trailing or stop-loss?
There are numerous techniques, you can use a moving average or price structure.
I’ll briefly walk you through both techniques…
Moving Average
It’s very simple for the moving average.
Let’s assume we use the 50MA to trail your stop loss.
If your entry gets triggered.
You can then overlay with the 50-period moving average to trail your stop loss.
You only exit the trade if the price closes below the 50-period moving average
Price Structure:
This is another method you can use.
You can continue to hold the trade until the market makes a series of lower lows and lower highs then you exit.
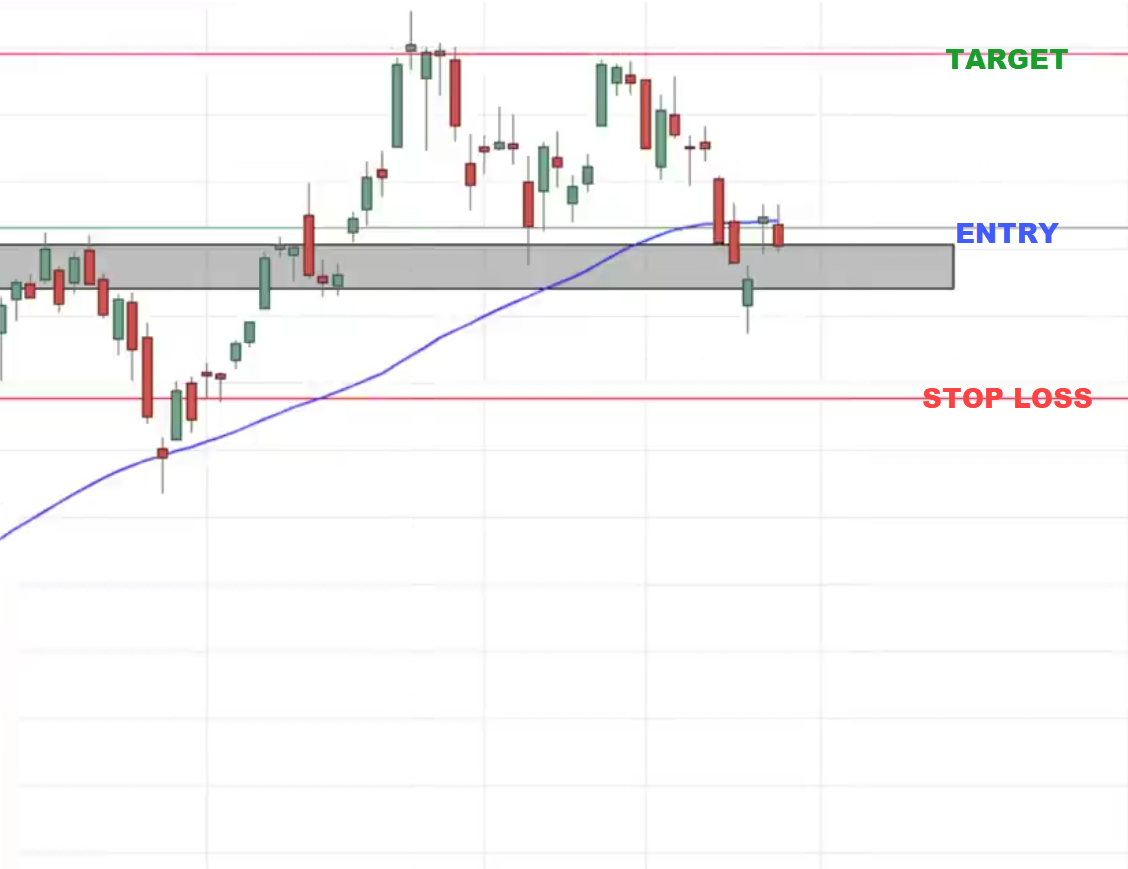
The Ouch Trade
Is this a strong, healthy, or weak trend?
This seems to be more of a healthy trend looking at the depth of the pullback.
Usually, when I see this type of price action on the chart, I overlay it with the 50MA to see whether the market respects it.
The market tested the 50 MA severally.
You can see that the game plan is possibly coming up in your head like…
“This could happen. Let me pay attention to that area of value and look for a valid entry trigger to go short”.
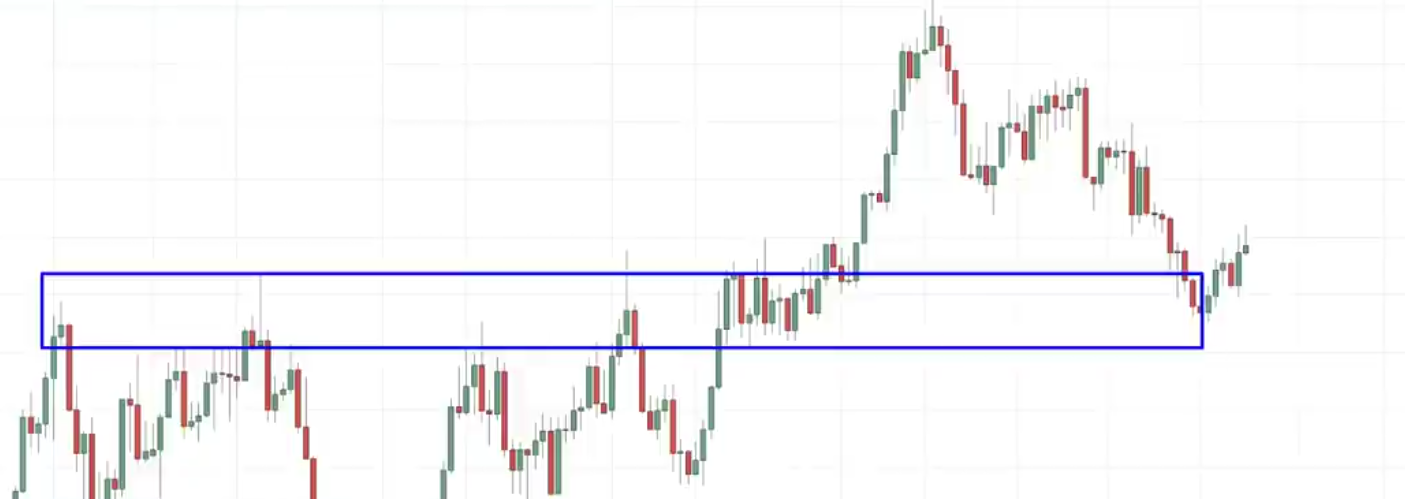
You will notice this is an area of value where previous support could become resistance.
You have a confluence of the 50MA. This is what I call “a stacked area of value”
Because your 50MA coincides with this area of resistance.
In this case, I’m looking for an entry trigger to go short.
This could be something like a shooting star pattern where the price comes up higher then quickly gets rejected and closes back below this area of resistance.
Let’s see what happens next…
I have this red candle.
I think those of you who are familiar with candlestick patterns know what we call a dark cloud cover.
You can see that this candle is bullish but the next candle has sellers that begin and push the price down closing near the lows of a day.
Traders could use this as an entry trigger to go short but to be honest, I prefer a stronger bearish reversal Candlestick pattern.
Let’s say I didn’t go with that trigger.
I’ll skip this one.
Let’s see what happens.
I prefer this as an entry trigger
My reasons.
- The market took out these highs and then quickly reversed down.
You can see that the selling pressure is stronger in this sense.
Another thing to point out before I talk about the entry is that notice the market breaks above the 50-period moving average by quite a little bit and then starts to hit down.
This is normal in the real world of trading.
Where the price comes to the moving average touches it and bounces away, sometimes it could come towards the moving average, break below it, and then give you a false break.
You have to be prepared for this scenario.
In this case, the price breaks out of the moving average then it starts to show signs of reversal again.
I’ll look to enter again on the next candle open.
This is where I look to go short.
Remember Rayner says…
“Follow the plan”
Don’t have itchy fingers.
If you have an inconsistent set of actions, you will get inconsistent results.
We stick to the plan and don’t move your target of stop loss.
Seeing our profits become losses.
In this case, the market shows a sign of reversal and boom! We get stopped out of the trade.
Guess what?
You did well if you were stopped from this trade because you followed the plan.
The reason why I’m sharing with you this losing trade is because losers will happen from time to time.
It could be often as well when you encounter a series of losing trades.
This is just to bring you back to the reality of things.
Whatever I share with you is not the holy grail. You are not going to have a 100% winning rate.
But hopefully in the long run, when you trade with an edge, you can become a consistently profitable trader.
I hope this moving average tool that I’ve shared with you today can help you do that.
Conclusion
The moving average is one of the most popular indicators out there.
It’s probably the first one you’ve learned!
However, learning how it works is different from learning how to use it in trading.
Nonetheless, here’s what you’ve learned today…
- A moving average works by basically averaging the values of all the candles that closed on your chosen period
- One major way to identify if the trend is intact is when the market is constantly producing swing highs and lows
- Moving averages drastically helps you find areas of value in a trending market by waiting for a 2nd or 3rd test
- The best moving average depends on what type of trends you wish to capture (healthy, weak, or strong trends?)
There you go!
This trading guide’s pretty jam-packed, right?
But now it’s your turn.
How do you use the moving average?
Any experience you want to share with regards to moving average?
Let me know in the comments below!


Hi there. Please tell me how ca I get the stuffs printed
As of now, It is not readily at printable state.
Feel free to explore Rayner’s blogs for more learnings!