Mean reversion trading is a strategy that buys when an asset price is low, and then sell it on the next “bounce” higher.
Here’s what I mean:
Now, this trading strategy can be applied to other markets but for this post, I’ll focus only on the stock market.
Next, you might be wondering:
“Why does mean reversion trading work?”
If you look at most stock markets, you’ll notice it’s in a long-term uptrend.
Yes, we have recessions and bear markets along the way but, in the grand scheme of things, the stock market is making a series of higher highs and lows.
Why?
Because the stock market is a reflection of the economy.
If you compare where we are now to 50 years ago, things have drastically improved (like better living standards, increased productivity, etc.).
In other words, if the economy is in a long-term uptrend, the stock market will reflect it.
So now the question is:
How do you profit from this phenomenon?
Read on…
Mean reversion trading strategy (the rules)
Quick recap:
The idea behind mean reversion trading is to identify stock markets in an uptrend, buy the pullback, and sell the rally.
Simple right?
Now, let’s transform this idea into concrete rules which you can use to trade the markets.
Here’s goes…
(Note: I didn’t come up with this trading strategy on my own. I learned it through the works of Larry Connors and Cesar Alvarez.)
Rules:
- The market is above the 200-day moving average
- 10-period RSI is below 30
- Buy on the next day’s open
- Exit when the 10-period RSI crosses above 40 (or after 10 trading days)
Market traded:
- S&P 500 ETF (SPY)
Timeframe:
- Daily
Let me explain…
#1: The market is above the 200-day moving average
Now, even though the stock market is in a long-term uptrend, there are times when it’s in a bear market (or a recession).
In other words, we only want to be buying when times are “good” and stay on the sidelines during bear market conditions.
But how do we define “good times”?
Well, we can use the 200-day moving average as a trend filter.
If the price is above it, then we’ll conclude the market is in an uptrend.
If the price is below, then it’s a bear market and we’ll remain in cash.
#2: 10-period RSI is below 30
Next, we need to define the depth of the pullback and we can use the RSI (relative strength index) for it.
Here’s how…
When the 10-period RSI is below 30, it means there’s strong bearish momentum (over the last 10 days).
But as you know, in the long run, the stock market is in an uptrend.
So by waiting for the 10-period RSI to be below 30, we can enter our trade at a “cheap price” and profit on the next upswing.
#3: Buy on the next day’s open
Here’s the thing:
If you want to know whether the RSI indicator has closed below 30, you’ll have to wait for the market to close.
This means the earliest time you can enter a trade is on the next day’s open—which is what we’re doing here.
#4: Exit when the 10-period RSI crosses above 40 (or after 10 trading days)
The idea behind this mean reversion trading is to capture “one move” in the market, and that’s it.
To define the “one move”, we can also use the 10-period RSI for it.
What we’re looking for is, for the 10-period RSI to cross above 40 which happens only after the market rallies higher.
Now…
Let’s have a look at a few examples so you can see how this mean reversion trading strategy works.
Example 1
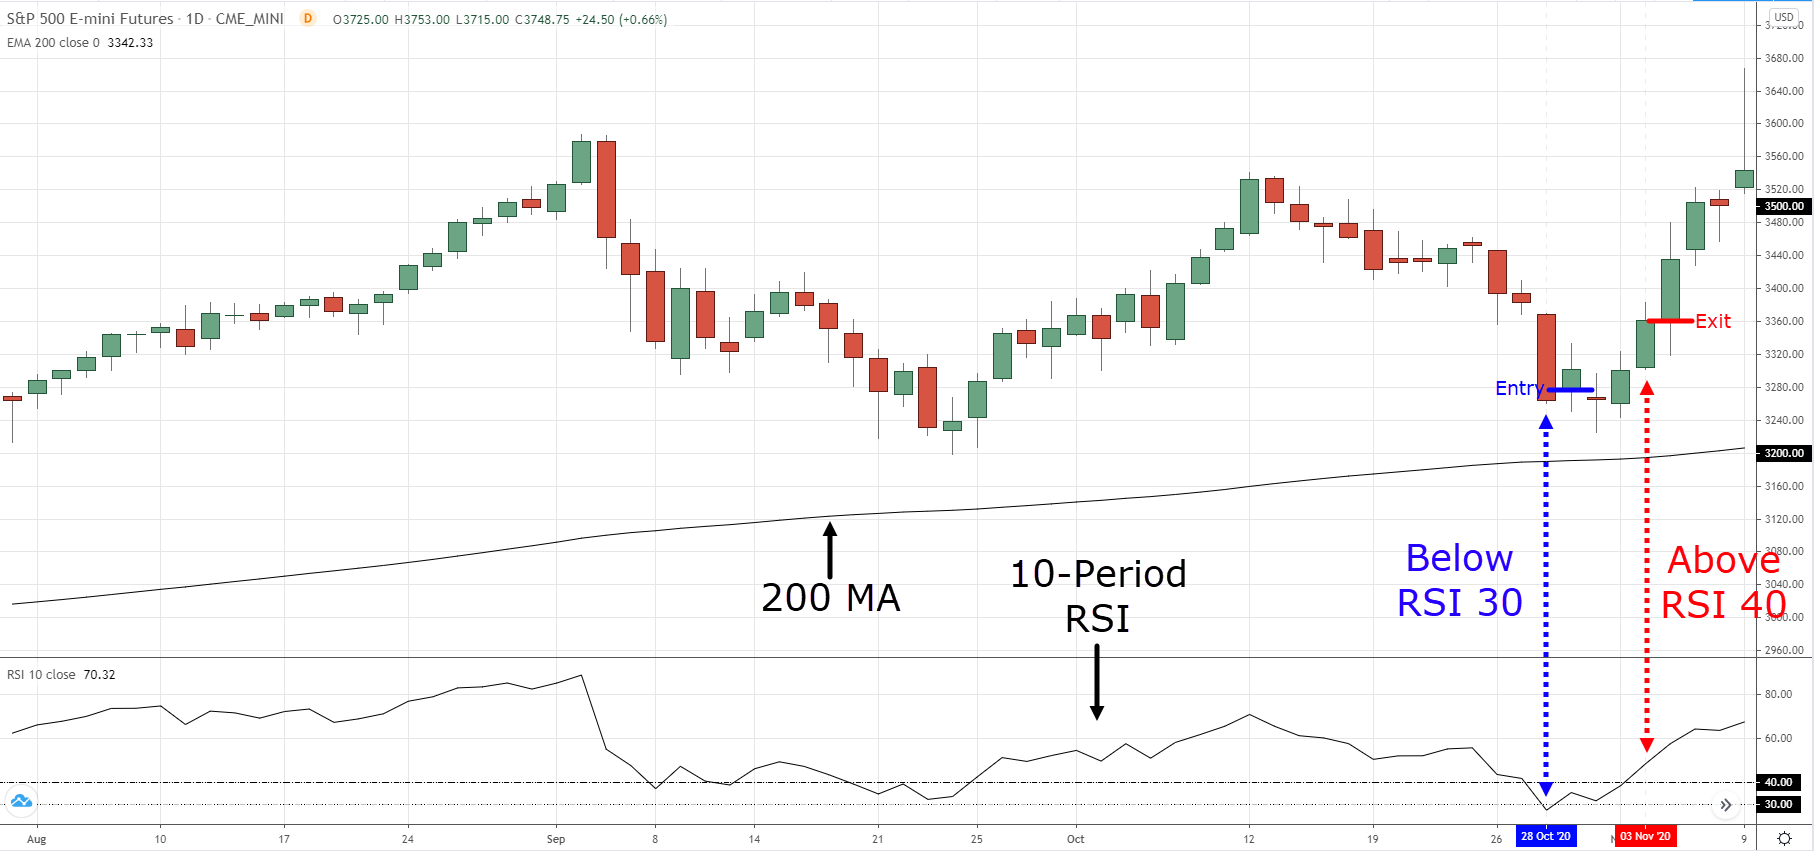
On 28th October 2020, the S&P 500 is above the 200-day moving average—which means you can look for buying opportunities.
Next, we check the 10-period RSI to see if it’s below 30.
And yes, it is! (Duh, I cherry-picked this chart.)
So, we enter at the market’s open on the 29th of October.
Then, we’ll wait for our exit signal which is for the 10-period RSI to cross above 40 or, after 10 trading days (whichever comes first).
In this case, the RSI crosses above 40 on 3rd November.
So, we exit our trade at the opening of the next day.
Example 2
Now, even though this mean reversion trading strategy has a high winning rate, there will still be losers along the way.
So let’s have a look at one example that resulted in a loss…
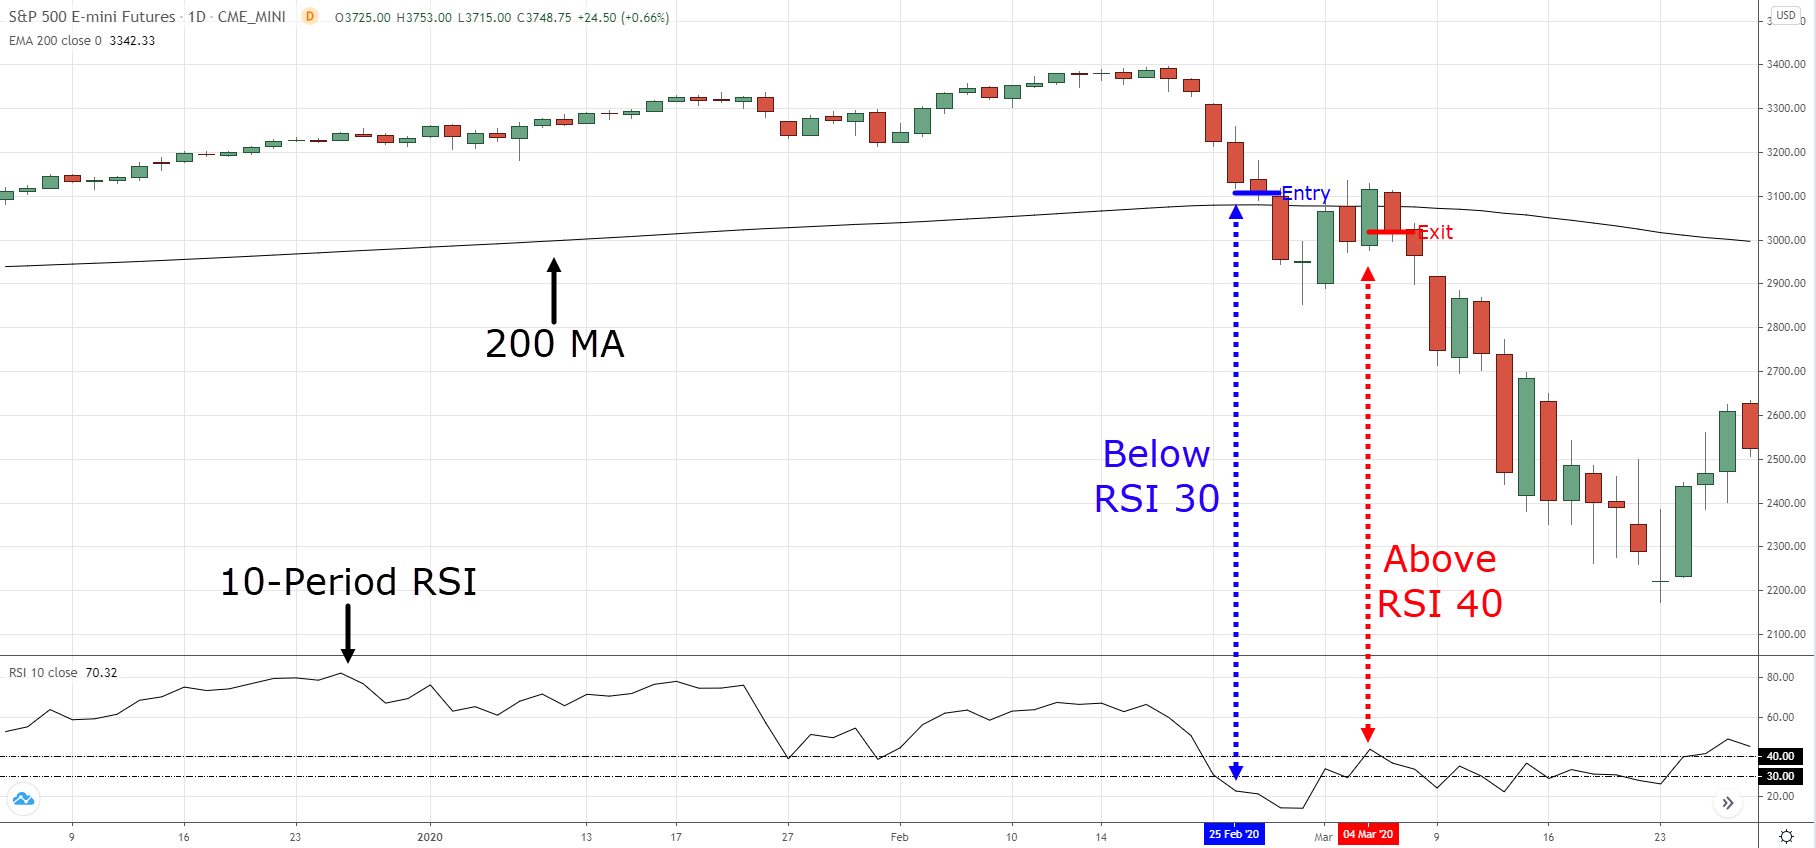
On 25th February 2020, the S&P 500 is above the 200-day moving average.
Next, we check if the 10-period RSI is below 30—and it is.
So, we’ll go long on the next day when the market opens.
On 5th March 2020, the RSI crosses above 40 which is our exit signal.
This means we’ll need to exit our trade on the next day (when the market opens).
Unfortunately, the market gapped against us and this resulted in a loss.
At this point:
You probably have questions like…
“Can I use a 14-period RSI for entry signal?”
“Can I exit when the RSI cross above 70?”
“Can I use a trailing stop loss instead?”
Well, I’ll tell you more later in the FAQ section.
For now, let’s analyze the results of this mean reversion trading strategy…
Mean reversion trading strategy (the results)
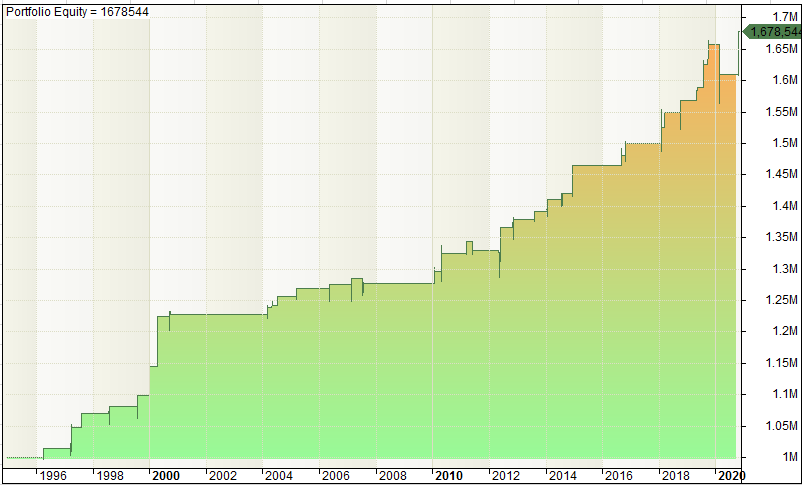
Now here are the results:
- Number of trades: 38
- Winning rate: 86.84%
- Average profit: 1.39%
And here’s the equity curve over the last 25 years…
As you can see, this mean reversion trading strategy is “interesting”.
It has a high winning rate and a decent average profit %.
But the problem is, there are only a few trading opportunities each year.
Well, don’t worry.
I’ll share with you a simple solution later in the next section.
Let’s move on…
Mean reversion trading: How to apply the concepts and improve your stock trading results
At this point, you’ve learned a simple mean reversion trading strategy that works.
But more importantly, what can you take away from this so you can improve your stock trading results?
#1: Trade individual stocks for more opportunities
So, you’ve seen the mean reversion strategy on the S&P 500 only get you 38 opportunities over the last 25 years.
That’s too few trades to make a decent profit.
What now, then?
Well, you can apply the mean reversion strategy to trade individual stocks (like stocks in the Russell 1000).
Would you like to know how it performs?
Of course, you do!
So, let’s apply the exact same rules I shared with you a while ago and put it to the test.
However, we’ll be adding a market filter rule this time…
Rules:
- The market is above the 200-day moving average
- 10-period RSI is below 30
- Filter stocks using the 100-day ROC
- Allocate 10% per stock (max of 10 positions)
- Buy on the next day’s open
- Exit when the 10-period RSI crosses above 40 (or after 10 trading days)
Market traded:
Russell 1000 Universe
Timeframe:
Daily
So, what’s the results?
How does it perform?
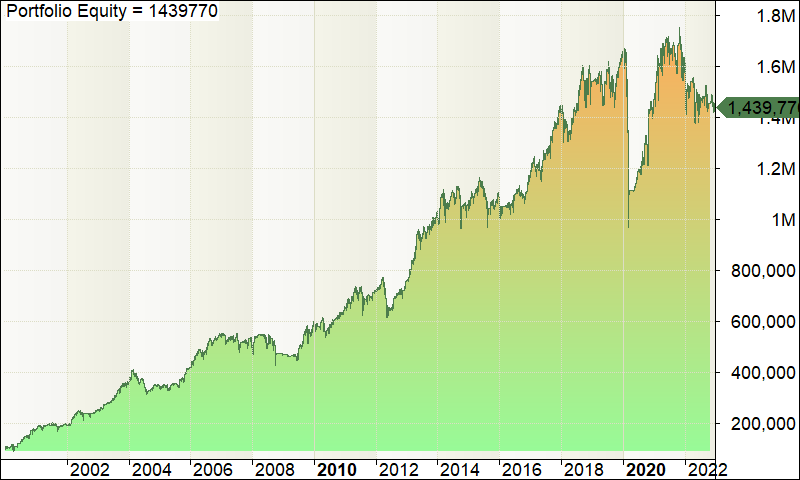
Results:
- Number of trades: 6,711
- Winning rate: 66.95%
- Average profit: $0.45%
- Average annual return: 12.29%
And here’s the equity curve of this system:
Some steep losing streaks here and there…
But you can’t deny that the system is robust enough to still have an edge when traded on different markets.
Pretty awesome, right?
#2: Avoid shorting stocks after a pullback
Here’s the deal:
Whenever stocks make a pullback or correction, there are permanent bears who would claim that it’s a bear market, recession, end of the world, etc.
But don’t get sucked into the hype.
As you’ve seen, after stocks make a pullback, they are likely to continue higher.
So if you were to short after a pullback has occurred, it’s a low probability trade and you’ll likely get stopped out.
Make sense?
#3: Pullback + area of value
As you’ve seen:
You’re more likely to make money buying pullbacks when a stock is in an uptrend (than shorting it).
But the problem is:
When the market corrects, many stocks will make a pullback at the same time.
So, how do you select the best stocks to buy?
Well, one technique you can use is to buy stocks that make a pullback towards an area of value (like support, upward trendline, respected moving average, etc.)
This way, you have multiple “factors” coming together which put the odds in your favor.
Pro Tip:
Alternatively, you can rank the stocks according to their rate of change (ROC) values over the last 50-weeks.
Then focus on buying those stocks which have the highest ROC values as these are the strongest stocks right now and their price is likely to continue higher.
Frequently asked questions (FAQ)
Here are some of the most common questions that I get from traders and my answers to them…
#1: Can I exit when the RSI crosses above 70 instead?
If you want to tweak the settings of this trading strategy (like the entry, exit, etc.), feel free to do so.
(In fact, I encourage this because you’ll learn faster.)
But, you must be willing to do the work and find out how these changes will affect the results.
I can only give you a “road map”. The rest is up to you to figure because no one will do the work for you.
#2: Can I trade it in other markets?
I’ve tried it on the FX markets and the results were not good.
Thus, I can’t say how this trading strategy will fare outside of the stock market.
So, you’ll have to be the one to do the work to find out.
#3: Where is the stop loss?
We use a time-based stop loss instead of a price-based stop loss.
So, if the RSI doesn’t cross above 40 after 10 trading days, we’ll exit the trade on the open of the 11th trading day.
#4: Won’t you blow up your trading account?
It’s unlikely you’ll blow up your trading account because no leverage is involved.
This means you’ll only lose everything if the S&P 500 ETF (SPY) goes to zero.
Possible, but unlikely.
However, if you employ leverage (or margin), then there’s a possibility of a blow-up as your losses are amplified.
Conclusion
So here’s what you’ve learned:
- Mean reversion trading can mean a few things. But for stock trading, you’ll look to buy when a stock price has fallen and then, sell on the next rally higher
- Mean reversion trading works in the stock market because, in the long-run, the stock market is in a long-term uptrend
- You can apply a mean reversion trading strategy to individual stocks for more trading opportunities
- Avoid shorting stocks after a pullback (or sell-off) because that’s where it’s likely to rebound higher
- If you’re a discretionary stock trader, you can look for pullbacks into areas of value like support, trendline, channel, etc. to better time your entry
Now here’s what I’d like to know…
What’s your take on mean reversion trading?
Leave a comment below and share your thoughts with me.


Good strategy…..
Thanks, Abdul Gafar!
Good explanation of a common strategy I hear a lot of high roller traders use, however with the average profit of 1.39% how would one progress at a decent rate if you have a small trading account of say, 10-20k? would this strategy be more suited to larger accounts?
Please comrades! Let us have the habit of sharing our views on any lessons posted on this community to facilitate our learning process and to encourage our educators. Together, let’s make tradingwithrayner one of the best trading community. Please
Thank you, Mohammed!
Would this strategy work on crypto futures too? But it is 24hr and without closing day. So we just watch when RSI reaches 40 to close ? I’m using Stochastic RSI (3,3,14,14) indicator. What to do to change the settings for 10 period ?
Hi, Jasminez,
It has only been tested in Forex (which results were not good) Thus, we can’t say how this trading strategy will fare outside of the stock market.
But you can try it on crypto so you can find out about it.
Cheers!