In today’s post…
You will learn a simple method to read candlestick patterns like a pro:
- without memorizing a single pattern.
- without getting confused by the sheer number of patterns
- without getting overwhelmed with information if you just follow this simple procedure
Sounds good?
So, let’s kick things off by knowing the basics.
Candlestick Patterns: The Basics
Candlestick patterns are a way to show prices on your chart.
Though it’s not the only way as you also have stuff like:
- Bar chart
- Line chart
- Renko chart
- Heiken Ashi chart
However, a Candlestick chart is one of the more popular approaches.
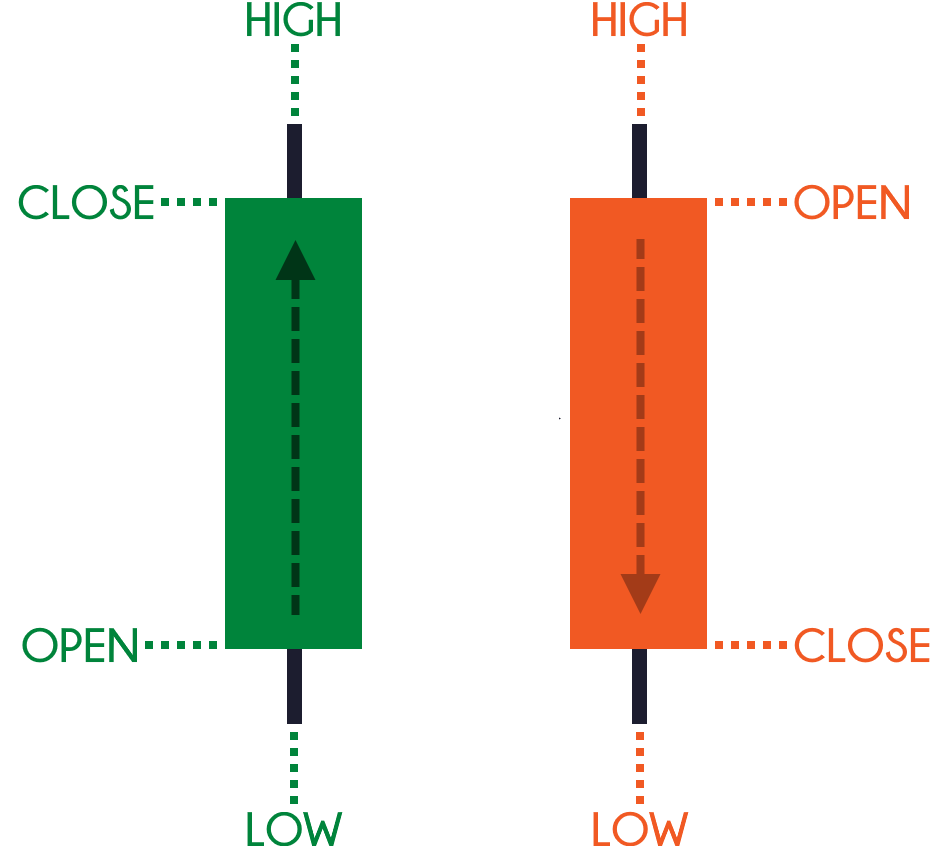
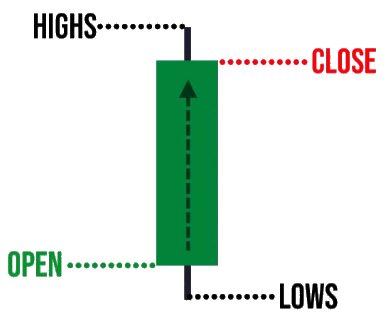
Now, when you are dealing with candlestick patterns, you must be aware of these certain price points:
- Open
- High
- Low
- Close
Here’s what I mean:
So, candlestick patterns usually have two popular colors: The green and the red bar
What’s the difference you may ask?
Let me simply show you…
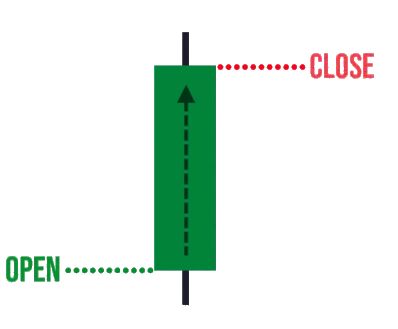
What a green candle means is that the price has closed higher for the period.
So, the opening and the closing price is always here for a green candle:
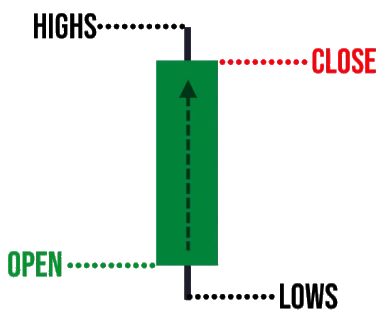
Now, the highs and lows that you see over here are what we call the “wicks.”
The upper wick signifies the highest high of the period, and the lower wick signifies the lowest low of the period.
You might be wondering:
“Hey Rayner, what is a period exactly?
Here’s the thing…
Candlestick patterns can be shown in different timeframes.
The daily, weekly, monthly, 15-minutes, 20-minutes…
Whatever timeframe you desire, candlestick patterns can be shown on the respective timeframe.
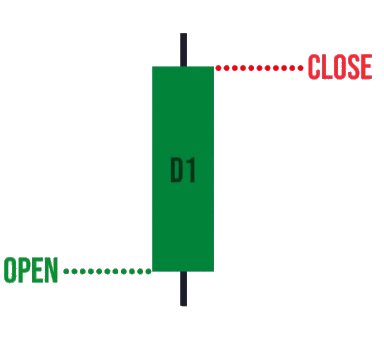
For example, let’s say you’re looking at this green candle on the daily timeframe.
It means that this is the opening and closing price of the day:
As well as the highest high and the lowest low that happened “within” the day:
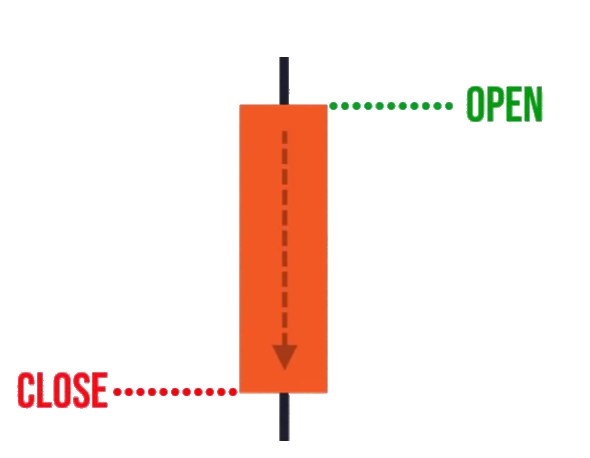
How about the red bar?
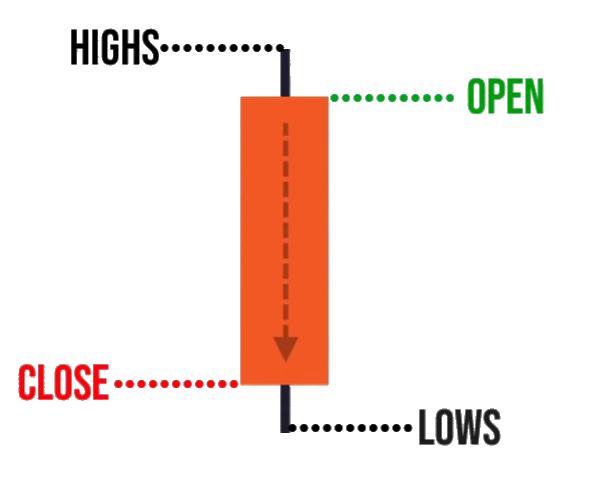
When you see a red bar, it means that the price has opened higher, and closed lower for the day:
Likewise, this is the highest high of the period and the lowest low of the period:
That’s it!
That’s the basics of Candlestick patterns and how to read them.
Now here’s the thing.
Those of you who dabble in Candlestick patterns for a while will face this problem…
Candlestick Patterns: The Problem
The problem is that there are so many patterns out there!
you have the:
- Three white soldiers
- Bullish engulfing
- Shooting star
- Hammer
- Harami
- Doji
And if you memorize all this, you know it’s a matter of time before you get overwhelmed!
But really…
Memorizing patterns is not the way to trade the markets.
So, what’s the solution?
Candlestick Patterns: The Solution
Every time you look at Candlestick patterns and you are not sure what it means…
Ask yourself these two questions:
- Where did the price close relative to the range?
- What’s the size of the candlestick pattern relative to the previous ones?
Let me explain…
1. Where did the price close relative to the range
The power of this question will tell you who’s in control.
Is it the buyers who are in control? The sellers? Or nobody is in control?
Here’s how this question works:
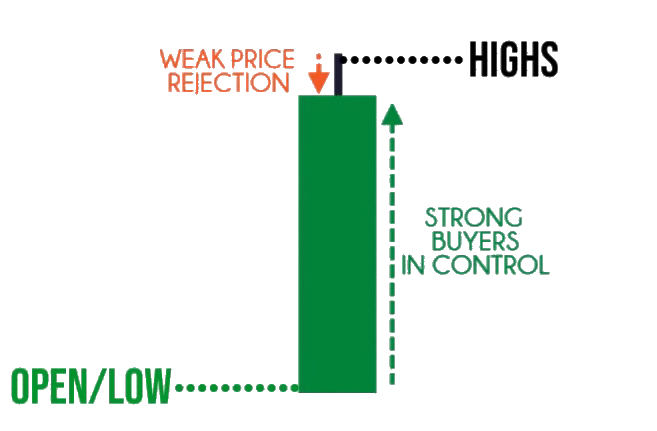
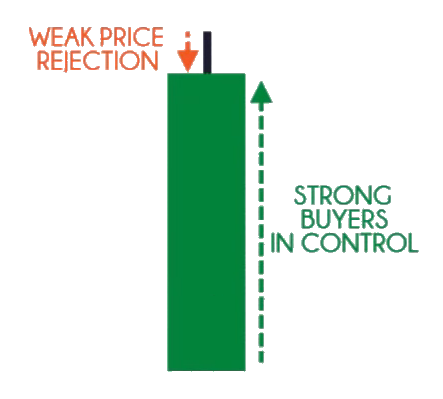
If you look at this green candlestick pattern, it tells you that the price has closed higher.
However…
Do you notice that there is no low wick?
Well, that’s because the opening price is also the low of the day!
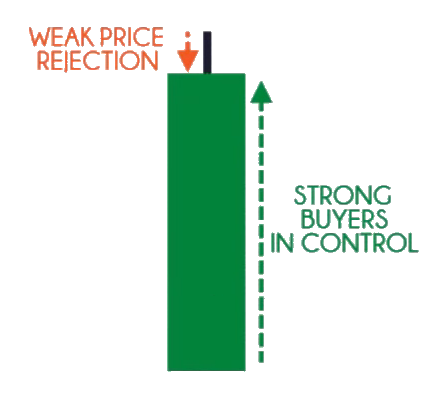
Now, notice that there is an upper wick over here:
What does it mean?
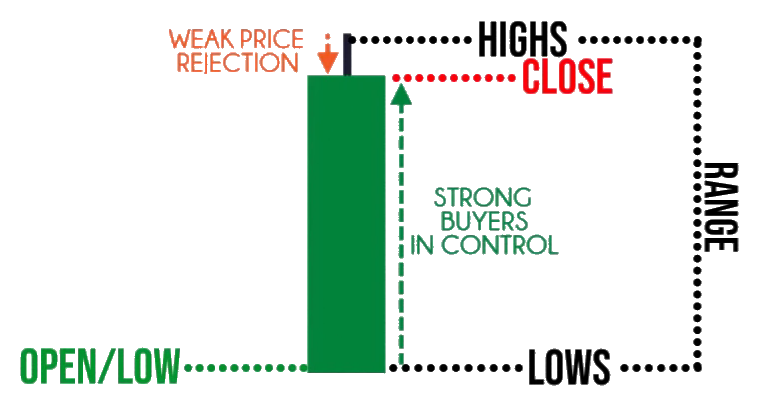
It means that this green candle closed near the highs of the range.
But you might be thinking:
“Wait a minute, what exactly do you mean by a range, Rayner?”
Ah, of course.
Let me quickly explain.
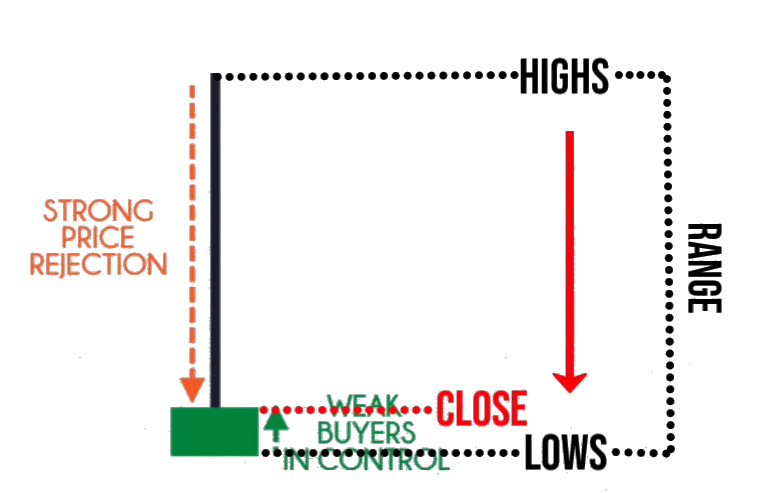
The range simply is the distance between the highs and the lows:
That’s it!
But again, notice that the price closed near the highs of the range.
This tells you who’s in control!
And who’s in control?
The buyers!
Why?
Because they can close the price near the highs of the range!
Alright, let me give you another important example to make more sense of this question:
Yes, it’s still a green candle and the price still closed above the opening price.
But let me ask you:
Are the buyers still in control?
Again, just use this question: Where did the price close relative to the range?
As you can see, the price closed over here:
Now, we are seeing a different picture than the previous example!
Why is that?
Because now you realize that the price only closed marginally higher relative to the range.
What does it tell you?
It tells you that at one point in time the buyers are trading near the highs just like the example I showed you a while ago:
But before the candle closes, the sellers came in and pushed the price all the way down until the candle closes:
This tells you that there is selling pressure lurking around; it is a sign of weakness.
So, to answer the question…
It should tell you that the sellers are in control.
Makes sense?
So, here’s the second question…
2. What’s the size of the pattern relative to the earlier ones?
This question tells you whether there’s a real strength behind the move.
Let me explain.
If you look at this chart:
Notice that it is currently on a retracement and it has made a bullish close.
It tells you that the buyers are in control!
But if you look at the most recent candle over here:
Relative to the earlier candles, you notice that the range of this candle doesn’t signify much.
It’s not large compared to the earlier candles!
This should tell you that there isn’t any strong buying conviction behind this candlestick move.
However, if you look at this chart over here, look at the size of the candlestick relative to the earlier ones…
This tells you now that not only on the buyers in control but there is also strong conviction behind the move!
Can you see where I’m coming from?
So, once you understand these two questions, then you pretty much can read any candlestick patterns you come across.
Now, before we end today’s training guide he’s a bonus lesson for you…
Candlestick Patterns: Combination
Here’s the truth:
Candlestick patterns are very versatile.
You can combine them across different timeframes and visualize what the pattern will be on the higher time frame.
Does it make sense?
No?
Then let me give you an example:
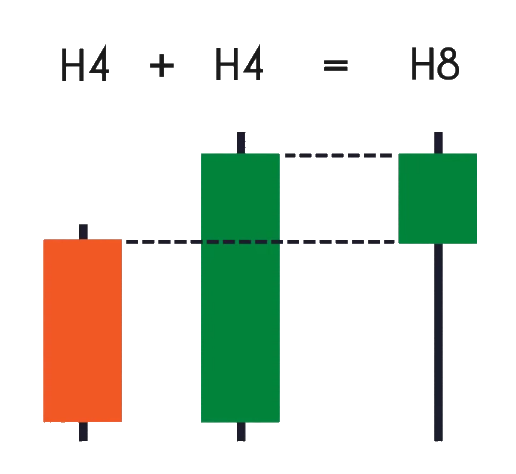
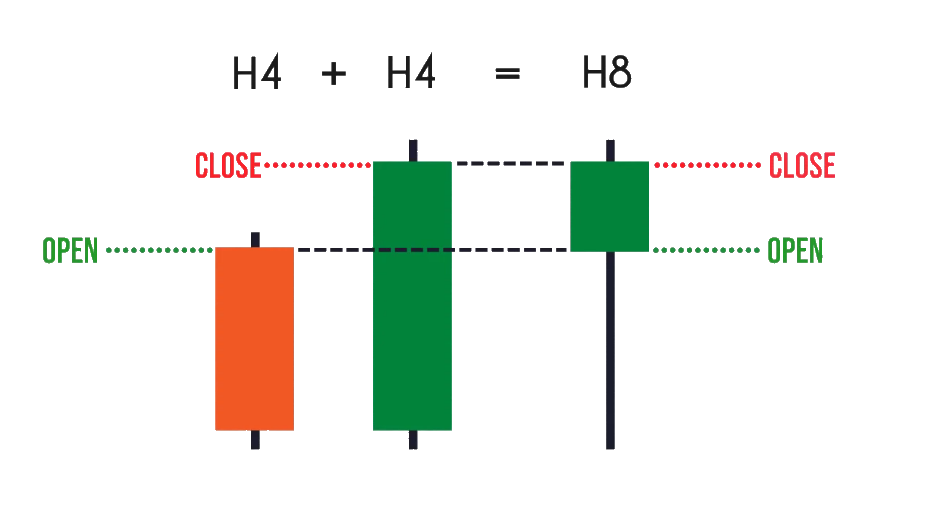
So, if you look at this pattern on the 4-hour timeframe you have a bullish engulfing candlestick pattern.
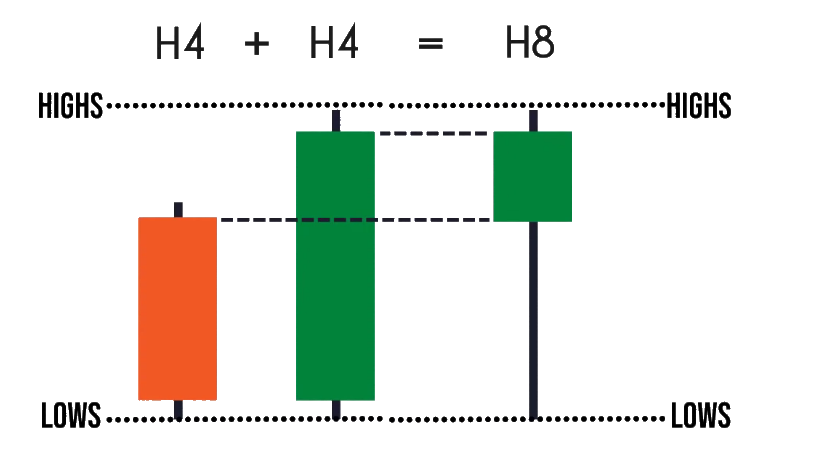
But when you go up to the 8-hour timeframe you will realize that the candlestick pattern will look something like a hammer!
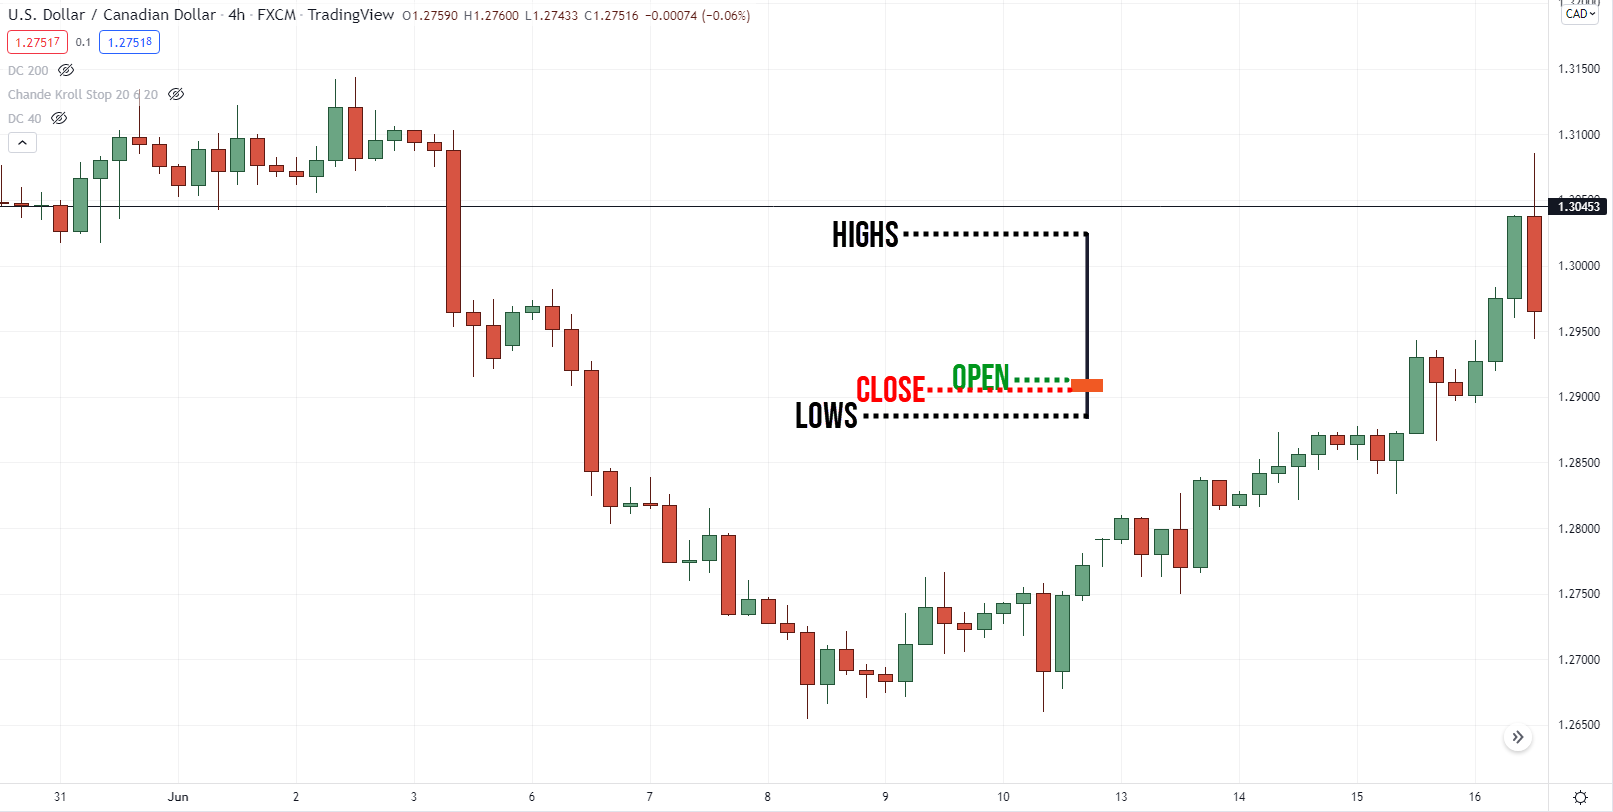
The opening and closing price of the 4-hour timeframe would look something like this while the 8-hour candle is forming:
While the highs would look something like this:
Sometimes, if you are looking at the chart and you don’t quite understand what’s going on:
“Man, what’s going on? Who’s in control?”
“One candle is green and one is red, what now?”
What you have to do is just combine two Candlestick patterns and you will have a clear understanding of who’s in control.
Let me give you an example of a real chart, shall we?
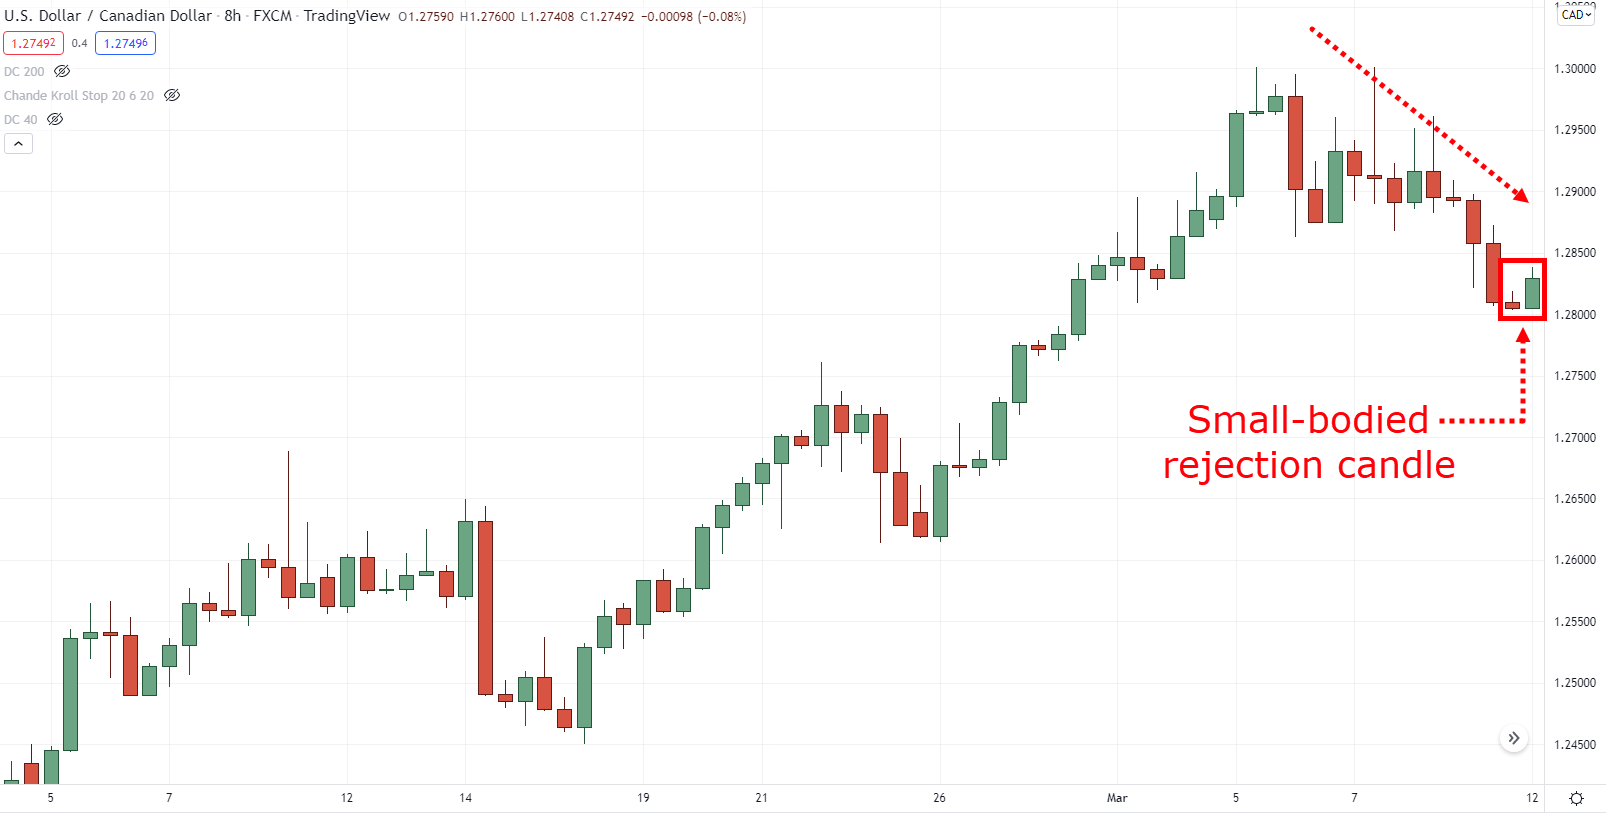
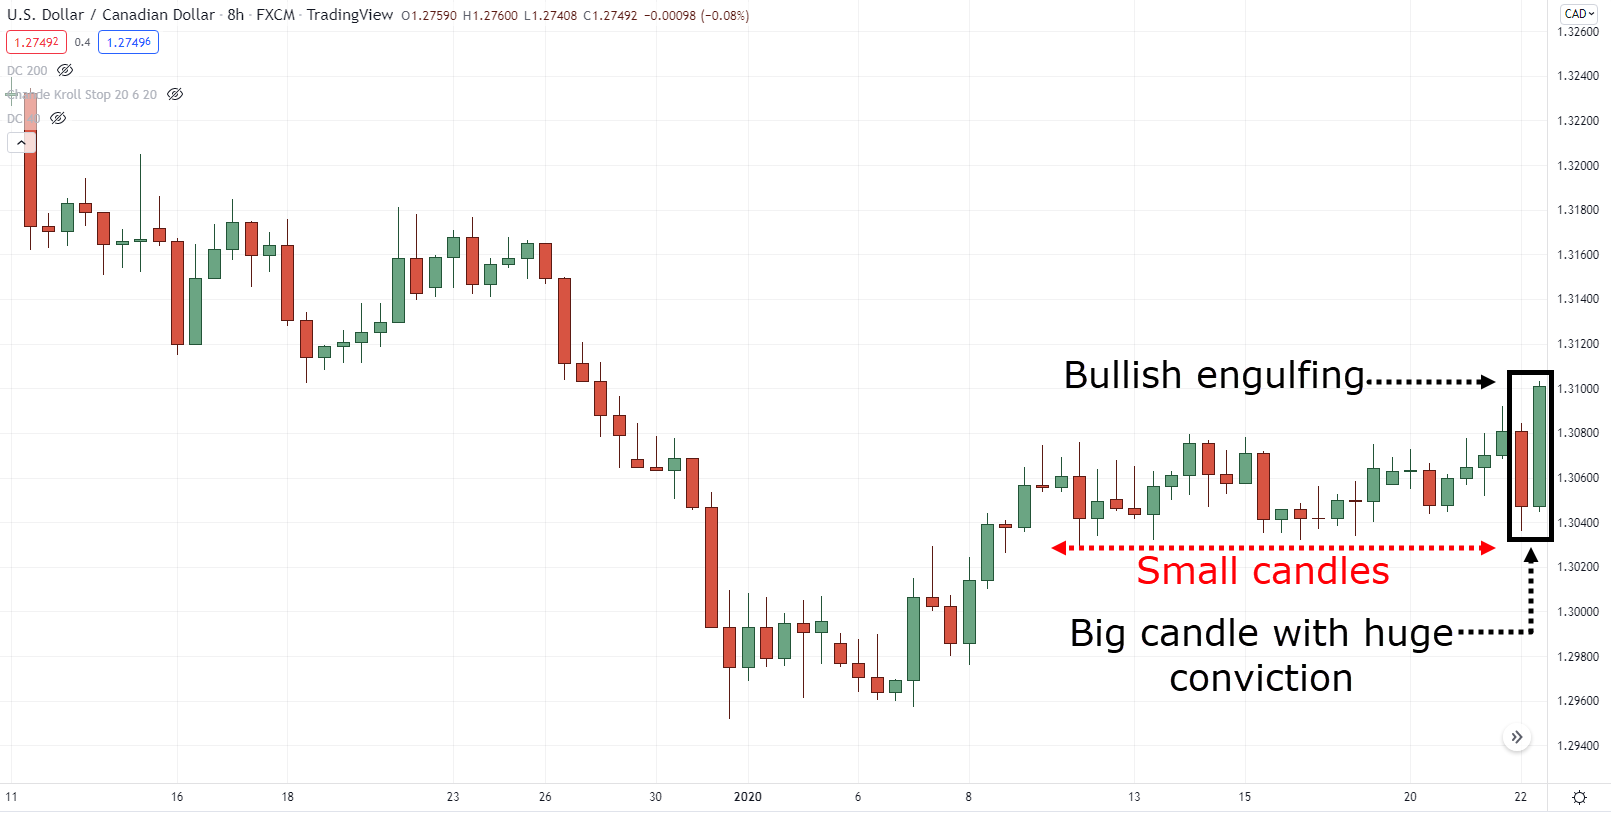
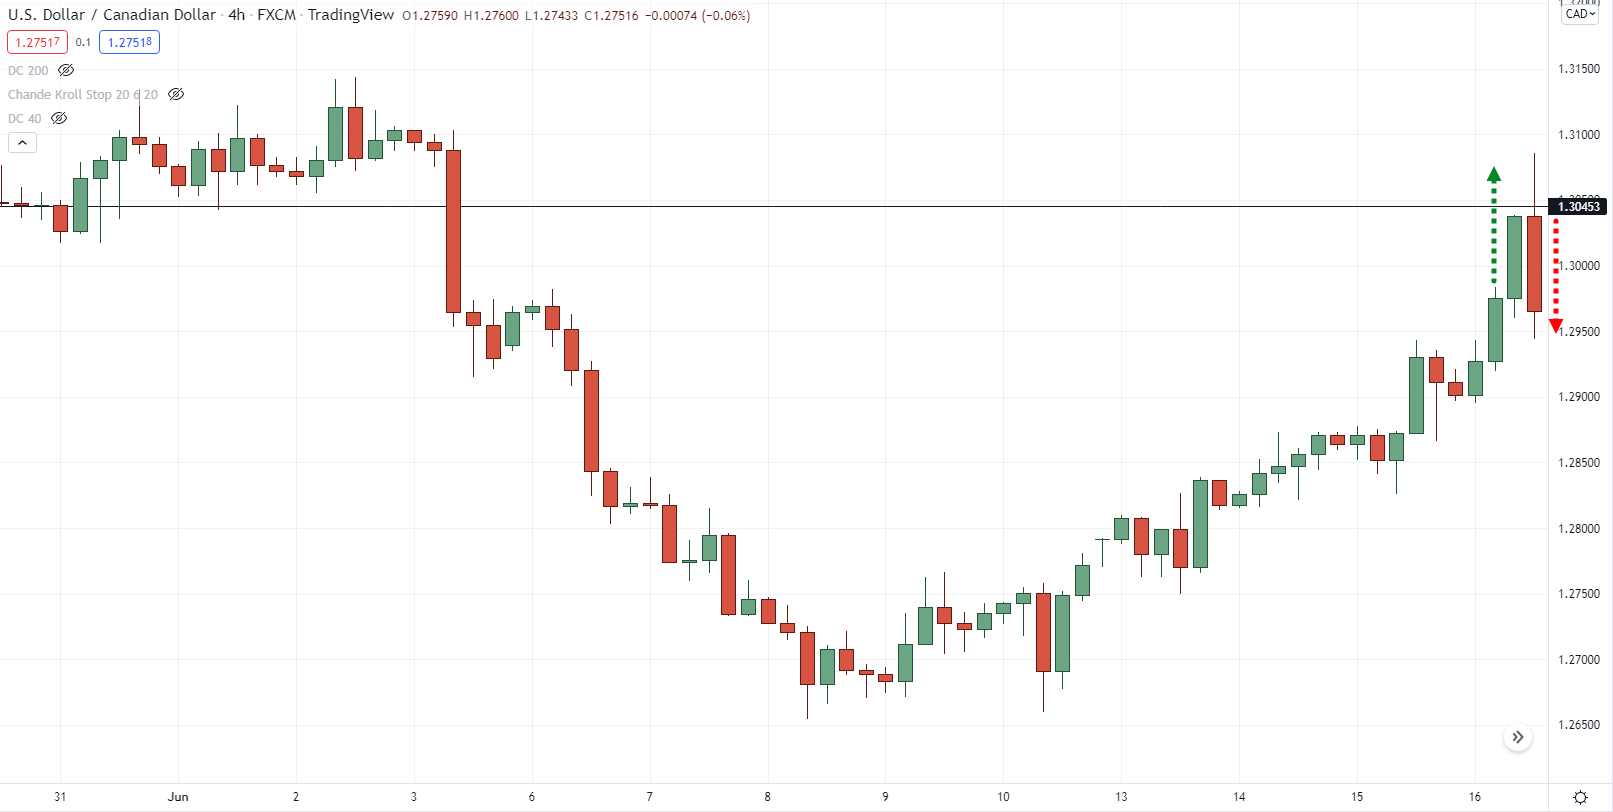
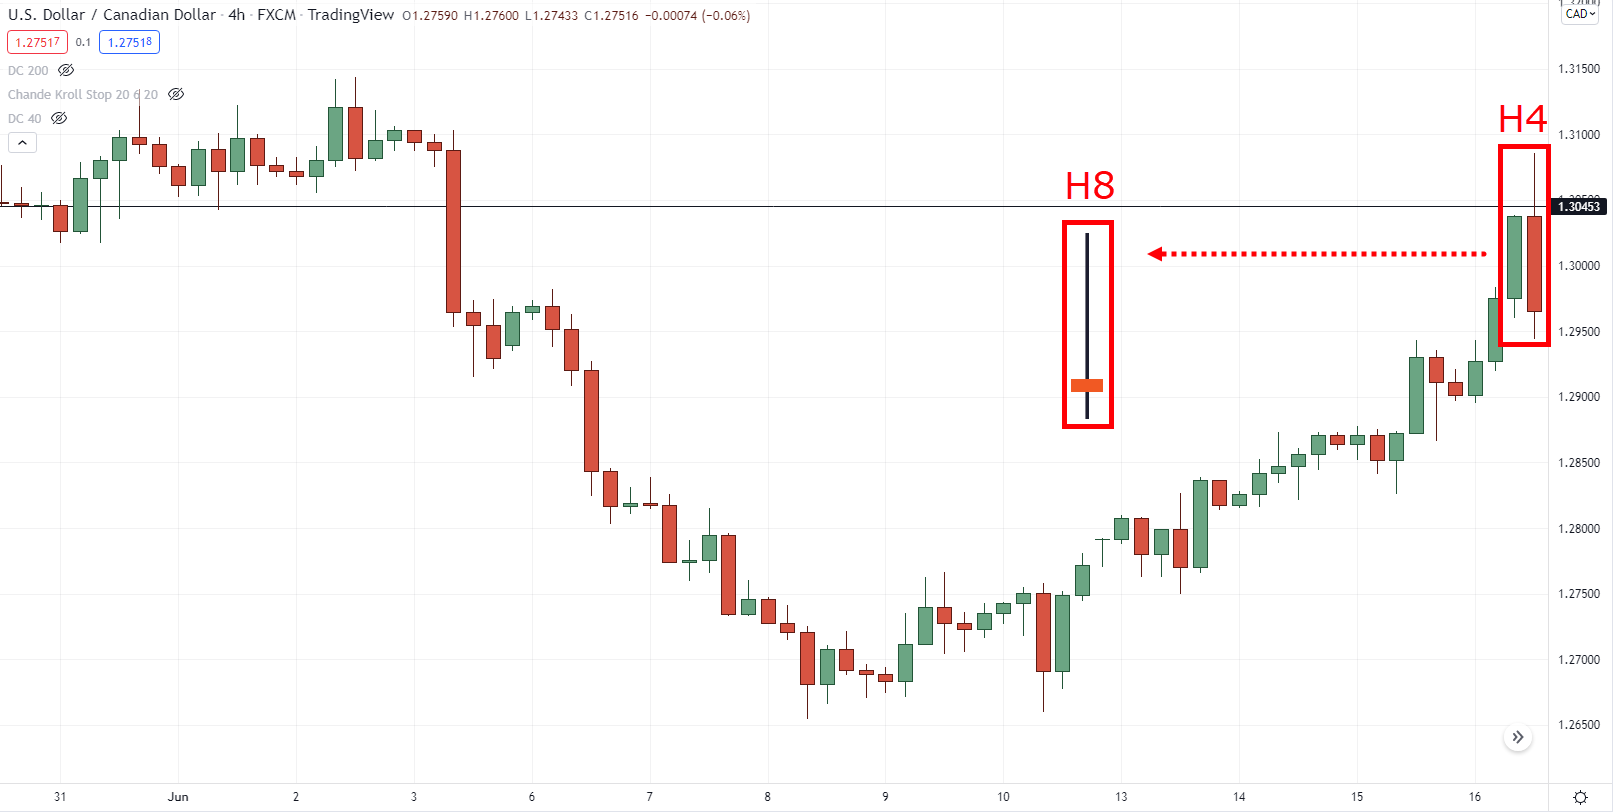
So, for example, you look at this chart on USDCAD 4-hour timeframe:
You start thinking:
“Man, Rayner look at this Rayner this is so confusing!”
“One moment the candle is green next moment is red, so should I buy or should I sell?
“What’s going on man, I’m confused!”
Alright chill, just do I just share with you earlier.
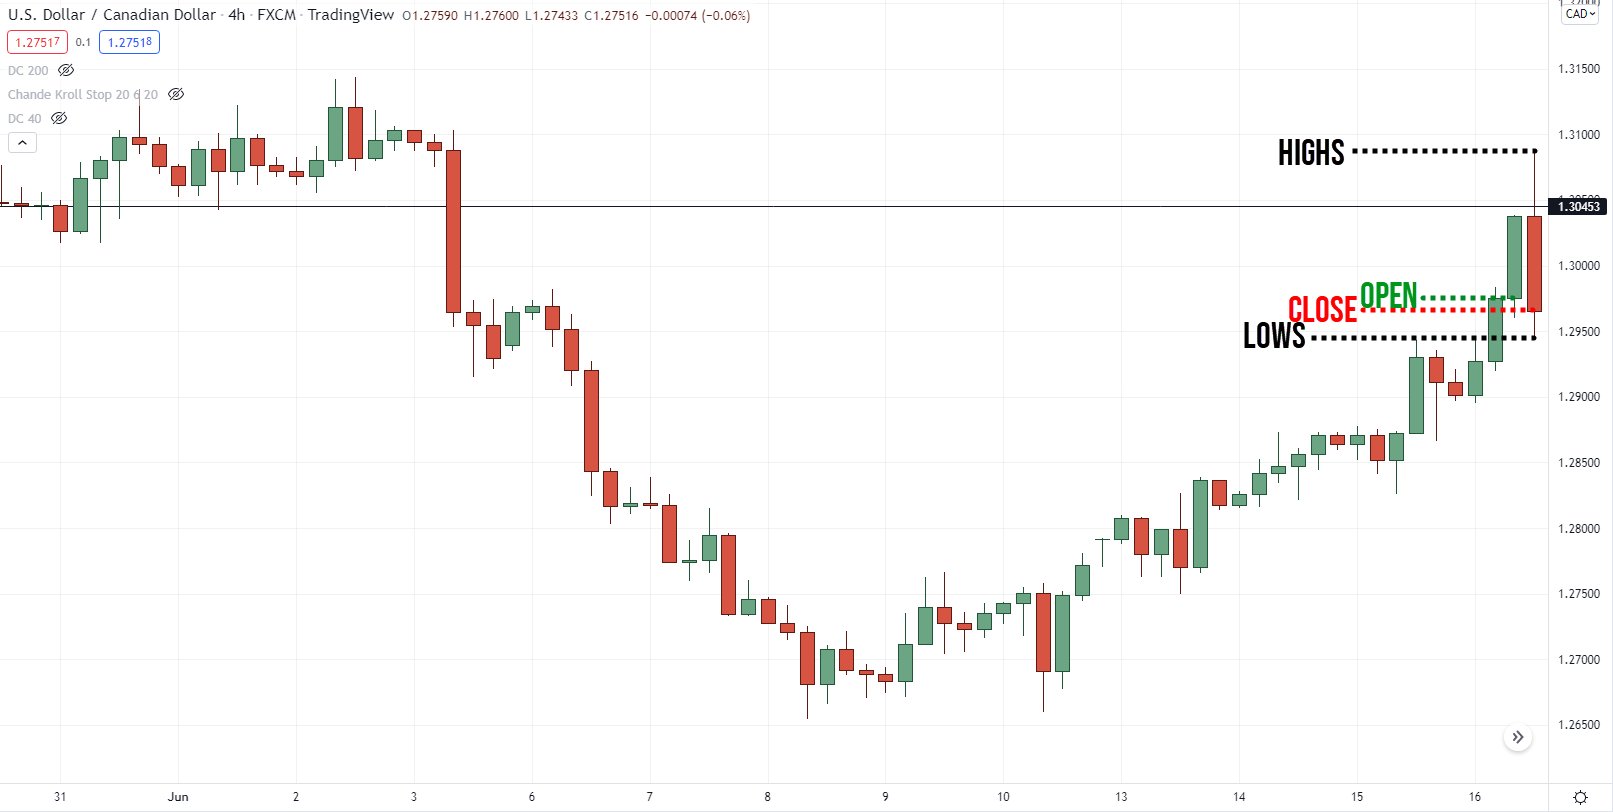
Take the opening, closing, highs, and lows of this candle:
And if you visualize this information on the higher timeframe…
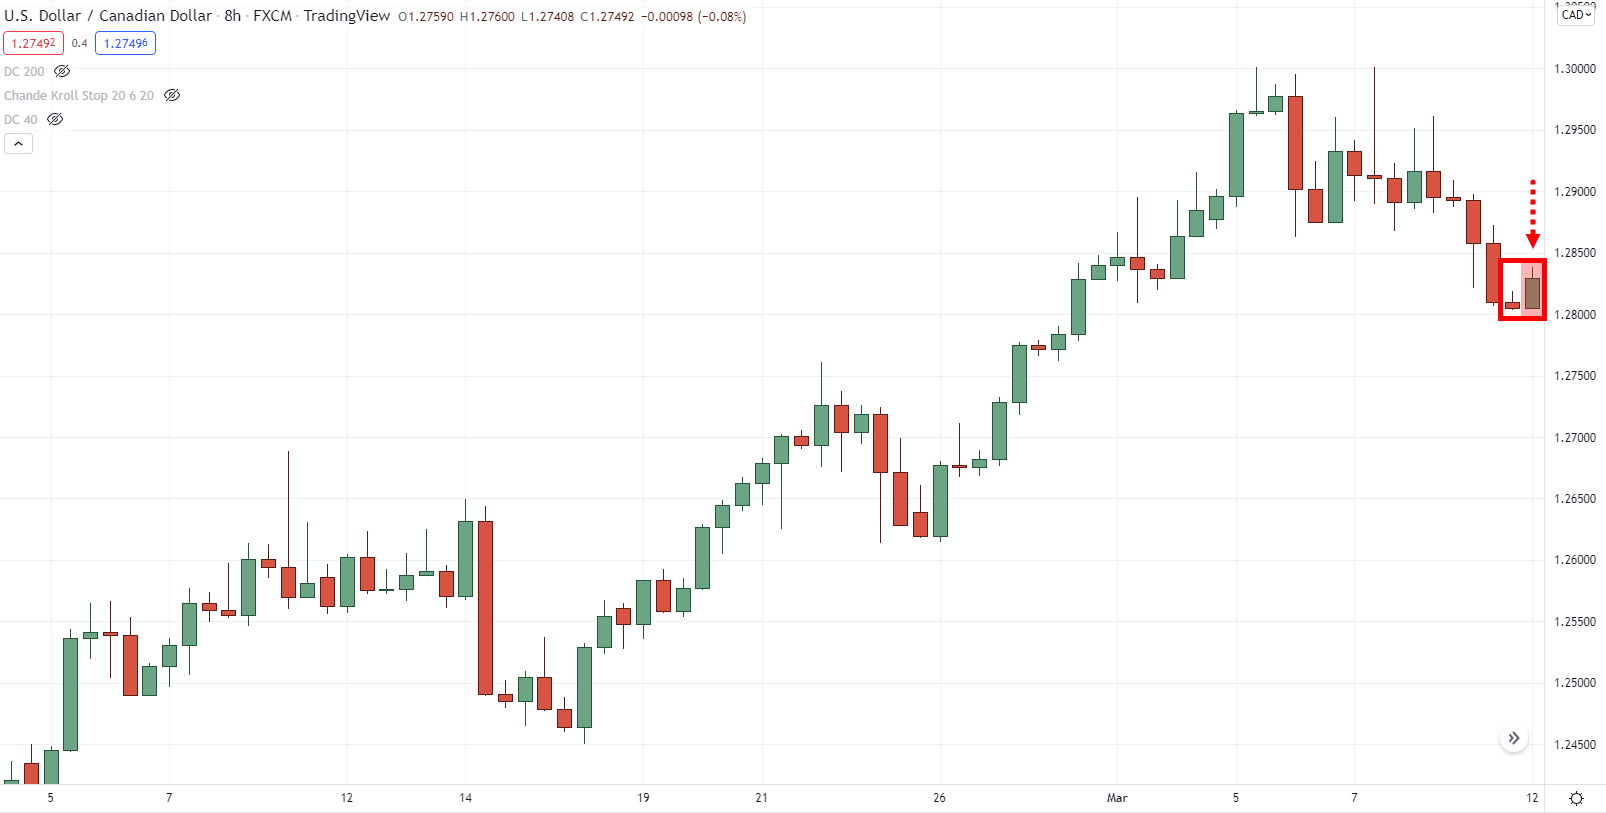
The information would give you this:
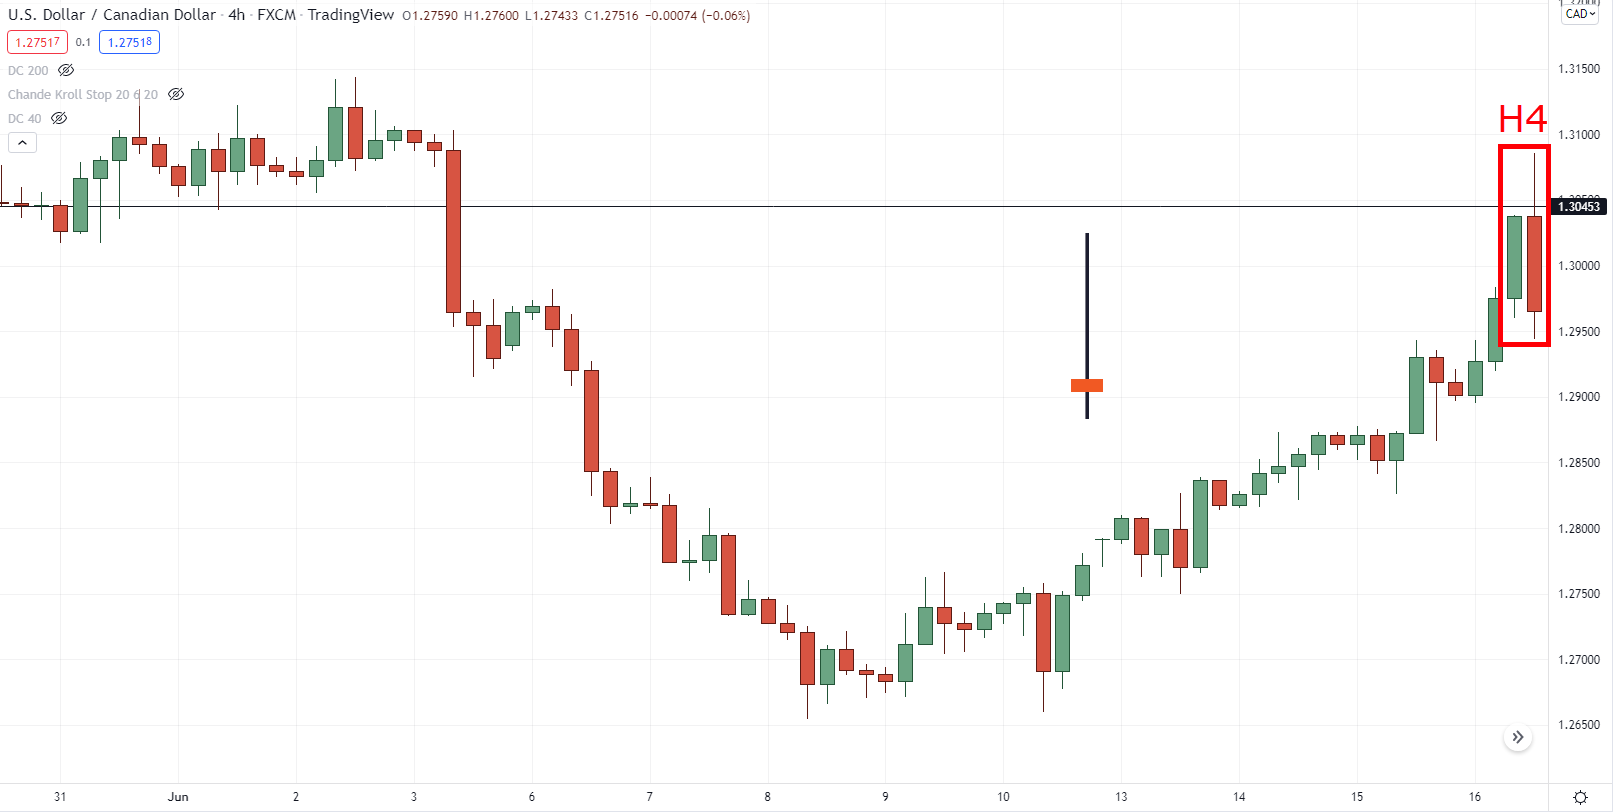
So, the candles you’re seeing on the 4-hour timeframe:
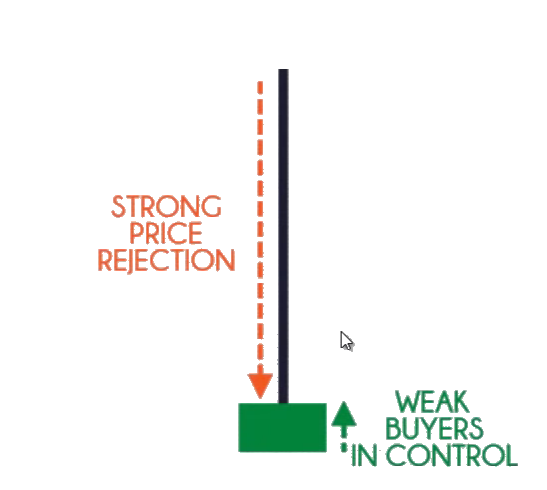
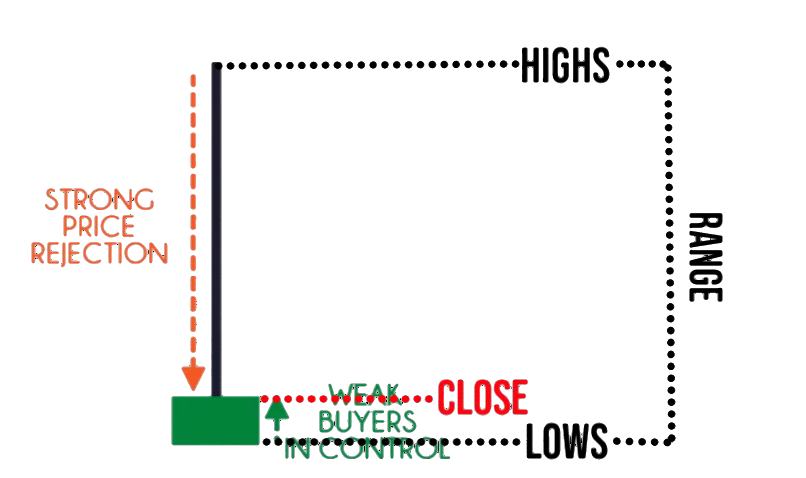
Shows a price rejection on the 8-hour timeframe:
There you have it!
That’s how you combine candlestick patterns to make sense out of something that you’re not quite sure of.
So, let’s do a super quick recap about today’s topic on candlestick patterns…
Conclusion
- Candlestick Patterns show you the Open, High, Low, and Close for a given period
- Two questions that matter:
- Where did the price close relative to the range?
- What’s the size of the pattern relative to the earlier ones?
- You can combine Candlestick Patterns on the lower timeframe to form a higher timeframe candlestick pattern
I’ve come to the end of this training.
So, this time, I want to hear from you…
What candlestick patterns do you often use?
How do you use candlestick patterns in your trading?
Let me know your thoughts in the comments below!


The candle explanations are great, thanks Rayner.
You’re most welcome, Tom!
It’s an interesting read, but I already knew this before now through a trader on YouTube called Aliakbar, thanks for your steady education…. kudos!
Rayner is happy to help, Olawale!
You might wanna check Rayner’s Academy for more additional learnings!
Here is the link:
https://www.tradingwithrayner.com/academy/
Thank you sir I have learnt a lot from you, I’m so excited for this one,God Bless you sir
Hey there, Alex!
You are most welcome! You might want to check Rayner’s Academy for more learning too!
Here is the link:
https://www.tradingwithrayner.com/academy/
Cheers!
Great!rayner that was awesome
No worries!
Cheers!
Thank you Rayner, you made candlestick pattern so easy to understand. Even a beginner like me can follow and is especially helpful with the charts.
Hi, Baoru!
Jarin here from Tradingwithrayner Support Team.
You are most welcome! You can also take advantage of Rayner’s Academy. This is also best for beginners!
Here is the link:
https://www.tradingwithrayner.com/academy/
To be sincere am happy with your lesson like have making a lot of mistakes thanks to you rayner
Nice explanation…but more candlestick patterns to be discussed.
In real market the signals can be more confusing!
Thank you for sharing your thoughts, Ravisankar!
Hi mam always good to read your content.it’s very simple & clear for all new bees. Just want to asked you this your content all tested with forex index. Can it will work in Indian markets index and stocks.
Hi, Abhijit!
It works as long as the market has a price action.
Hope this helps!
Sir I’m still a newbie in this financial market, I want to ask
Is your teachings applicable to crypto trading?
Hi, Nedcriz!
Yes. It is applicable to crypto, too!
My best candles are Bullish/Bearish engulfing,Hammer/shooting star and morning/evening star patterns
I trade them at an area of value(trend line + support/resistance) with stochastic oscillator indicator.
Thank you for sharing your insights, Mohammed!
The monster guide to candle stick pattern book very very useful in trading specially for beginners traders thanks lot super man rayner
Glad it helped you, Hasmukh!
If you used chart examples which happened recently, we will find it more relatable.
Thanks for the suggestion. You can see candlestick patterns in any time frame of the market.
cheers!
Tjooo Rayner,
I’m glad I took time to read through this training. It’s all making sense the way you explain it
Happy to know that, Helen!