
Support and resistance.
Trend lines.
Chart patterns.
Have you ever asked yourself…
“Do these tools truly work in the markets?”
“How can I really tell?”
If you have, then you’re ahead of at least 50% of all traders out there!
Because while most of them put blind faith into textbooks and videos…
…you’re starting to expand beyond that.
But, how can you verify what’s going on?
And is there a way to use that knowledge to build a profitable trading system?
From scratch, even!?!
Well, my friend, you’ve come to the right place.
In today’s guide, you’ll learn:
- The key to creating trading systems that not only generate profits, but also keep you consistently on track in the markets
- The ultimate checklist for building a rock-solid, rules-based trading system
- A complete, battle-tested framework for crafting trading systems that deliver real, repeatable results
- The biggest pitfalls traders face when building systems and how to overcome them with confidence
You ready?
Then let’s get started…
The Key To A Profitable Trading System Is Eliminating Discretion In Your Trading
Look at this chart…
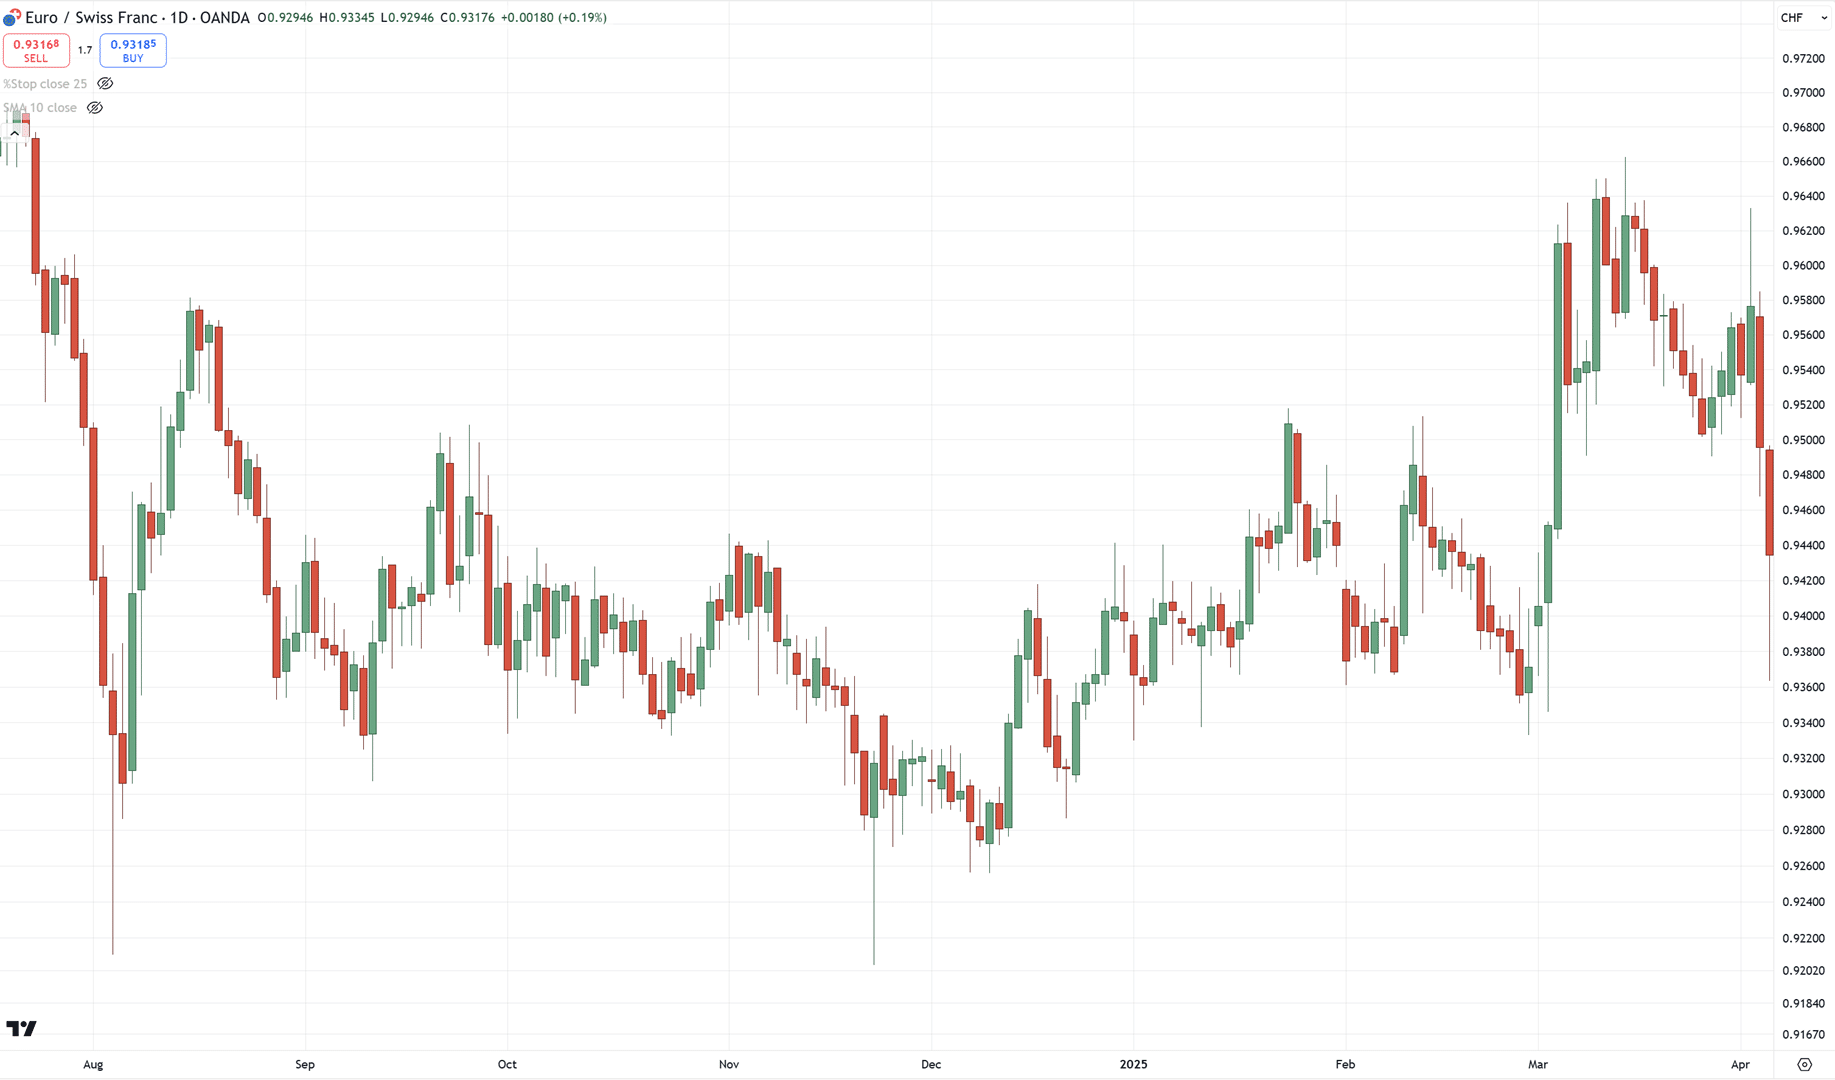
Let’s say you’ll try to buy at support and sell at resistance.
So, can you tell me where support and resistance are?
Well…
If you’ve been practising for a while, you might have plotted something like this…
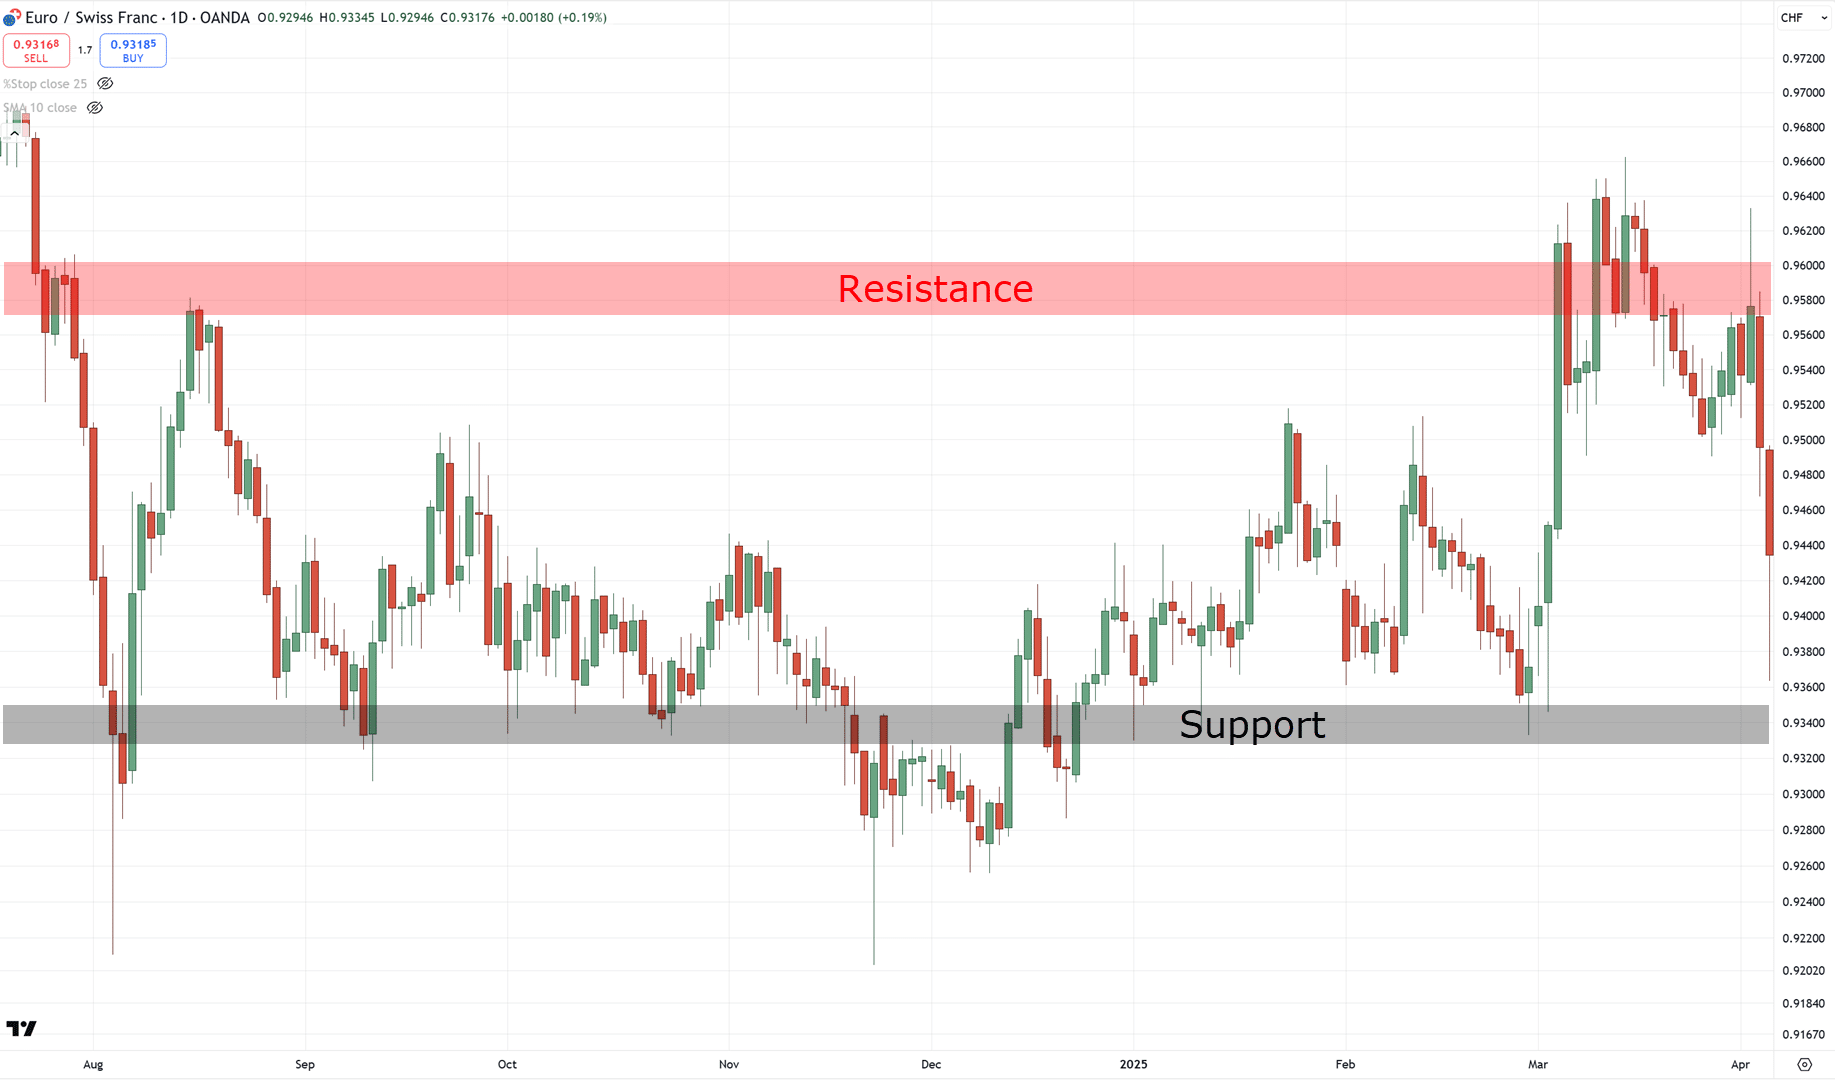
Simple, right?
But here’s the thing…
Even right now, I’m guessing you disagree with how I’ve plotted my support and resistance.
What more with other traders?
What I mean is that if you show this same chart to two other people, they may well have plotted very differently…
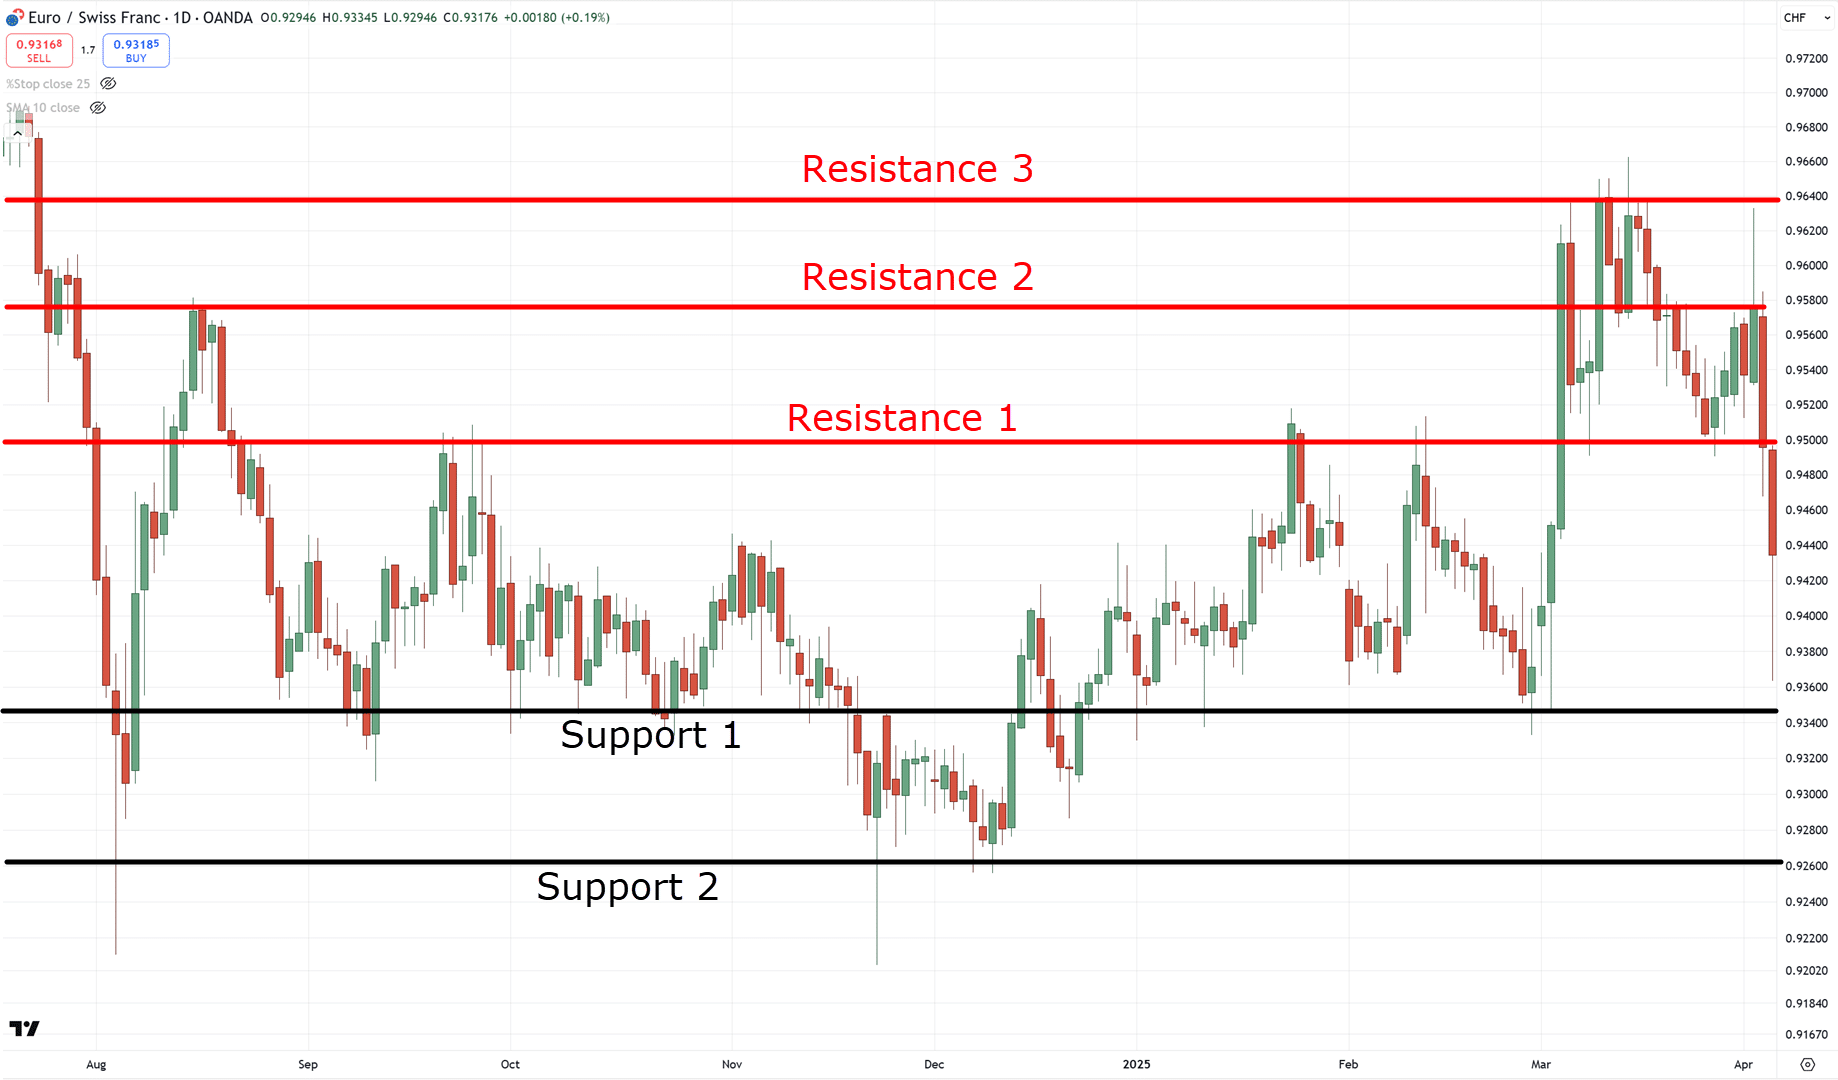
Of course, you could say:
“Those were minor support; it shouldn’t have been plotted!”
“We need more data, zoom out more!”
But that’s the thing…
There are too many factors that you could add!
And what happens when you add more factors or variables?
That’s right…
Inconsistency!
Most importantly, it makes it almost impossible to backtest your strategies.
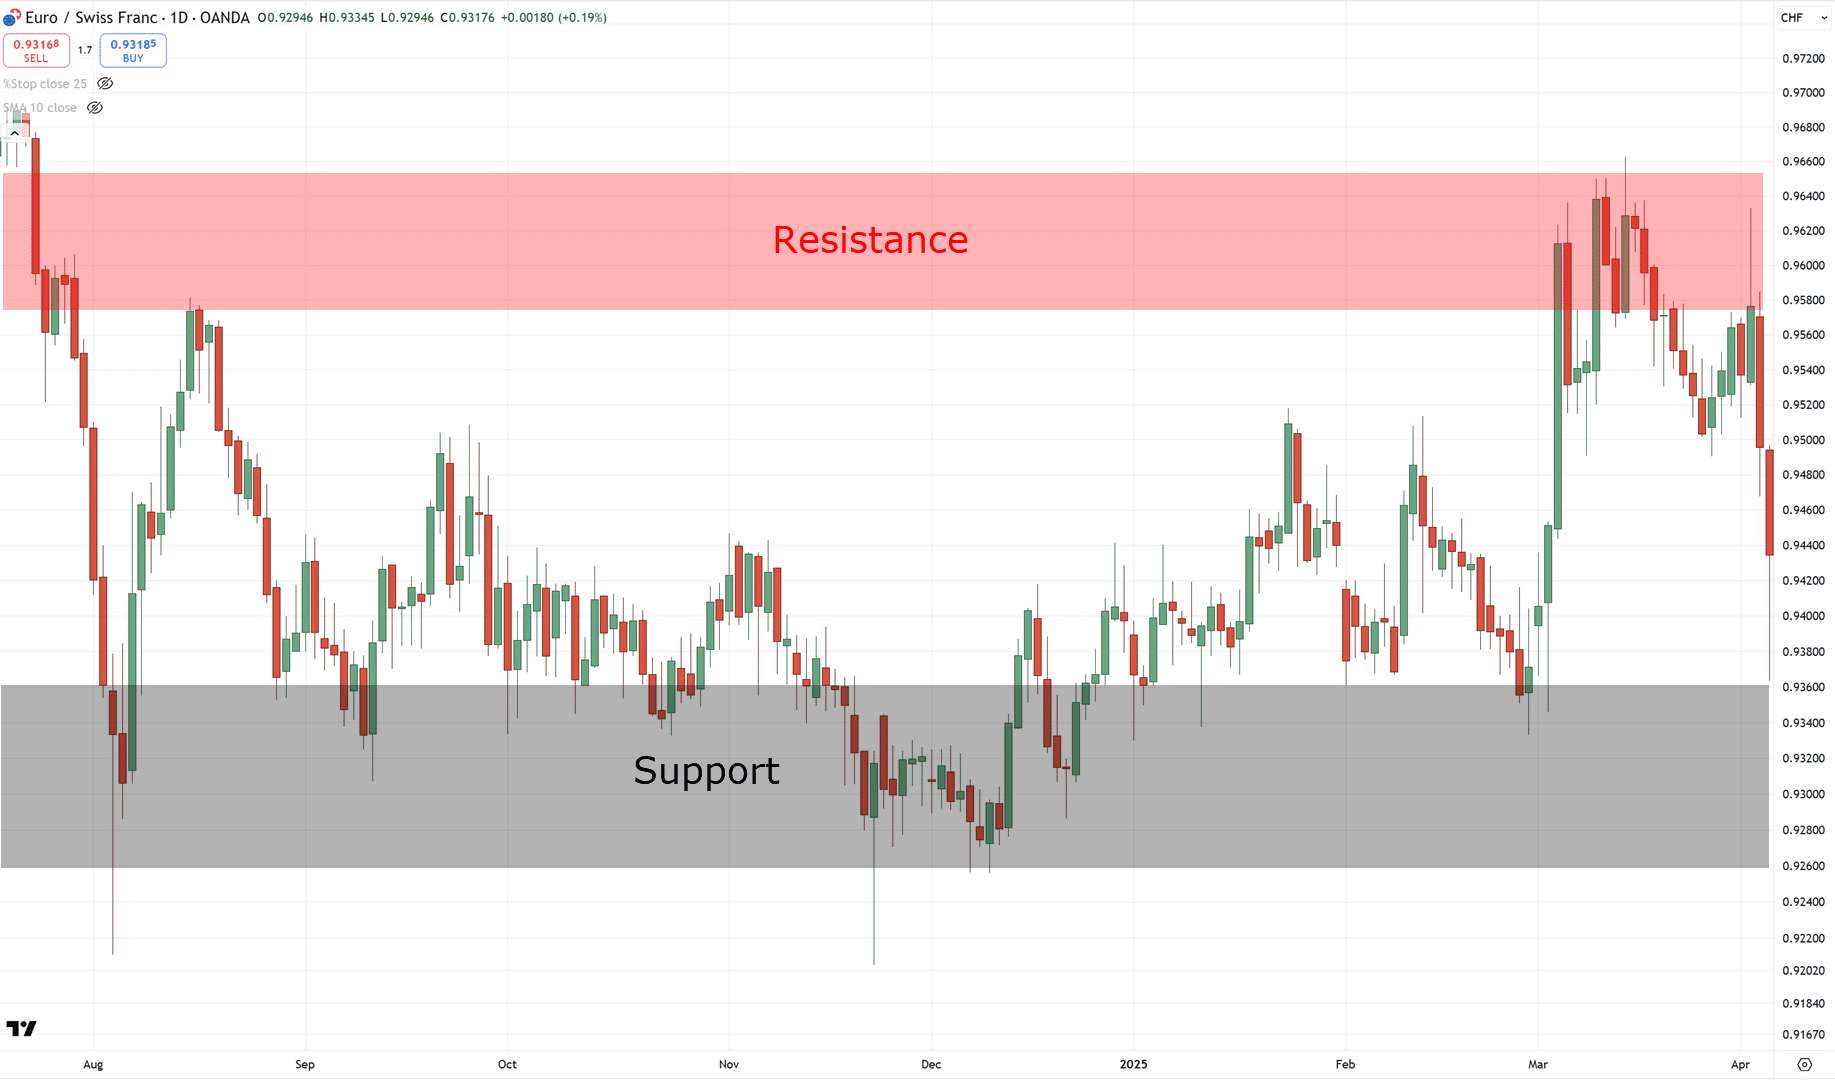
So, what if we simplify instead?
Let’s say you only buy whenever the price makes a 100-day high…
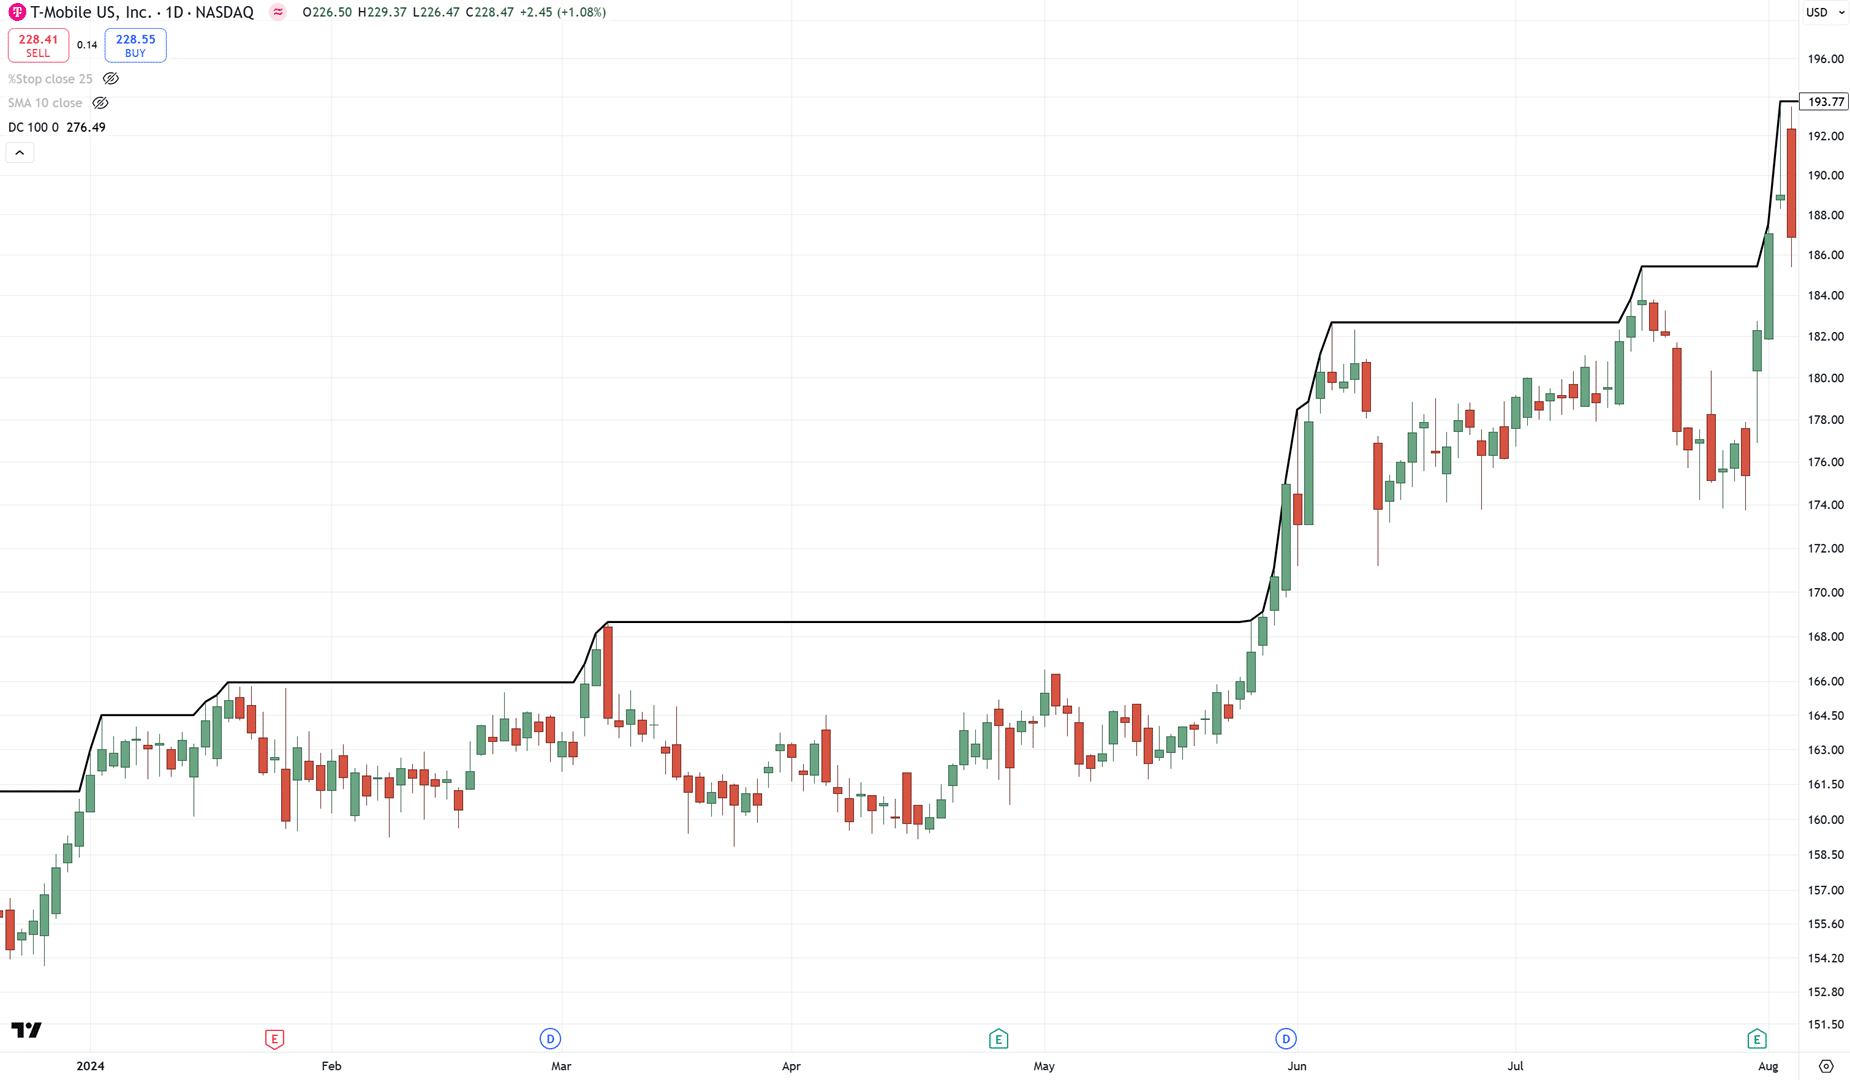
…can you plot on the chart how many times you could’ve entered?…
Well, there’s no mistaking it.
Because I’m 90% sure both you and I would’ve plotted the same…
And even if you showed it to three more people, the results would most likely remain the same.
As you can see, there’s consistency!
But I’m sure you’re thinking right now:
“Does it work?”
Well, here’s the good news…
The consistency makes it far easier to test reliably and accurately.
In fact, it’s that consistency which makes it a true “system.”
As it’s all black and white.
And that is what we’ll be focusing on for the rest of this guide.
Of course, entries are just one part of the strategy….
What else do you need to keep “systematic” when building a profitable trading system?
Let me show you…
The Profitable Trading System Checklist
One crucial aspect is defining your rules.
While building a profitable trading system is more than just indicators, you need these parts nailed down:
- Market Selection
- Indicators
- Entries
- Position Sizing
- Exits
Let’s do a quick rundown, shall we?
Market Selection
Well, if all you do is buy stocks and crypto based on tips and rumors…
Then you bet you’re going to have inconsistent results!
So, make sure you adopt a market selection rule.
It forces you to look for markets to trade consistently and as systematically as you can.
Indicators
Charts can often become very cluttered, can’t they?
This is where a lot of traders fail.
You must categorize the indicators that you will use.
For example:
One indicator for your trend filter (if ever).
One indicator for entries.
One indicator for your stop loss.
One indicator for your exits.
Just one for each!
Ensure that each indicator complements the chart.
Entries
Building on our earlier example, this is where you can apply a simple “if this, then that” thought process.
For example…
If the price closes and makes a 100-day high, then you enter a long position at the next candle’s open.
If the price closes below RSI 30, then you can enter a long position at the next candle’s open.
No ambiguity here!
The same concept must apply to other indicators as well.
Position Sizing
This basically falls under risk management.
If you trade stocks, you’re likely using portfolio allocation.
However…
When trading CFDs or dealing with leverage, a common position sizing method is to risk 1% of your capital per trade when the price hits your stop loss.
If you want to learn more, check it out here.
Exits
Keep exits in line with being as “systematic” as possible when building a profitable trading system.
You can’t say:
“I’ll exit my trade once the price hovers below the area of resistance.”
“I’ll exit my trade once the candle makes a break of structure.”
Maintain the If-This-Then-That approach…
If the price closes below the 50-period moving average, exit the trade at the next candle’s open.
Don’t deviate.
There are hundreds of paths to building a profitable trading system.
While the checklists I share with you make sure you’re going in the right direction, you’re certain to find many systems out there that may not even work in the markets…
…and that is normal!
Building a robust system takes time.
But what if I told you there’s a shortcut?
After all, there’s no need to reinvent the wheel.
Don’t worry, everything you’ve learned so far still applies.
Check it out.
The RETT Framework: Your Key to Building a Profitable Trading System
The RETT framework stands for:
- Read trading books that contain backtest results
- Extract the trading concepts
- Test the trading system
- Tweak the trading system
Let me explain.
Read trading books that contain backtest results
The first part of this framework alone will save you hundreds of hours of experimentation on what works and what doesn’t.
Why?
Simply put, it positions you to stand on the shoulders of giants.
Here are some excellent examples to get you started:
- Following the Trend by Andreas Clenow
- Unholy Grails by Nick Radge
- Mean Reversion Trading Systems by Howard B Bandy
The best part is that it doesn’t have to be only books anymore.
You could just as easily gain knowledge from articles or research papers!
The key point is that they must contain a complete, profitable trading system that works in the markets.
Extract and understand the trading concept
Crucially, you never want to take any backtest by others for granted.
Sure, it’s invaluable information.
But you want to make sure you also look beyond the numbers, too.
Ask the most important questions:
- What are the core principles behind this trading system?
- Why does it work?
- When does it underperform?
- Is this something that will suit me?
Never forget that you will be entrusting your hard-earned money into the system!
And that’s the whole point of understanding how the trading concepts work.
If you don’t understand the strategy, how can you trust it?
Test the trading system
Here comes the (somewhat) tricky part…
…backtesting the strategy yourself!
However, this is where you start making the system your own.
It enables you to verify whether or not the numbers you saw are legit and part of a profitable trading system.
There are multiple ways to test this, and I’ll share more details with you in the later section.
But at the end of the day, you essentially need to keep these things in mind:
- Backtesting platform
- Data source
- Code for your trading system
Can you see how what you saw earlier comes into play?
It really highlights the importance of keeping your strategy as systematic as possible.
No fundamentals, no support and resistance, no trend lines, no ambiguity.
All black and white and systematic!
Now…
The goal here is to achieve at least 80% similar to the results you saw in the book or article.
It’s unlikely you’ll get 100% the same due to different data.
However, if your own personal backtest is largely similar to the profitable trading system you saw in the book, then you’re just about ready to go!
Well, almost…
Tweak the trading system
This is the best part – tweaking the strategy to your needs!
It’s exactly why you need to nail down the “E” in the RETT framework, to extract and understand the trading concept.
If a trading system is understood well enough, changing an indicator setting should not break it.
I’ll give an example.
Let’s say a system uses a 20-period moving average to trail your stop loss…
But you tell yourself:
“Ah man, this trailing stop loss is too tight.”
“I want to increase the trailing stop loss so my trades last a bit longer.”
What should you do?
You increase your trailing stop loss to a 50-period moving average…
If that “profitable” trading system breaks down and starts losing, then there’s a high chance that the strategy will stop working as soon as market conditions change.
Make sense?
By carefully following the RETT framework, you can start tweaking the trading system according to your risk appetite.
It shouldn’t affect the whole strategy just by placing new indicators!
Understand it, test it, and then polish it.
So now, do you want to see a complete example of how the RETT framework, well, works?
Let me show you!
The RETT Framework: A Profitable Trend Following System
You should absolutely go through the whole process of verifying this system on your end.
After all, that’s the whole point of this guide!
At any rate, here’s how I went about it…
Read trading books that contain backtest results
The book that I’ll be referencing is Andreas Clenow’s Following the Trend.
It’s an amazing read as it also goes behind the psychology of what it means to be a trend follower.
From the title, you can probably guess that I’ll be using a trend following system!
Extract the trading concepts
The principle behind trend following boils down to this:
- Trade in the direction of the trend
- Buy high, sell higher (or sell low, cover lower)
- Trail your stop loss so you can ride the trend
- Trade a variety of markets to increase your odds of capturing a trend
- Risk a fraction of your capital so that losses are minimal
There are other trading methods, such as mean reversion and momentum, but in this case, I’ll be focusing on trend following.
You likely know that trend following systems profit when markets are trending (obviously)…
…and they go into a losing streak or drawdown when markets are ranging.
But always make an effort to understand when your strategy works and when it doesn’t.
Reduce the number of surprises!
Test the trading system
You can use the same trading system that was shared in the book or come up with your own (as long as it goes along with the concepts of Trend Following).
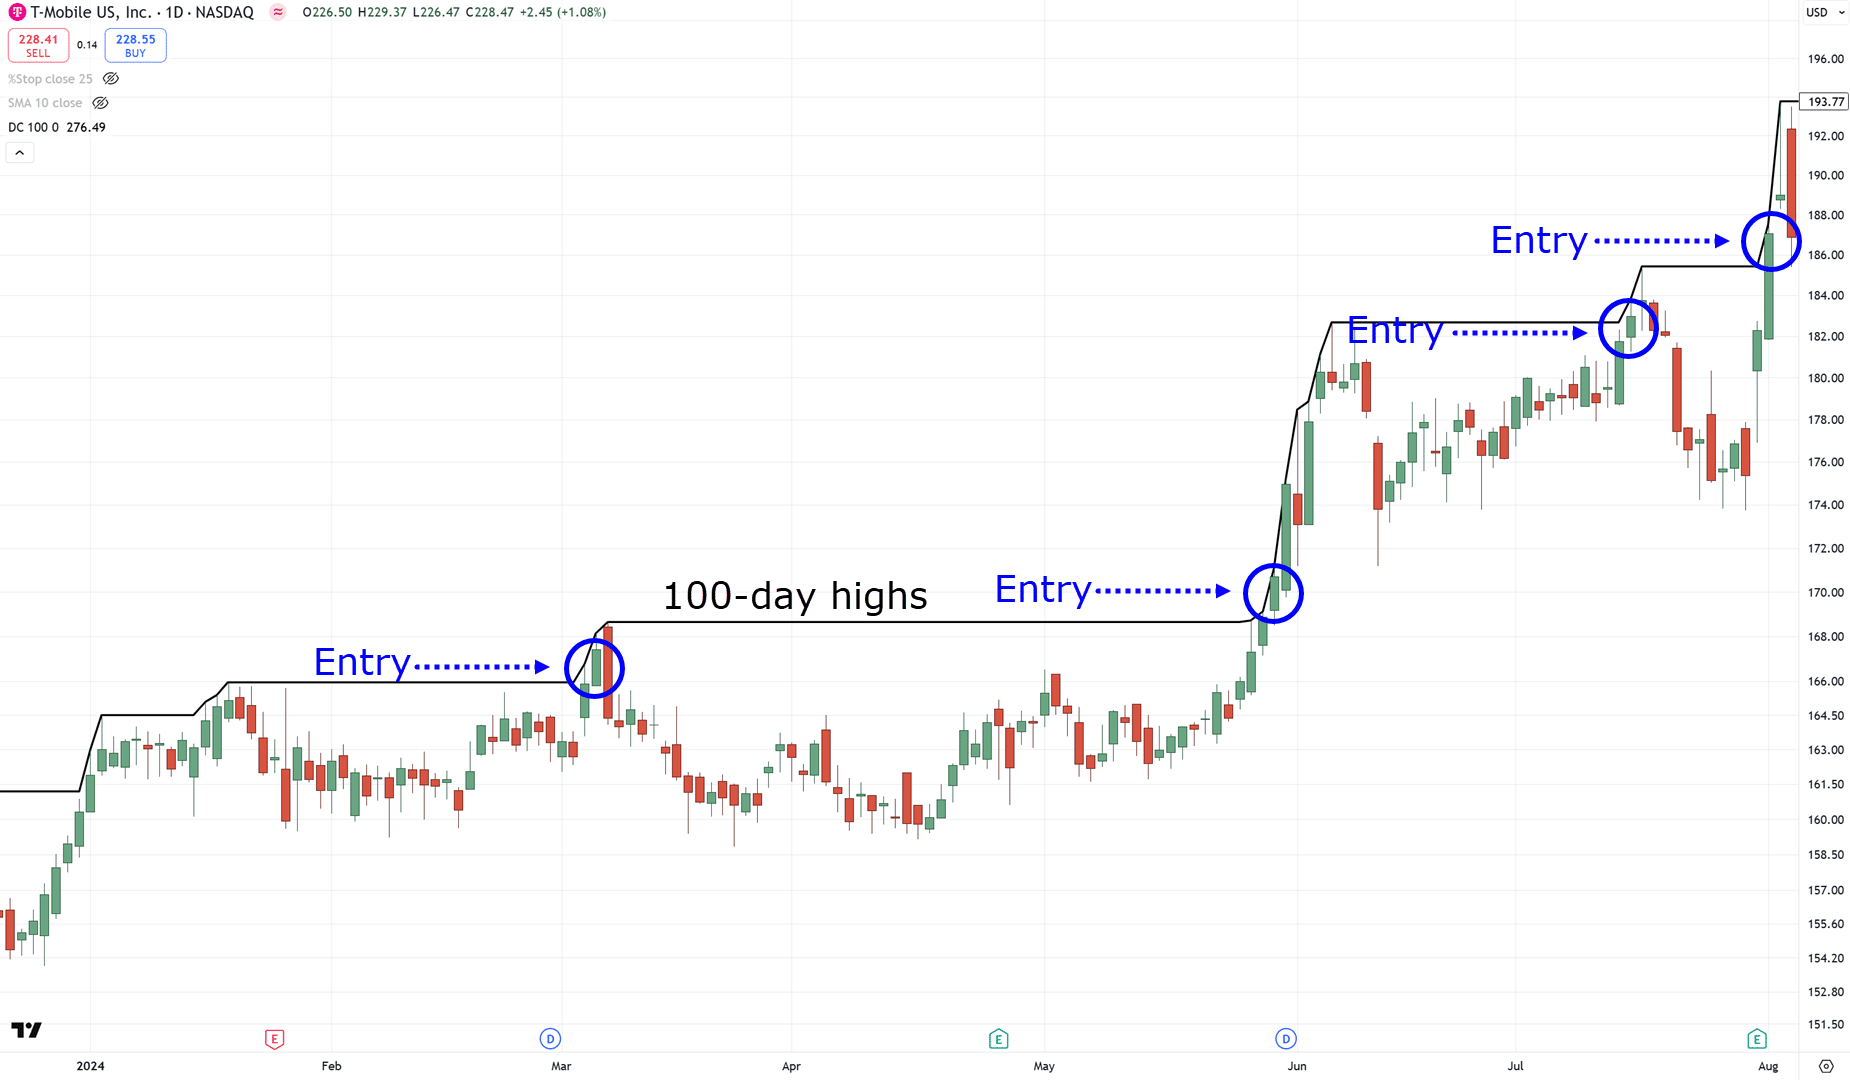
So, here’s a Trend Following system I came up with…
The Rules (long):
- Go long when the price closes at its highest over the last 50 days
- 3 ATR is your trailing stop loss
- You risk 1.5% on each trade
The Rules (short):
- Go short when the price closes at its lowest over the last 50 days
- 3 ATR is your trailing stop loss
- You risk 5% risk per trade
Markets traded:
- Gold, Copper, Brent Crude Oil, Platinum, Natural Gas
- USDJPY, AUDUSD, NZDUSD, EURUSD
- China A50, Nasdaq 100, Canada 60, Hang Seng Index 30, France 40, S&P 500
- Canada Bond 10YR, Euro BTP, US T-Note 5YR
- Soybean Meal, Feeder Cattle, Corn, Soybean, Soybean Oil, Rough Rice
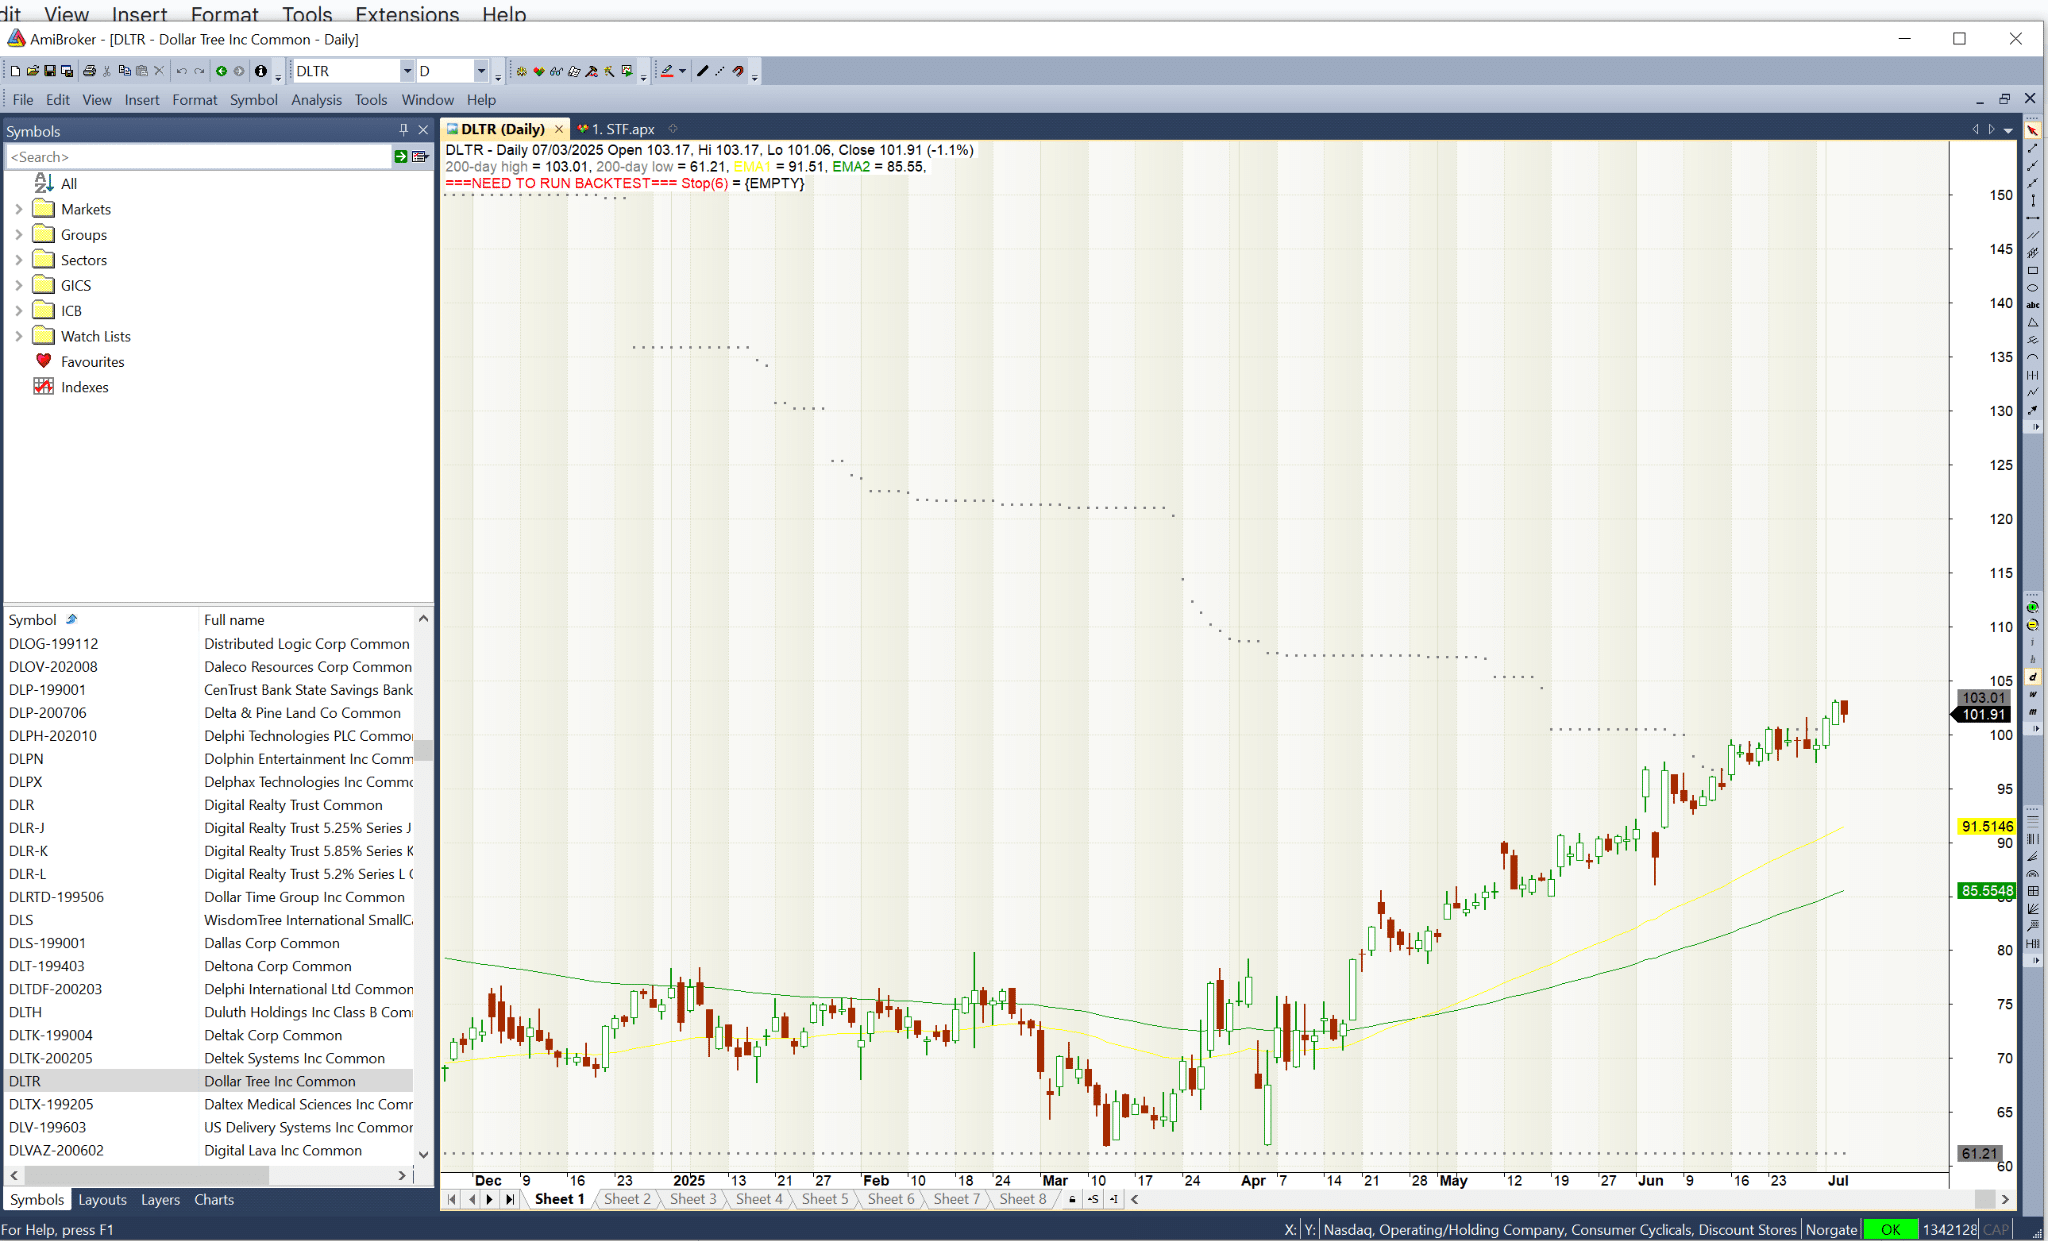
And just so we’re clear, here’s how the strategy looks in a chart:
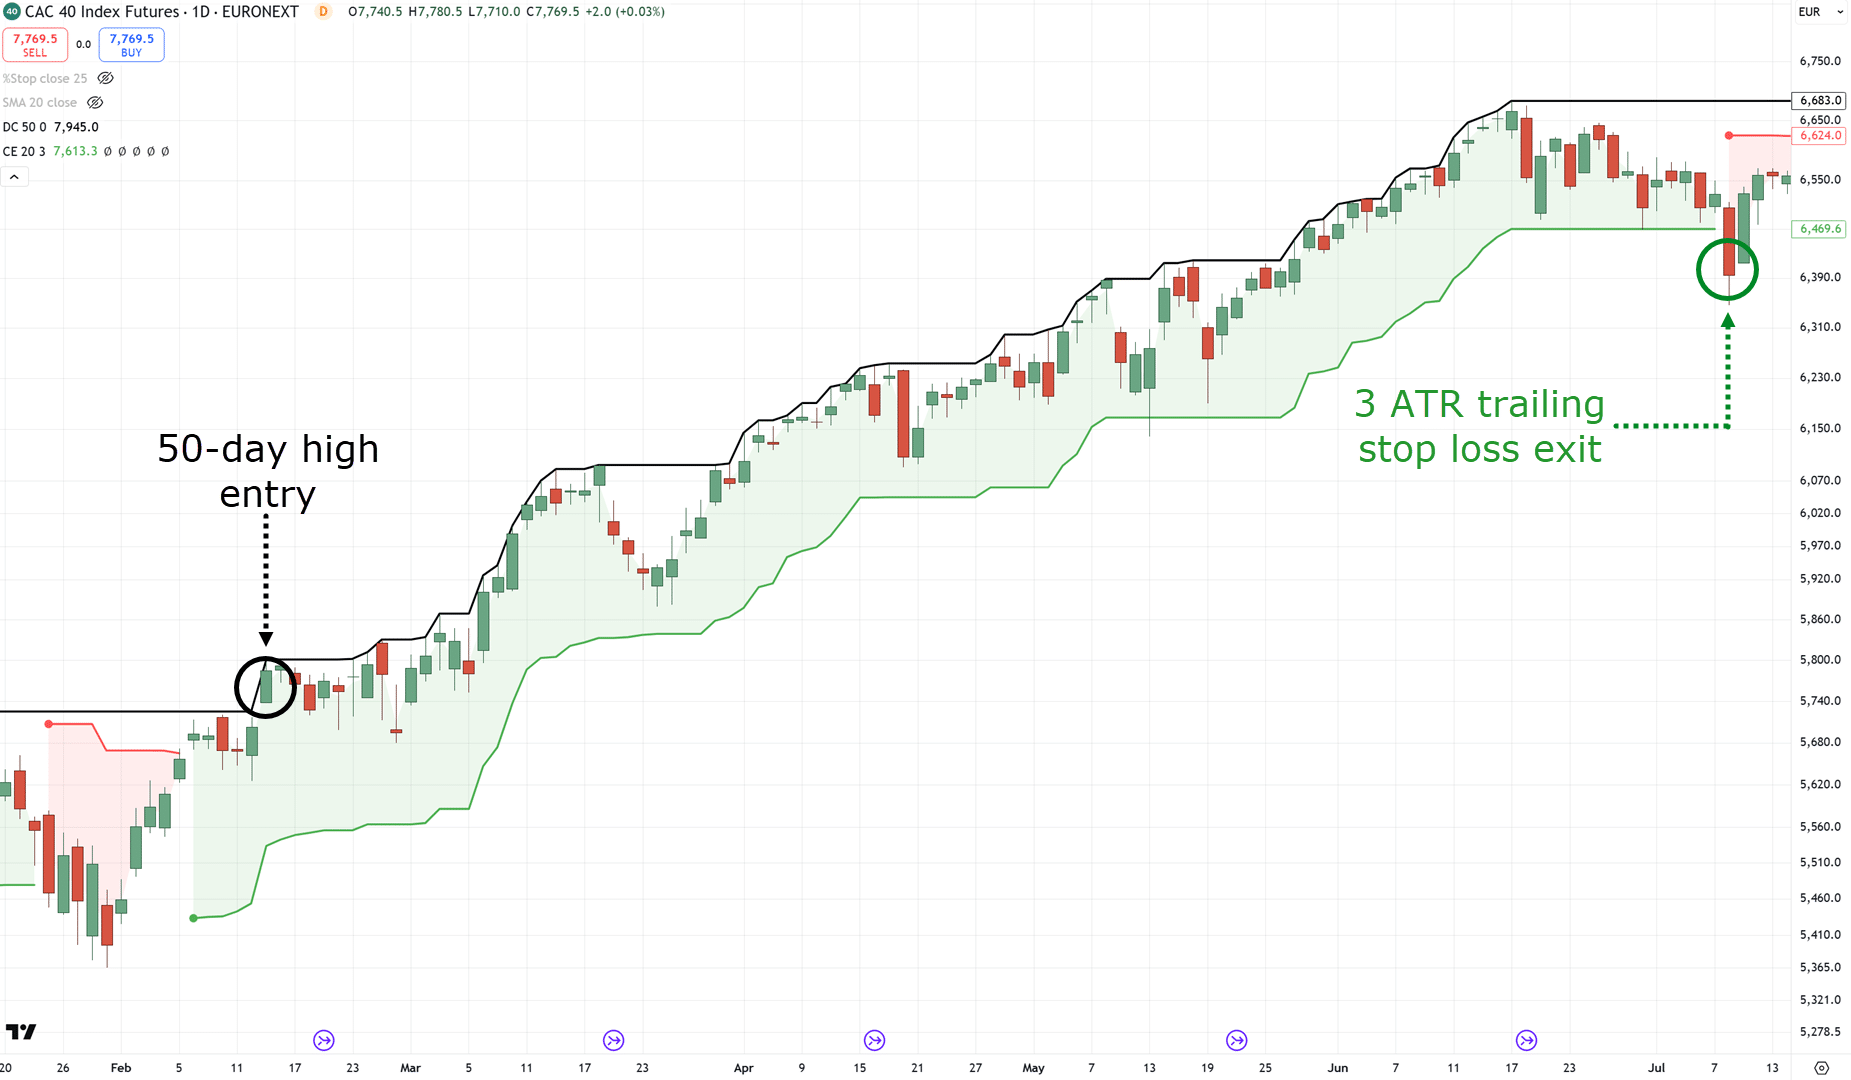
And here’s another one for shorts…
These are cherry-picked charts, so there will be losses!
But the point is to show you what the strategy looks like on the charts so that you know what to visualize on.
Finally, we use the 50-day donchian channel as well as the 20-period ATR multiplied by 3 via the chandelier exit indicator.
Got it?
Moving on…
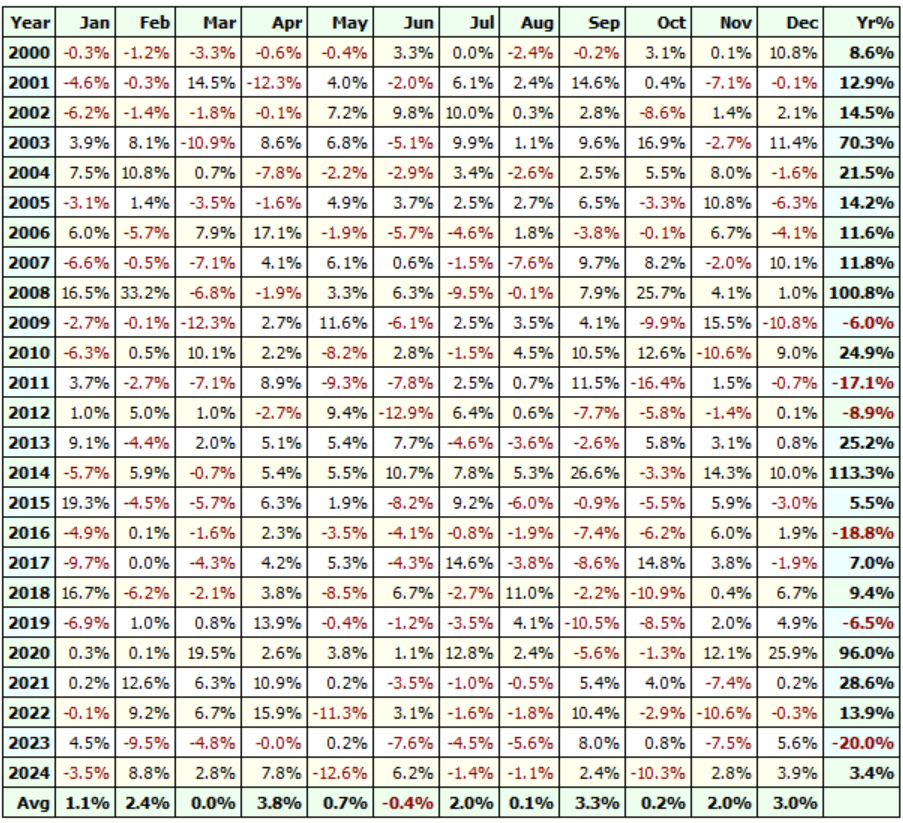
The backtest period is from 2000 to 2024. That’s 24 years of data, including the dot-com bubble and 08-09 financial crisis.
Results:
- Winning rate: 34%
- Average gain to loss: 20
- Annual return: 16.21%
- Maximum drawdown: 38%
Here’s the breakdown for every month and year…
And finally, the equity curve…
 profitable trading system")
Tweak the trading system
I know…
…that 41% drawdown must have been pretty rough, right?
But the fact is that the system has an edge in the market, even through the financial crisis.
Here’s the good news, too…
You can tweak the system to super-charge your returns, such as:
- Increasing the markets on the list
- Increasing the ATR value
- Increasing the 50-day high or low entries
Since the system is robust, it would most likely still work even if you change the indicator settings.
But finding which settings work best for you is up to you to tweak and test out!
Now, let me show you how you can start backtesting on your own…
Which Backtesting Platforms to Use on How to Build A Profitable Trading System
In this final section…
I’ll split it into three parts on how you can get started on building your profitable trading system:
- Backtesting platform
- Data source
- Programming
Each section deserves an article by itself, to be honest!
But since this guide is designed to cut your learning curve in half, I’m giving you the essential overview.
Got it?
So, first…
Backtesting platform
The platform that I use to backtest my strategies is Amibroker…
What makes Amibroker powerful is not its charting capabilities.
It’s much more about how it can backtest across multiple markets at the same time!…
As a result, you get a much more balanced idea of how your portfolio will perform when you start trading your system.
Of course, there’s more to Amibroker than what I have just shared with you, but you have my core reason for using it now.
Another common backtesting platform that’s free and one that you’ve most likely used already is MetaTrader 4…
 profitable trading system")
While it’s certainly accessible, it’s not the best tool for portfolio testing.
You need to hit ‘backtest’ on each of the markets you plan to trade on, and then manually combine their reports.
But if you’re someone who focuses on the lower timeframes and you plan to focus on a few markets, then MetaTrader 4 can put you on the path of short-term algorithmic trading.
Now…
There are other backtesting platforms that I haven’t tried but heard good things about.
So, you can check out a couple more here:
Next up…
Data source
Between the three, this is the most crucial.
Because no matter what backtesting platform you use, you must have accurate data.
There have been plenty of cases where a strategy shows profit in free market data, but fails miserably on more accurate data.
Here’s a quick rundown on some of the data sources I recommend:
- Norgate Data – This is the data source I use for my own trading. It covers US stocks, Australian stocks, Forex, and Futures.
- CSI Data – This is another good data source to consider. It covers US stocks, Australian stocks, Forex, Futures, LSE, and Canadian stocks
- Tick Data Suite – The downside is that it only covers a few markets and mostly the forex markets; however, it provides very detailed tick data, which makes it suitable for testing and optimizing short-term trading strategies through MetaTrader 4 or 5
Now comes the final part of the equation!
Programming
This is where you’ll need to convert your trading system into a language the backtesting platform can understand.
(And also why I taught you to be as systematic as possible!)
As a result, this stage typically requires some coding knowledge.
So, if you’re familiar with programming, then you do have an edge.
And if you don’t?
Well, aside from learning how to code (which I do think is the best way to go about this), there are other options…
Hire a programmer
There’s a ton of programming languages out there, even more than backtesting platforms.
So, you must find a programmer who specifically specializes in the same coding language that your backtesting platform operates.
One way to do it is to hire someone through Upwork…

Admittedly, you could try to use ChatGPT to generate code…
But based on my experience, you already need to have coding knowledge to make that work.
While super basic strategies can be generated through AI, once you start adding risk management rules, trade management rules, and screener rules…
…it can quickly fall apart.
So, what if there’s a way you can generate trading strategies without learning how to code?
One option is eabuilder:
 profitable trading system")
It’s not free by any means, but it certainly does the job.
If you’re familiar with MT4 and you have a couple of custom indicators on hand…
Then you can upload those indicators and use them to help you develop a profitable trading system…
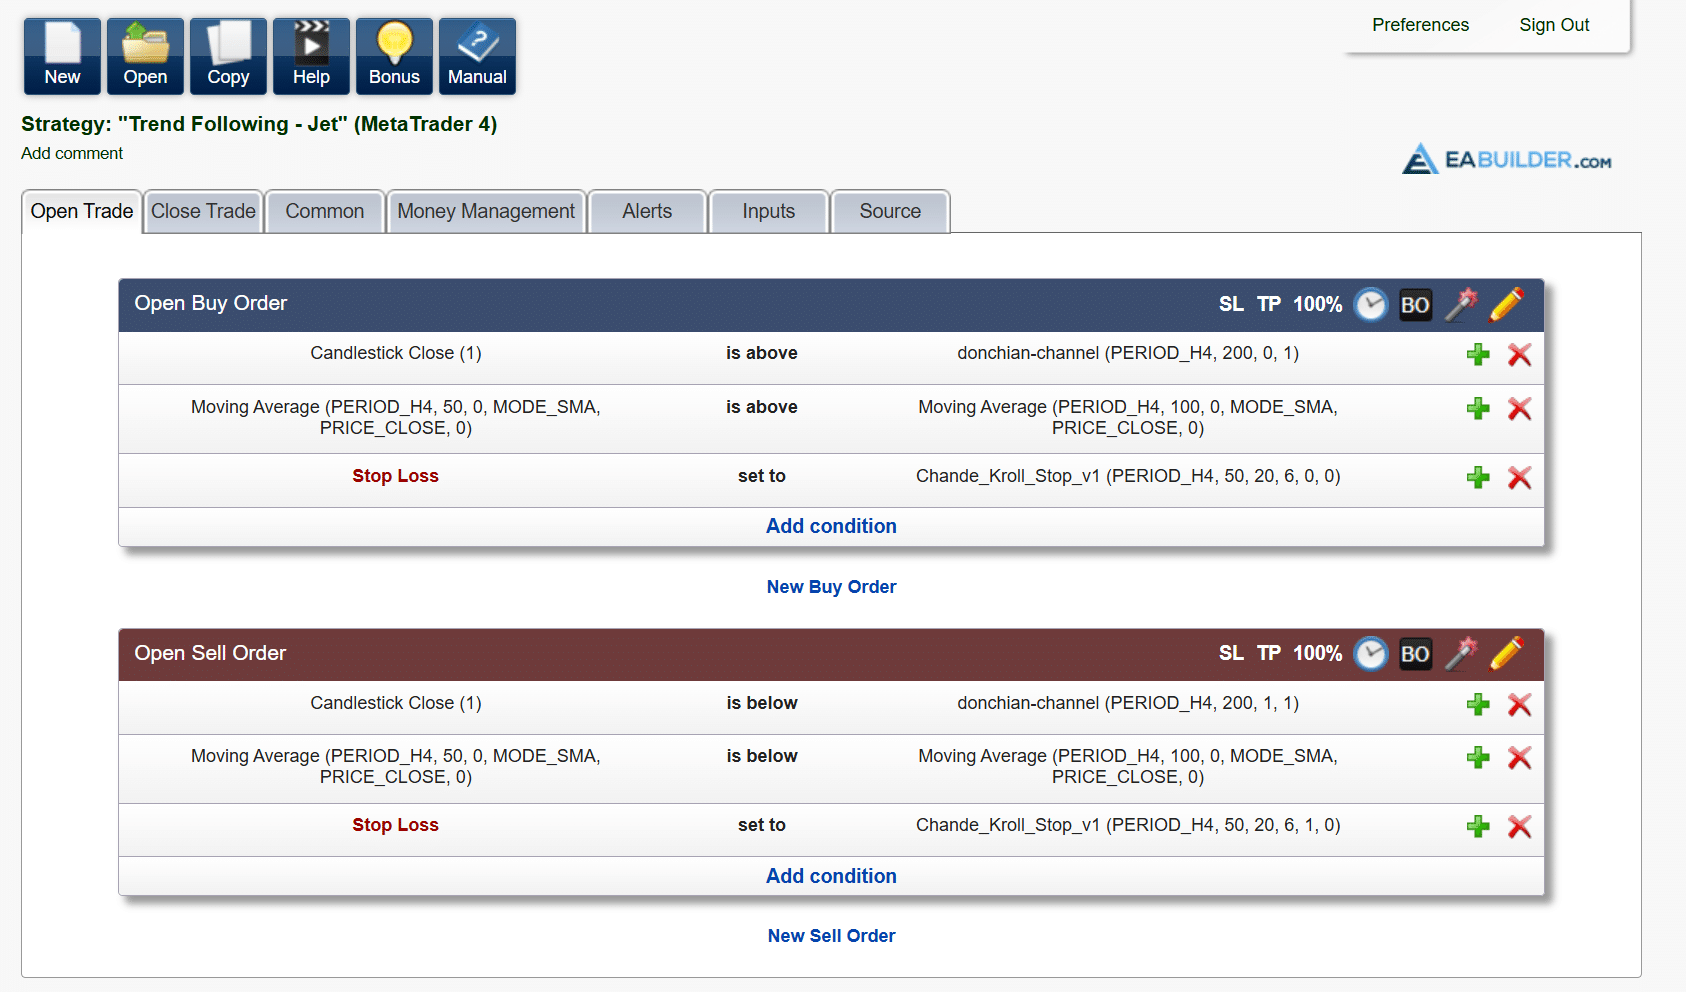
One downside is that it only supports MetaTrader 4, MetaTrader 5, and TradeStation.
It could save you a lot of time and effort, though!
So, that’s pretty much it!
A complete and full-context guide on how to build a profitable trading system.
With that said…
Let’s do a quick recap on what you’ve learned today.
Conclusion
Building a profitable trading system can be a laborious, long-term journey.
But it certainly puts you into an elite minority of traders.
Instead of endless trial and error, you begin using tools to understand which systems are truly effective and actually uncover how they work.
It’s a crucial step in your development.
Here’s what you’ve learned today:
- To build a profitable trading system, eliminate discretion with clear, rule-based strategies.
- Ensure your strategy includes market selection, position sizing, and indicators for entries, exits, and trade management.
- Use the RETT formula: Read, Extract, Test, and Tweak ideas to fit your style.
- Backtesting is key—have the right platform, data, and a method for developing your system, whether by coding it yourself or outsourcing.
With that said…
What are some of your experiences in trying to find that profitable trading system?
Is it your first time thinking about the difference between systems trading and discretionary trading?
How about backtesting platforms?
Are there other platforms you can recommend?
Let me know in the comments below!