
Like myself, perhaps the Bollinger Band was one of the first indicators you discovered at the beginning of your trading journey.
After all, it’s supposed to make everything super easy…
…just buy low and sell high, right!?…
Well, sure, there may be some lucky wins at the start.
But as time goes on… you start experiencing losses…
Worse yet, they can come along much more frequently with the Bollinger Band!
So, you stop using the indicator and probably start learning about RSI… moving averages…
…you start system hopping.
I’m guessing it may be a familiar scenario.
It was for me, anyway!
But, what if I told you there’s a provable way the Bollinger Band works consistently in real markets?
Not just in profits, but statistically, too?
Well, that’s what I’m about to show you in this guide.
Specifically, you’ll learn:
- A quick refresher on how the Bollinger Band works and how a lot of traders use it
- Timeless trading principles on how to build a working Bollinger Band trading system
- The rules of the Bollinger Band trading system and why they exist
- A complete metric of the results of the Bollinger Band trading system
You ready?
Then let’s get started…
How the Bollinger Band works and how to use it
The indicator pretty much consists of three things:
- Upper Band
- Middle Band
- Lower Band
Starting at the heart of this indicator is a 20-period moving average…
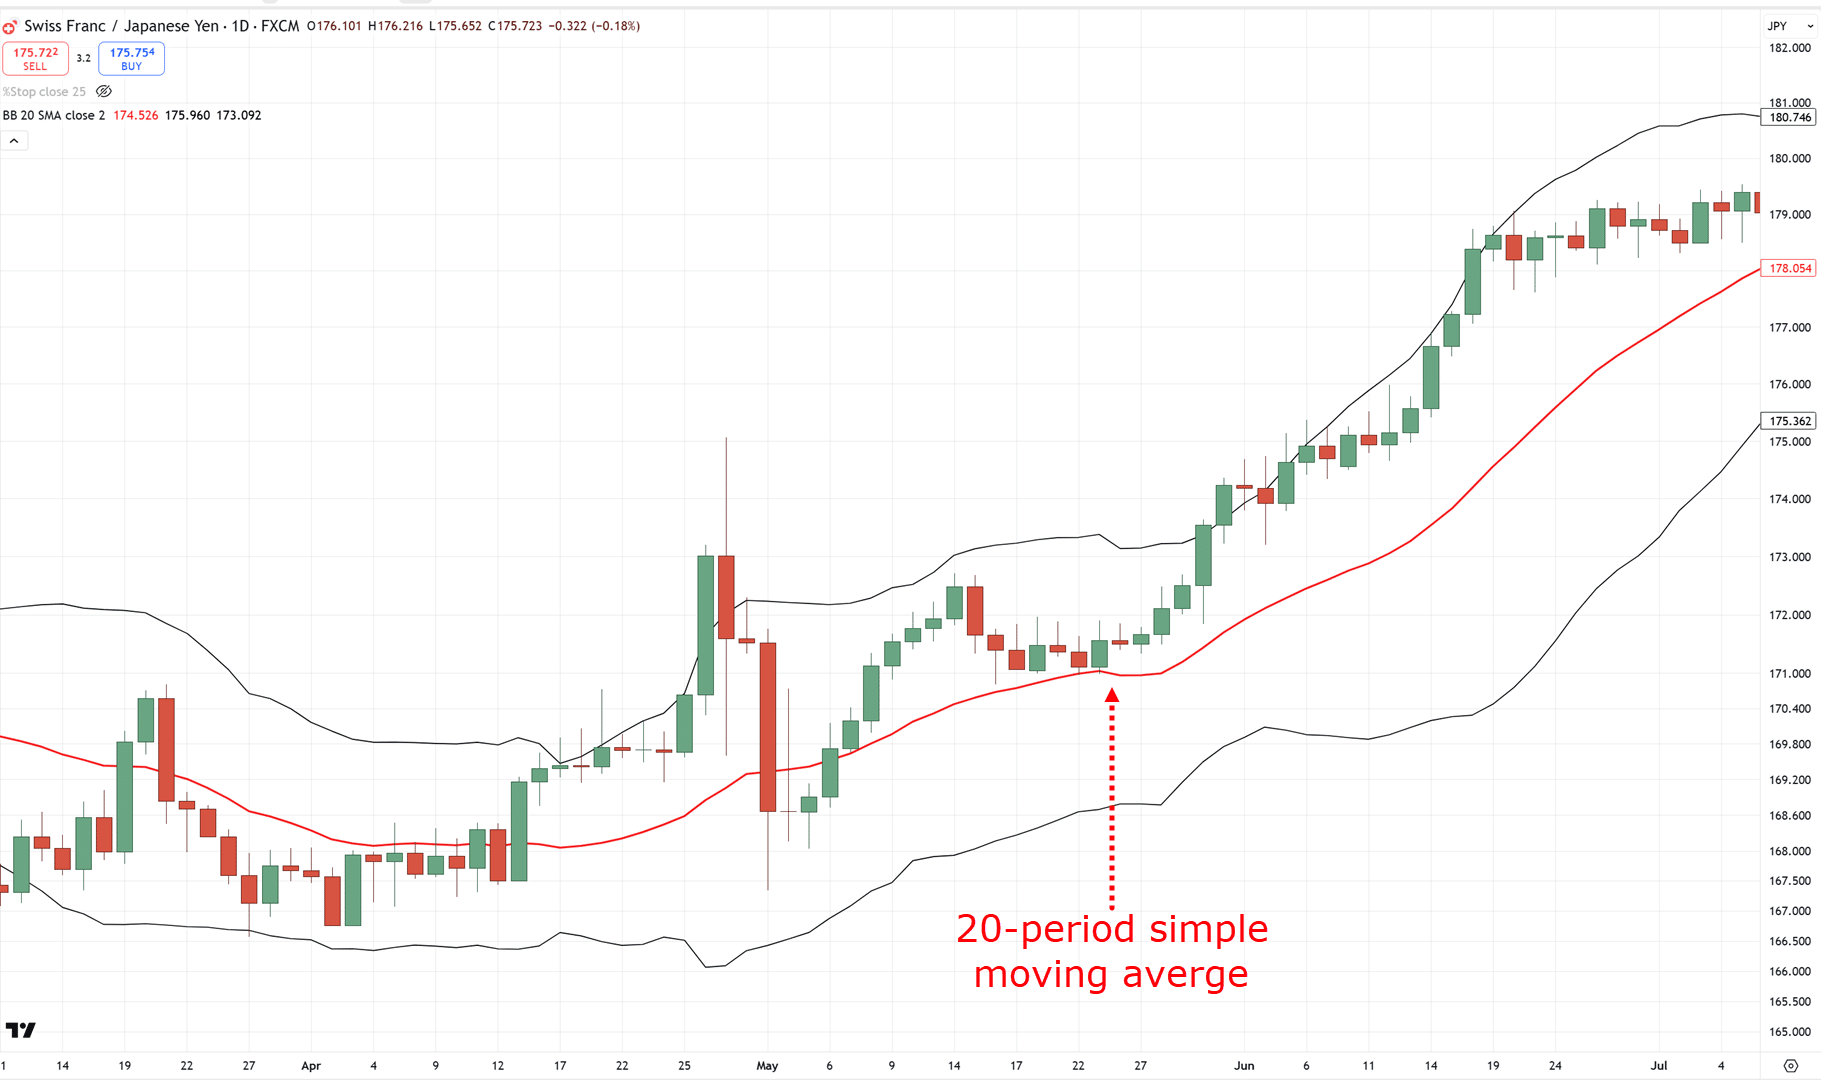
The indicator works by adding a standard deviation of 2 to the upper band and subtracting a standard deviation of 2 from the lower band…
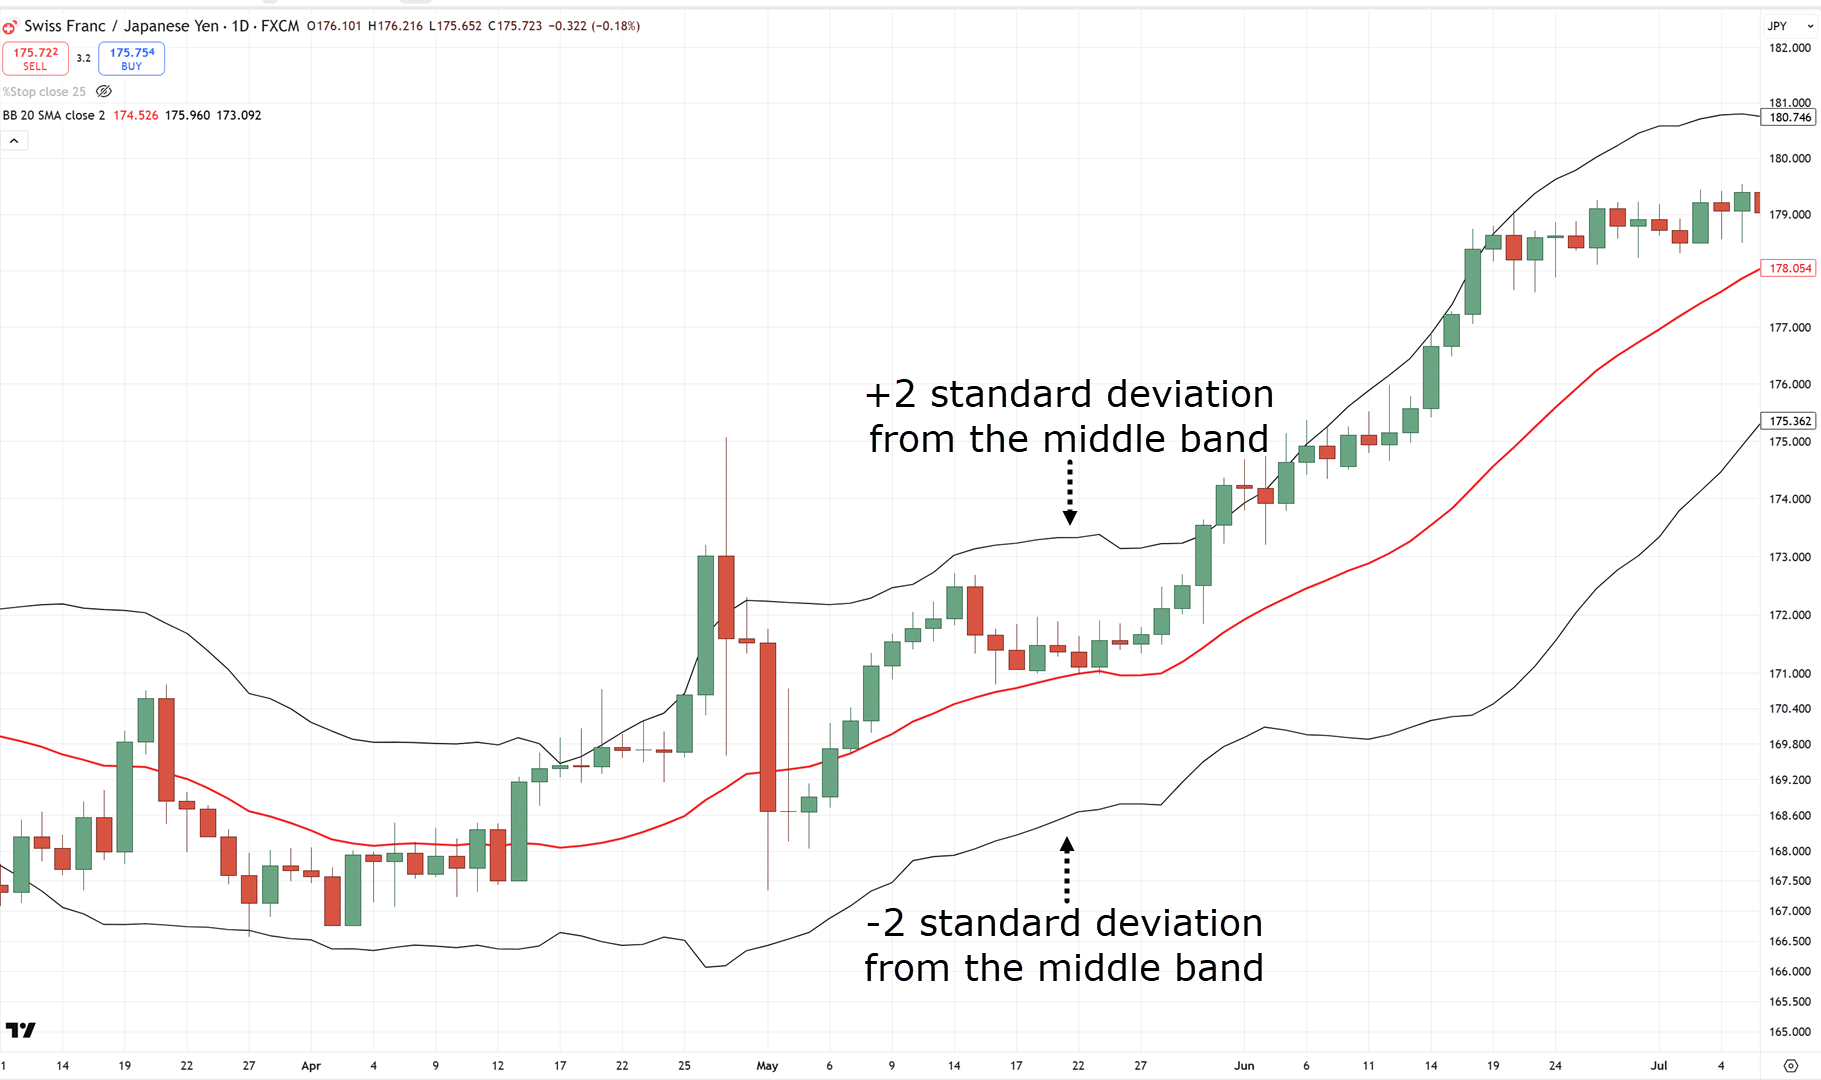
Basically, it adds “distance” to the moving average at the middle band.
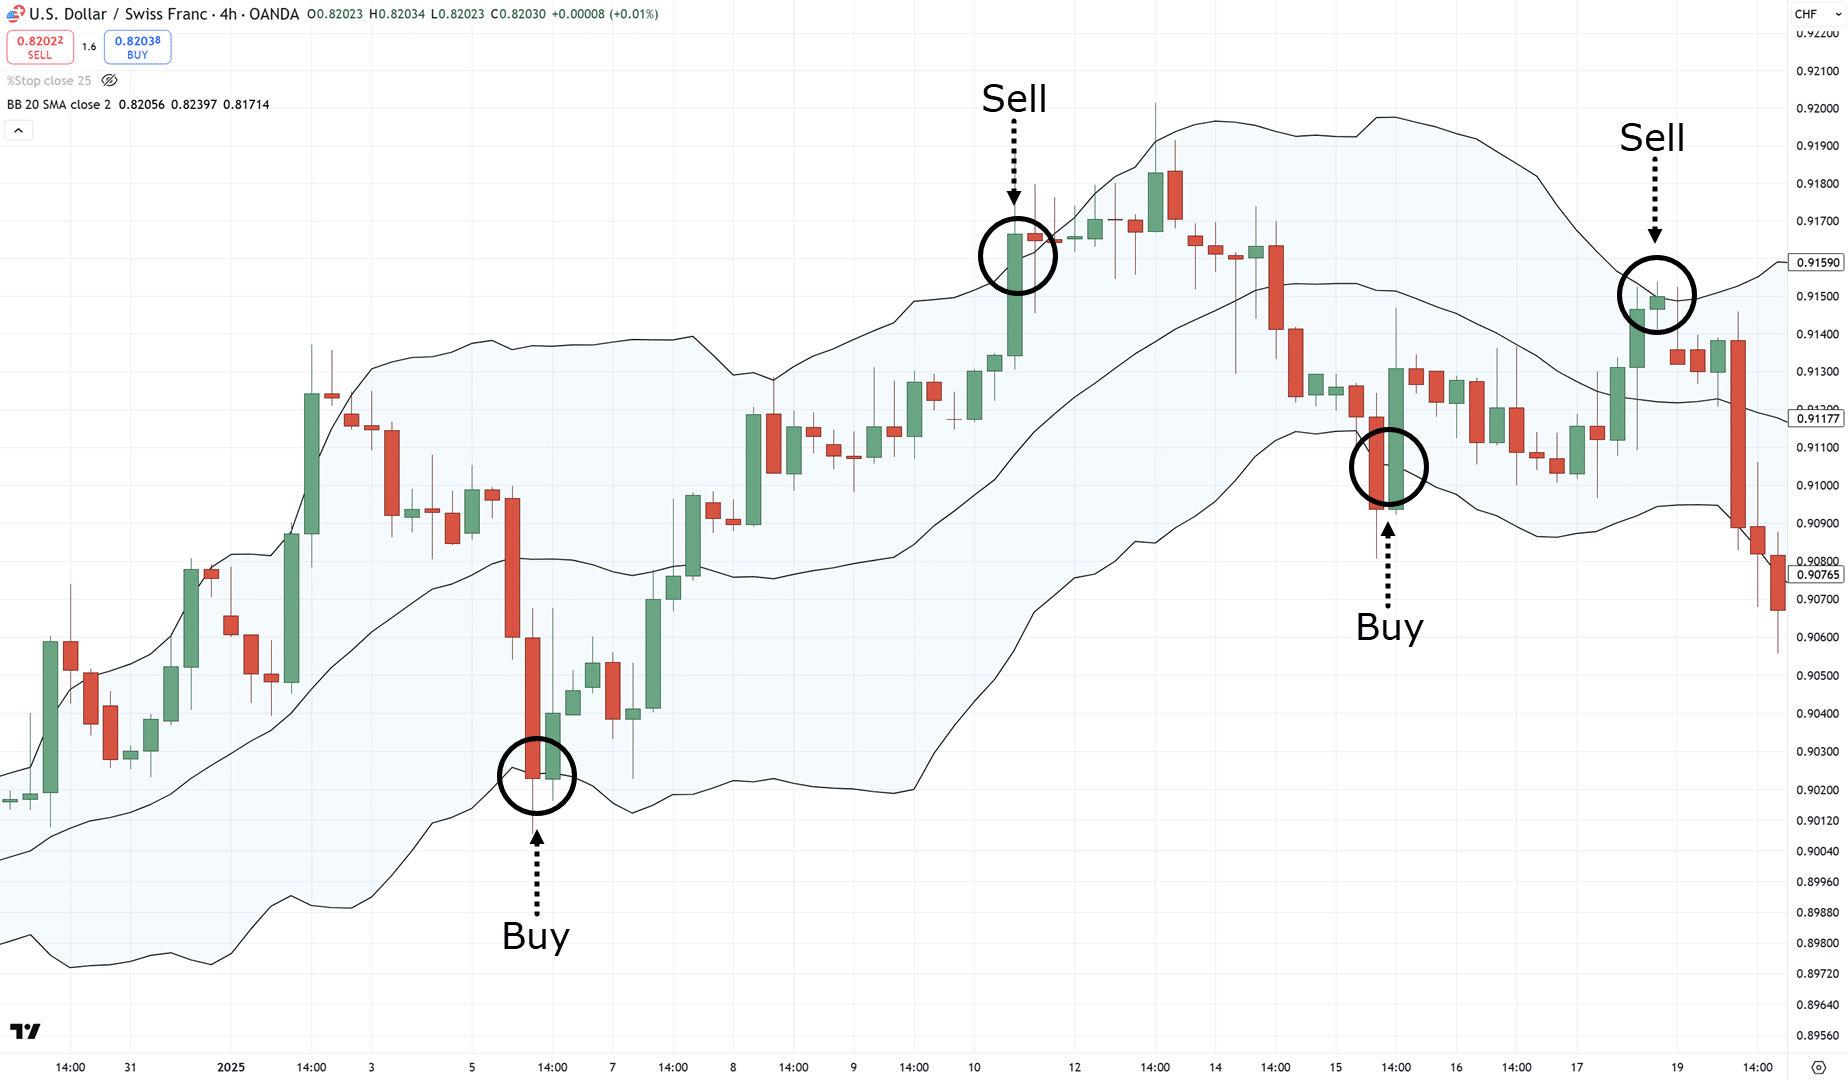
Now, how do traders interpret it?
Well, if the price is at the upper band, it’s considered expensive, and considered cheap when it’s at the lower band…
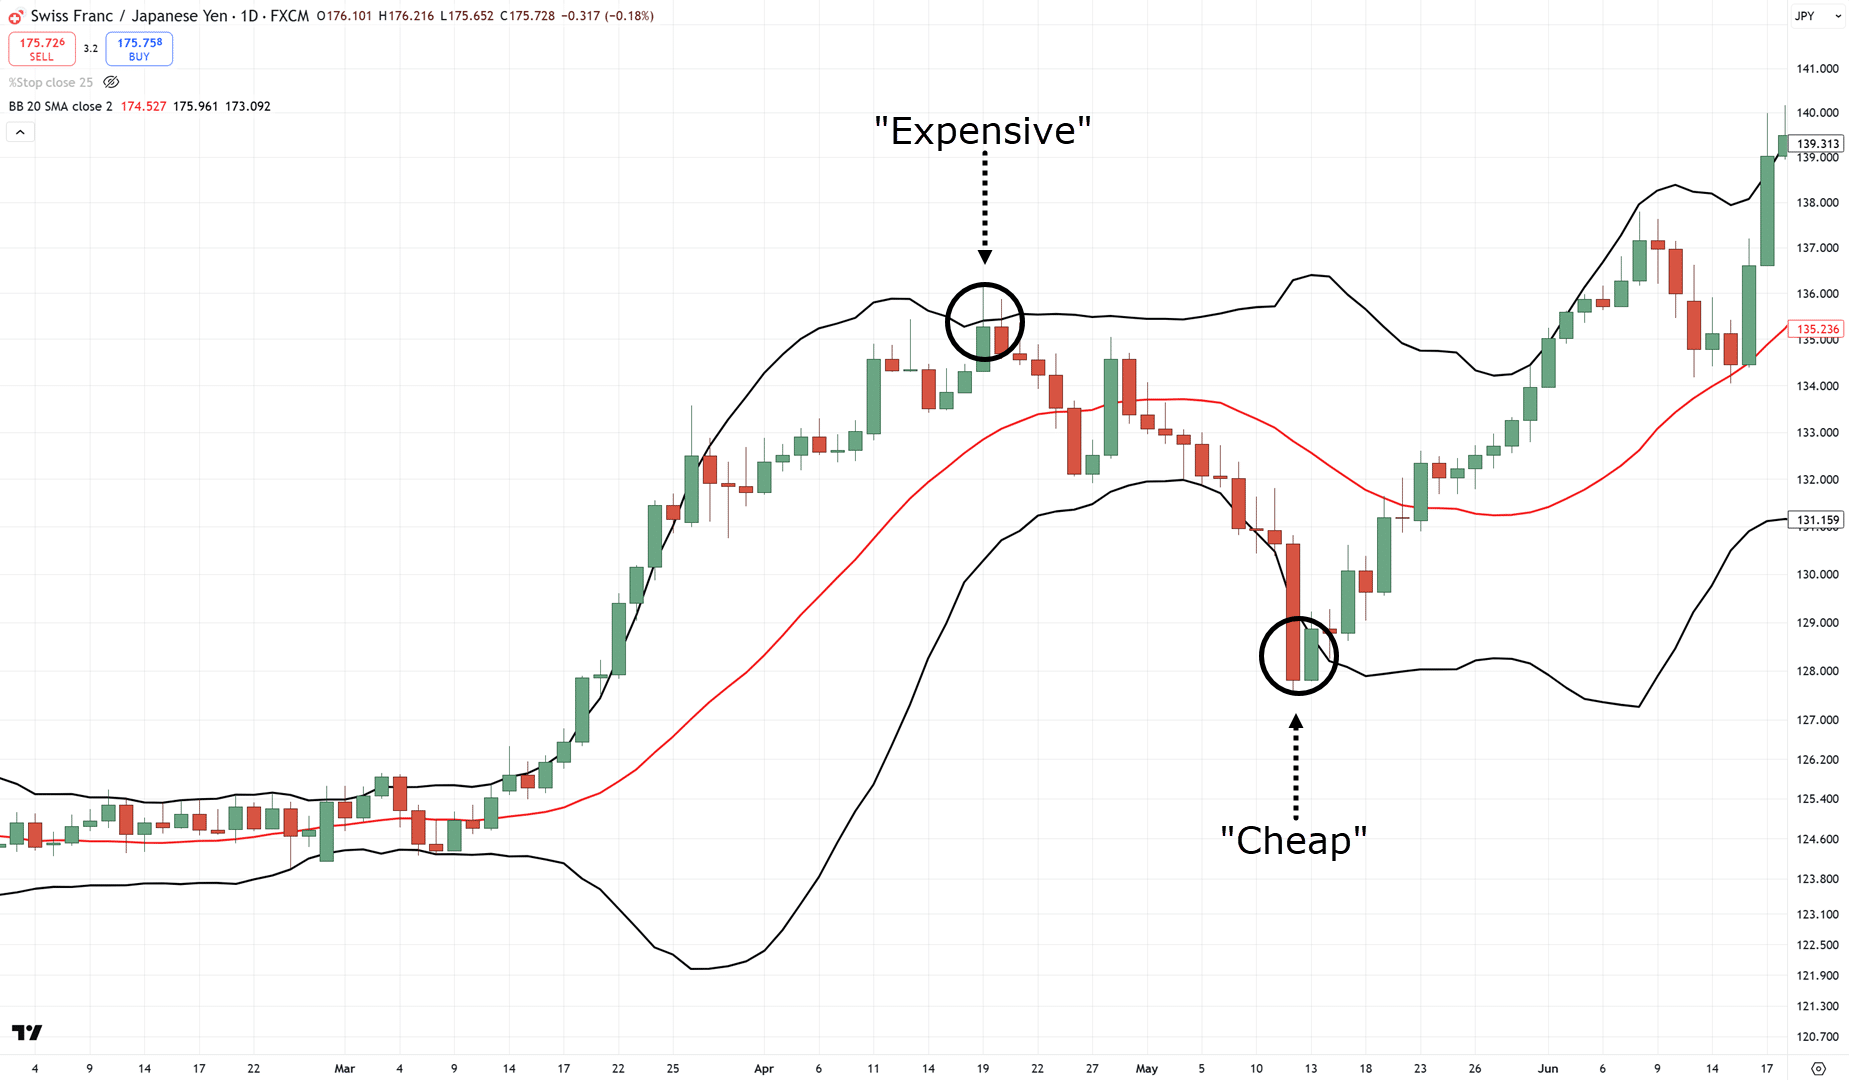
These examples can then be used to introduce a couple of strategies, such as “buying low and selling high”…
It’s essentially the textbook approach to using this indicator.
But, while it sounds great in theory…
…how does it perform in reality?
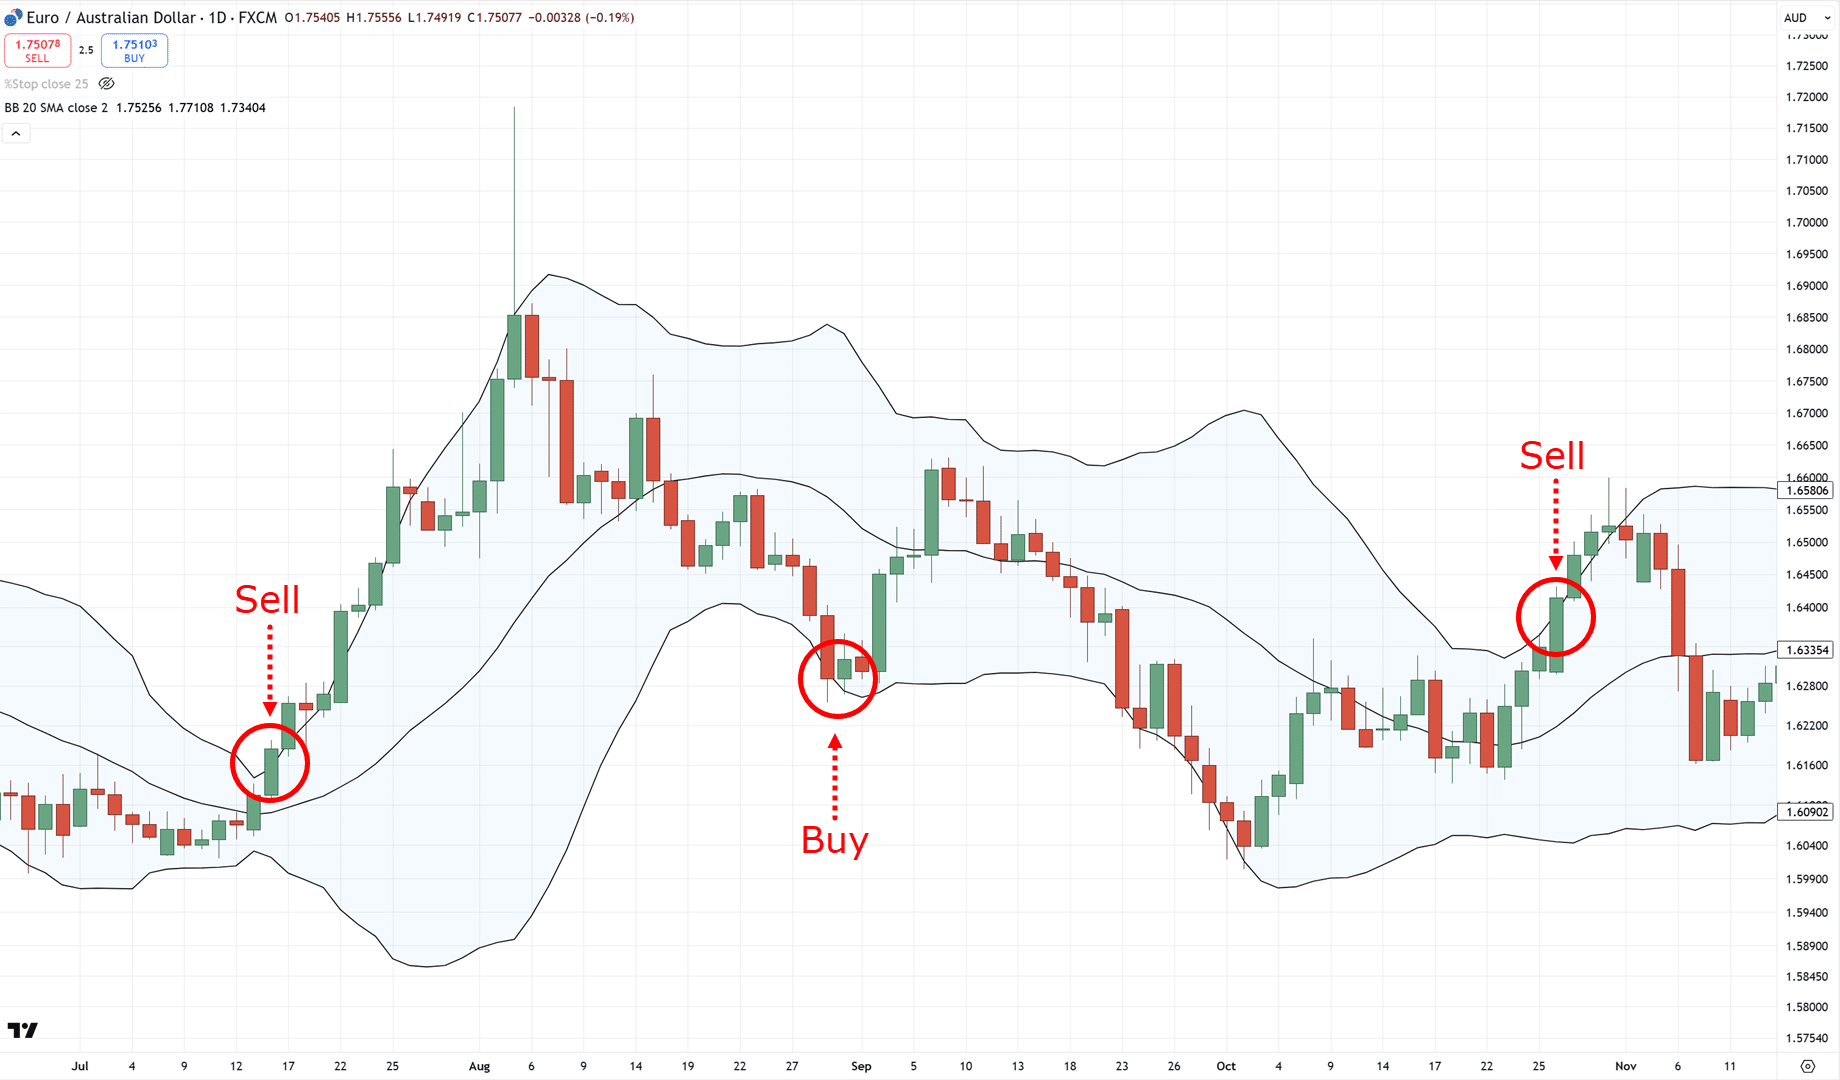
Hmm, not always in the way you’d expect!…
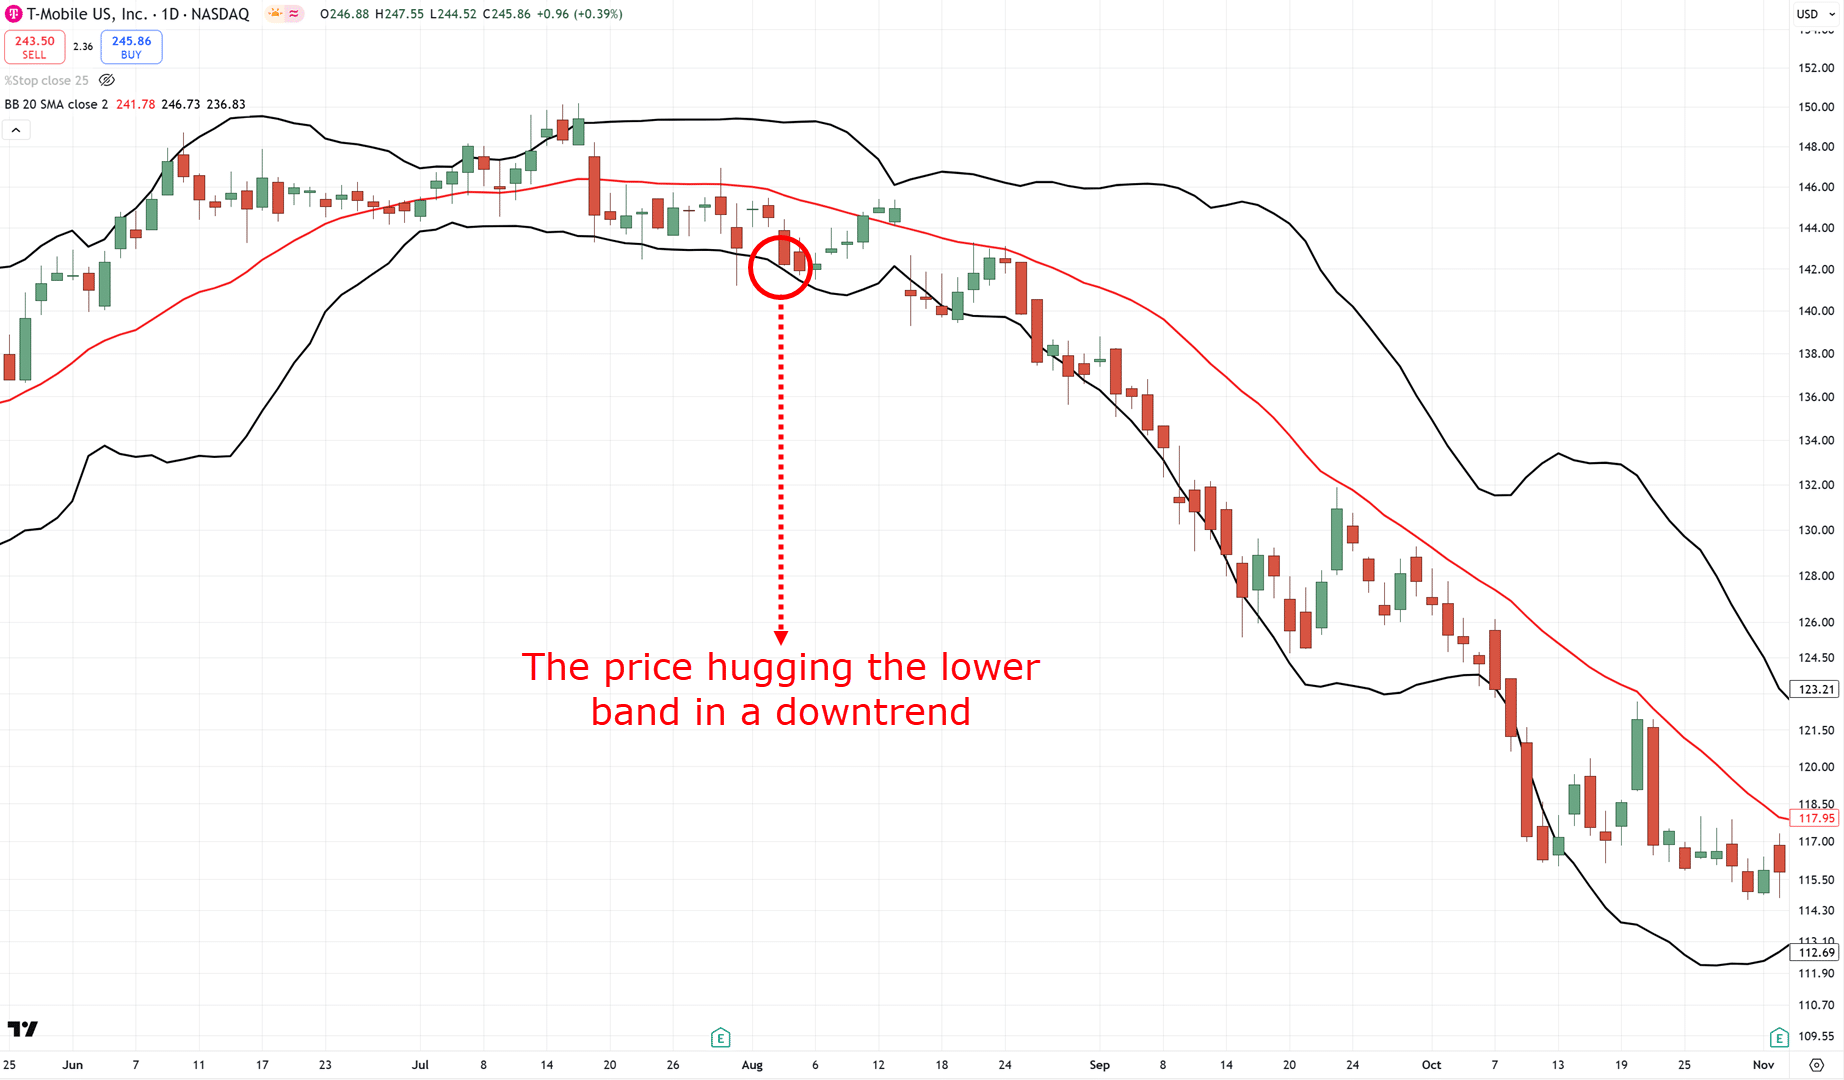
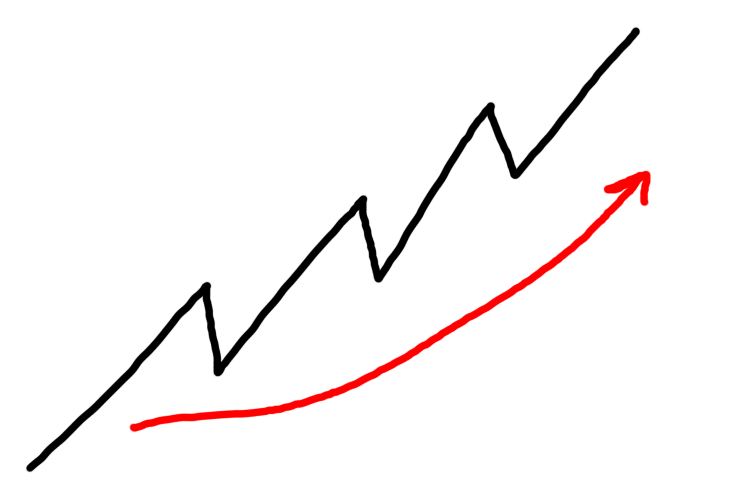
As you can see, in down trends, the price keeps getting cheaper and cheaper.
Imagine if you buy at the lower band and you’re still holding your trade, hoping that the price will bounce back higher… not a great time!
Which leaves you wondering again…
“What, if the Bollinger Band doesn’t work on trending markets…”
“What’s the point of this guide?”
“Does the indicator work at all?”
Well, indicators are only ever a small part of a working trading strategy.
If you focus solely on the Bollinger Band, you’ll miss out on how to integrate it into a profitable trading system!
Which is why in the next section…
…I’ll explain the foundation behind how the system I’m going to share with you made +7,605% over the last 30 years.
So, let’s take the first step on learning how this system works.
Basic rules and concepts behind the Bollinger Band trading system
Let’s get straight to the point, shall we?
The Bollinger Band trading system that I will share with you mainly trades stocks.
Why the stock markets?
The main reason is that the stock market can move like a tide.
This means that whenever the markets are in a bull run…
…hundreds of opportunities arise in the stock markets!
And this is what the created system works on: riding and taking advantage of those “tides” in the market.
Now with that said…
What kind of stocks are most suitable?
Most of the textbook examples of the Bollinger Band indicator look something like this…
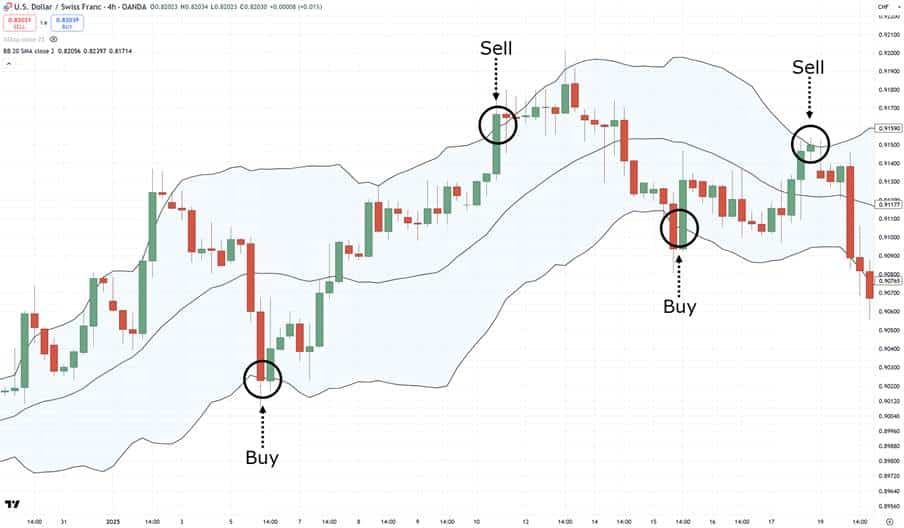
So they’re implying it’s an indicator best traded in a range.
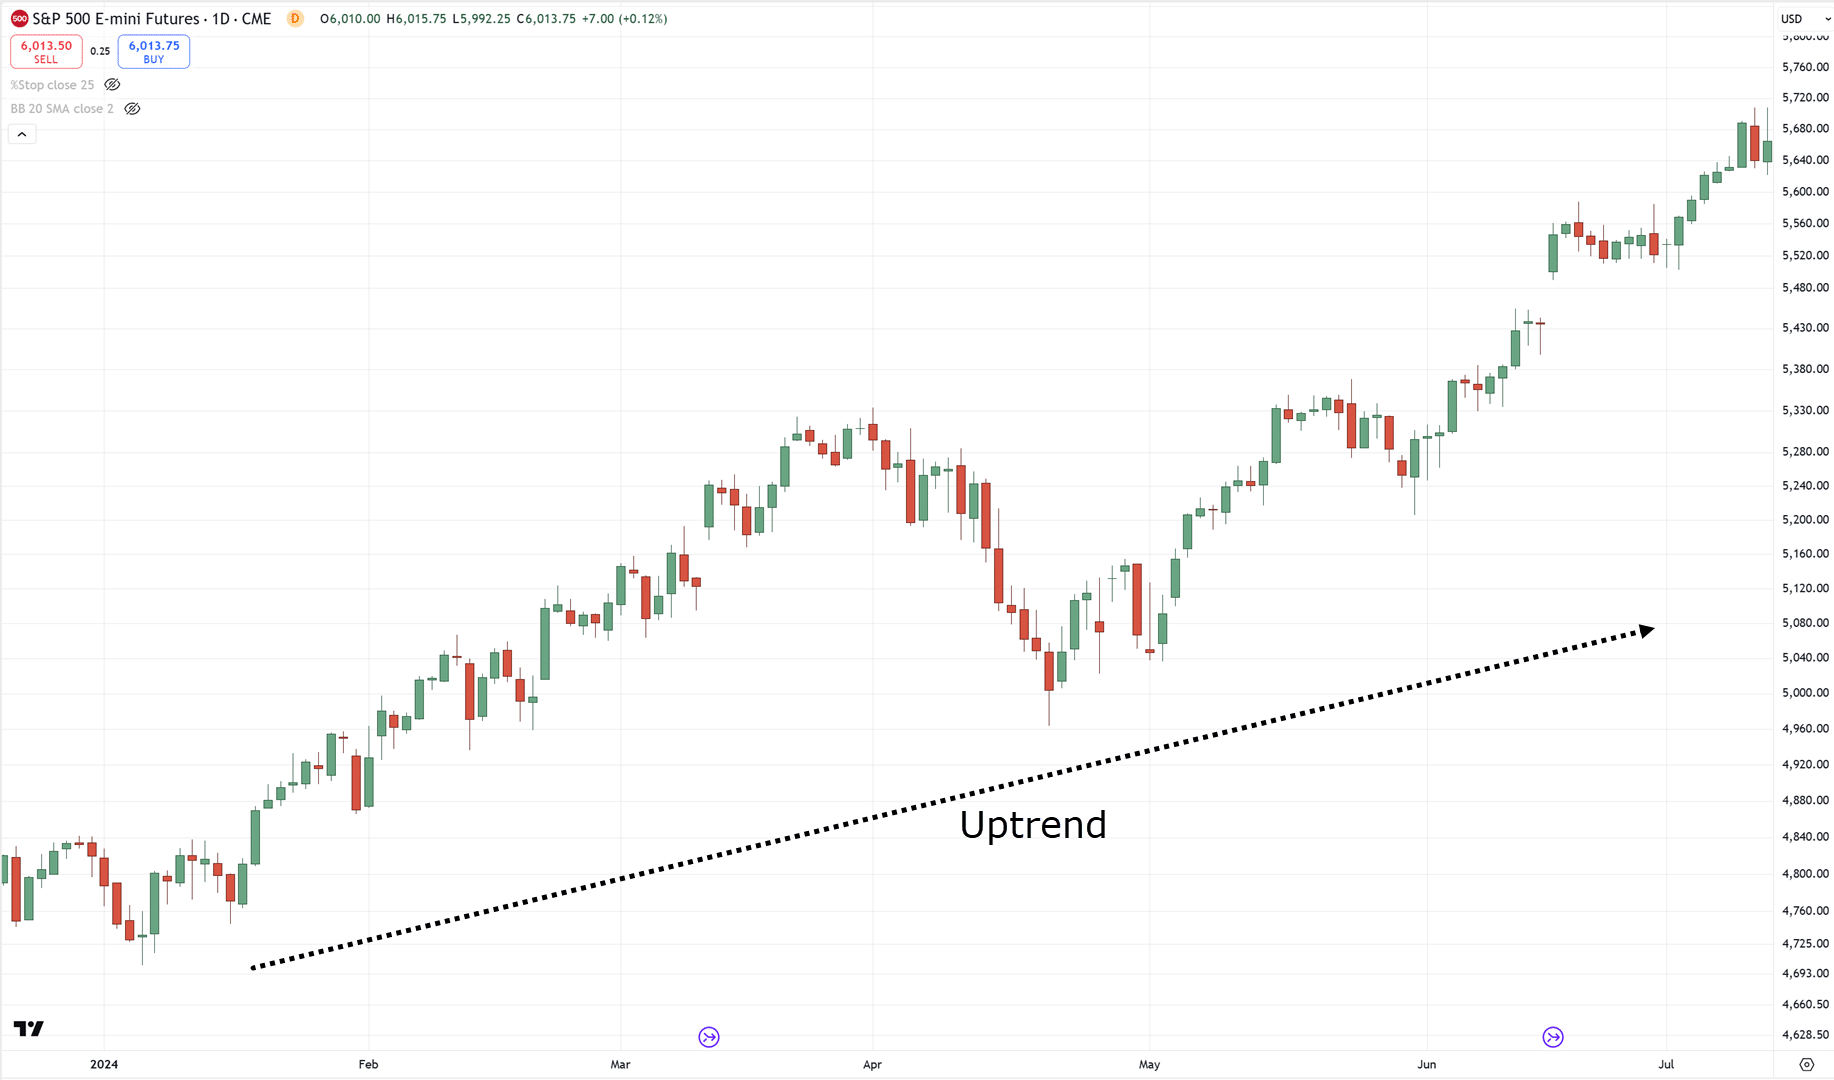
But what if the Bollinger Band could take advantage of an uptrend?
Well, let’s keep building up to that!
But for now…
Start searching for stocks that trend.
That’s right, not ranging stocks, but trending ones!
Why?
Because stocks that are in an uptrend are already likely to continue higher.
You want to hop in and bet on a leading horse!
And the best part is that whenever you spot a trending stock, it already means that the overall sentiment of the market in that stock is great.
As for how the company has been managed, or how consistent it is in its earnings growth…
…all (probably) priced into the chart already!
So now, with the stock chosen, what’s next?
How do you use the Bollinger Band, and why?
All indicators are tools – they are just one aspect of getting things done.
Don’t you agree?
The first question you must always ask is:
“What kind of setups are you looking to enter trades?”
Which, in this case…
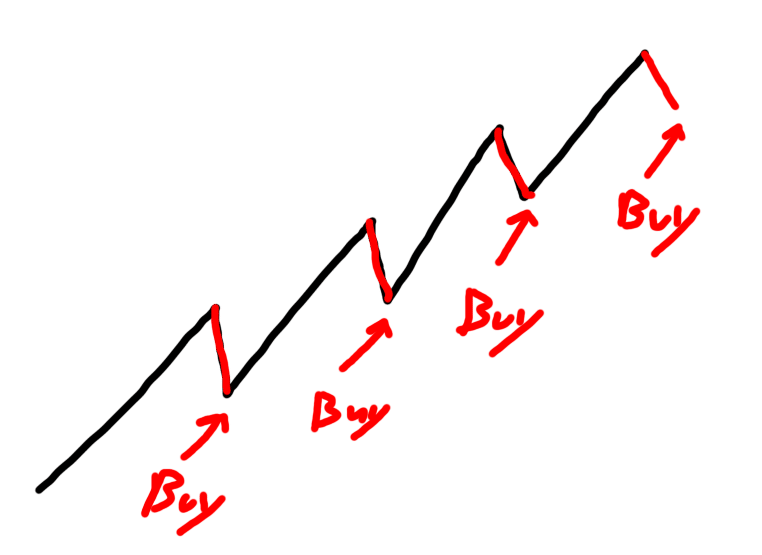
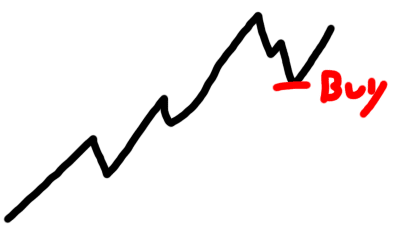
…it’s stocks that are trending:..
Importantly, you also want to look for pullback setups, so that you can “buy low and sell high” in favour of the overall trend…
With that well-defined, the next question you may ask is…
“Which indicator can help me find these setups and entries systematically?”
Now that is a great question.
Luckily, it’s going to be the Bollinger Band!
In what way?
Simply put, by entering pullbacks at the lower band on top of a trending stock…

Now, whether or not you use the Bollinger Band, it’s important to treat all indicators as a tool.
In creating any system, you should always keep your mind as structured as possible.
First, work out what setup you want to trade, then find the appropriate indicator to help you look for and enter those setups.
Make sense?
Good, because now comes the fun part…
The Bollinger Band trading system itself.
In the next sections, explore the complete rules of this system, as well as the results, so you can decide for yourself.
You ready?
Then let’s get on with it!
The complete rules of the Bollinger Band trading system
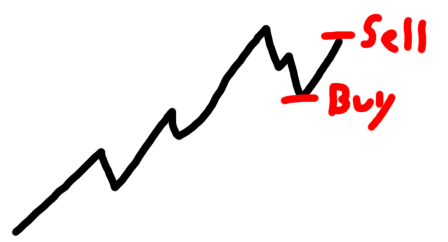
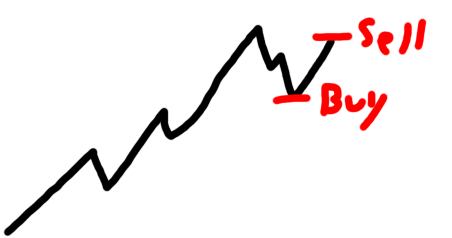
One thing to note is that the trading system you’re about to learn is based on mean reversion trading.
This means you buy stocks on a pullback and then sell them on the rally.
It looks something like this…
With that in mind, here are the rules of this Bollinger Band trading system…
Markets traded:
Stocks in the Russell 1000 index
Timeframe:
Daily
Risk management:
20% capital for each stock and a maximum of 5 positions
Trading rules:
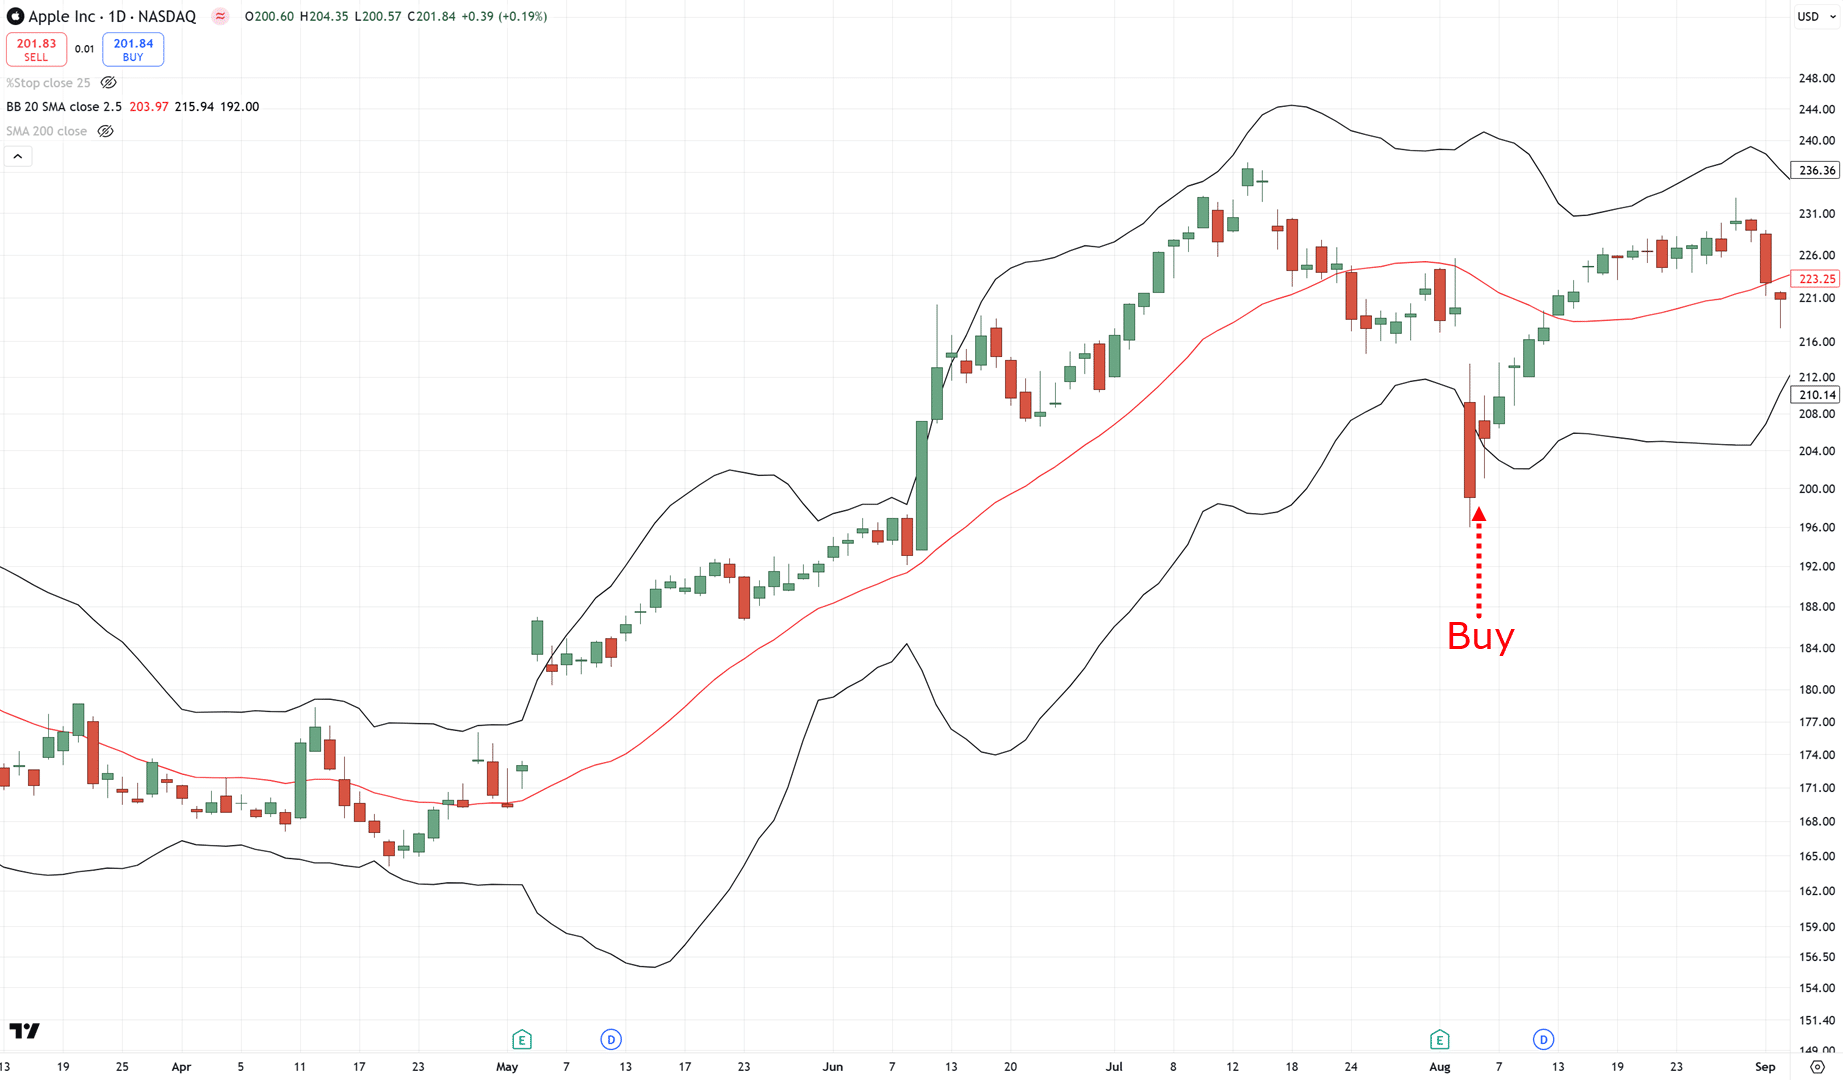
- The stock is above the 200-day moving average
- The stock closes below the lower Bollinger Band
- Place a 3% buy limit order below the last closing price
- If there are too many stocks to choose from, select the ones that have increased the most in price over the last 100 days (criteria to rank stocks from strongest to weakest)
- If your order is filled, sell when the 2-day RSI crosses above 50 or after 10 trading days (criteria to define the sell signal)
And just to add, the Bollinger Band settings are: 20-day moving average and 2.5 standard deviation.
I know it’s a lot to take in all of a sudden.
So, let me walk you through each of those rules.
The stock is above the 200-day moving average
Recall that you’re trying to trade pullbacks on stocks that are in an uptrend.
And as you know, there are a hundred ways to define what an “uptrend” is!
So to make this definition systematic, simply use a 200-day moving average…
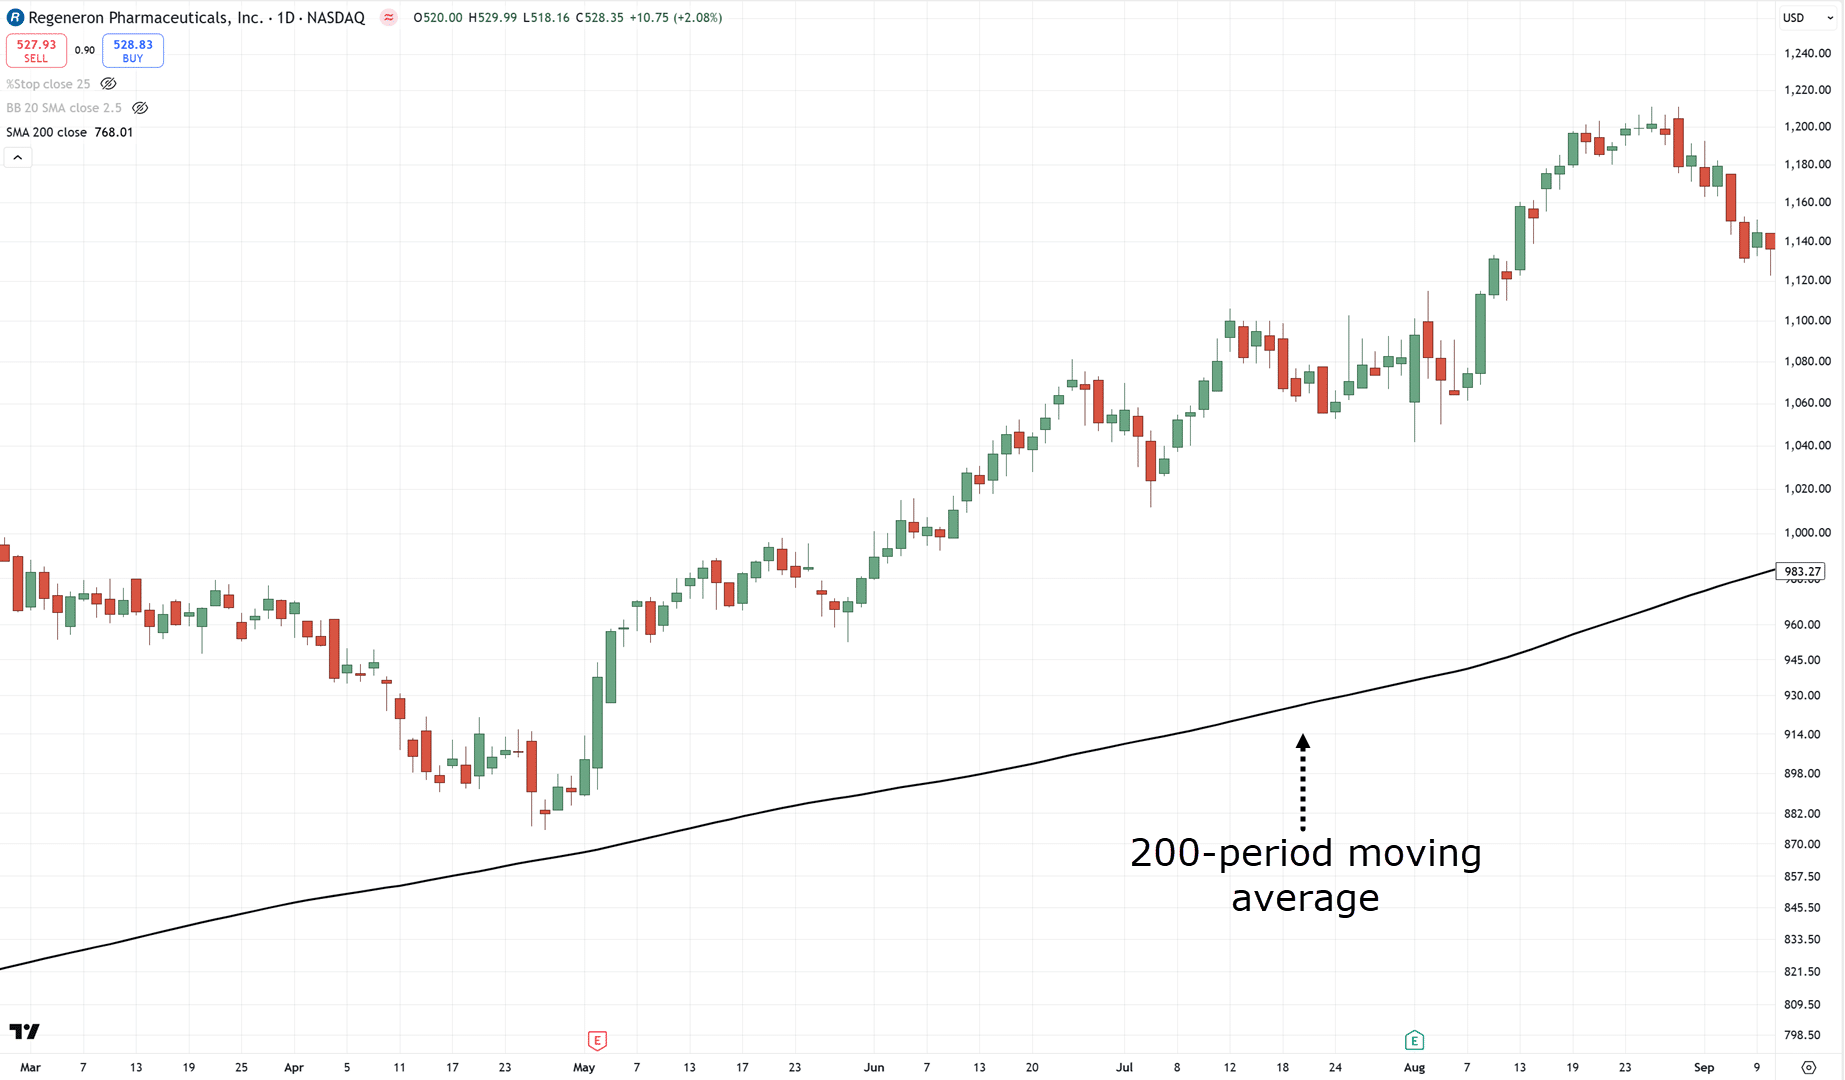
That means if a stock’s price is above the 200-period moving average, it meets the first criterion!
Add it to the list!
And if it’s below the 200-period MA?
Skip the stock.
But, is there an easy way to filter for these?
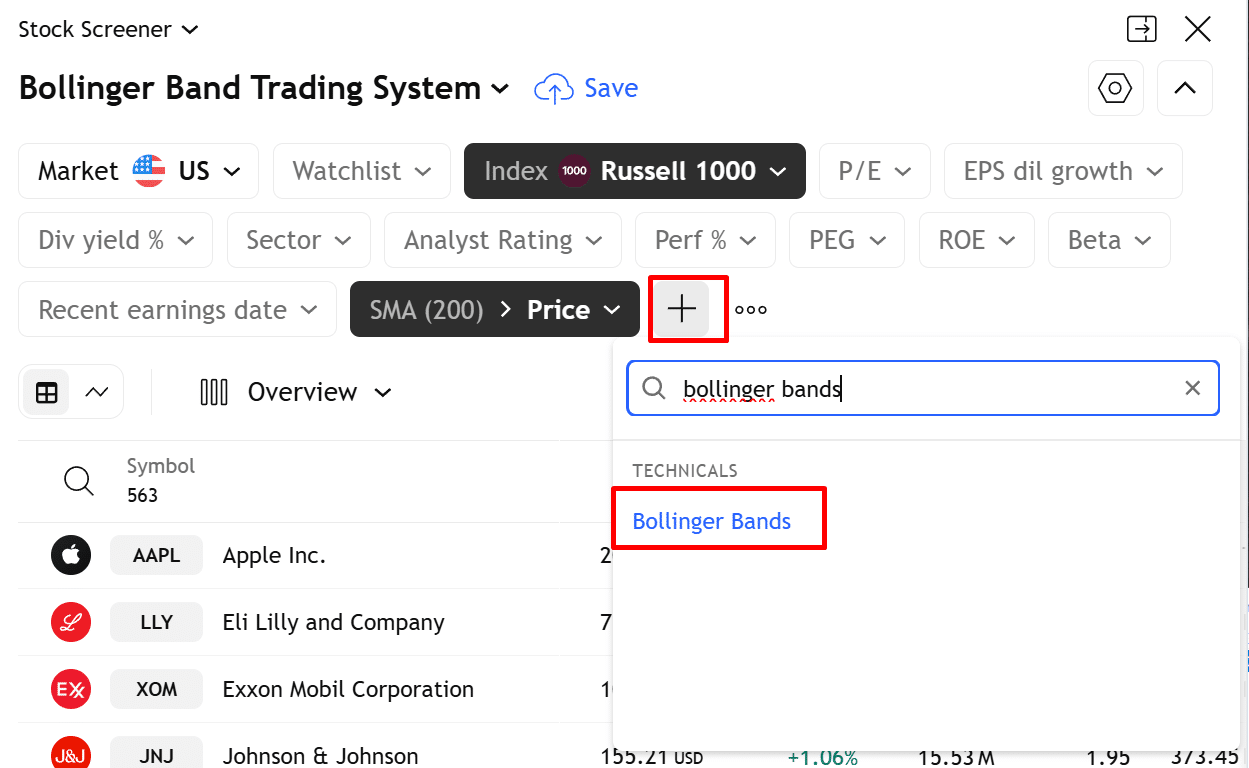
Well, you can use TradingView’s free scanning tool!…
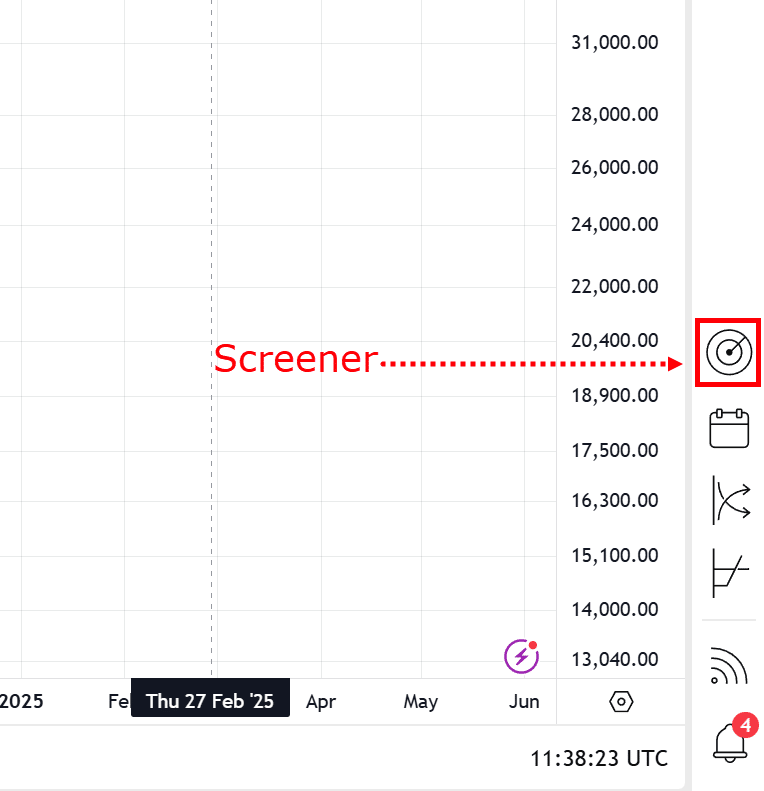
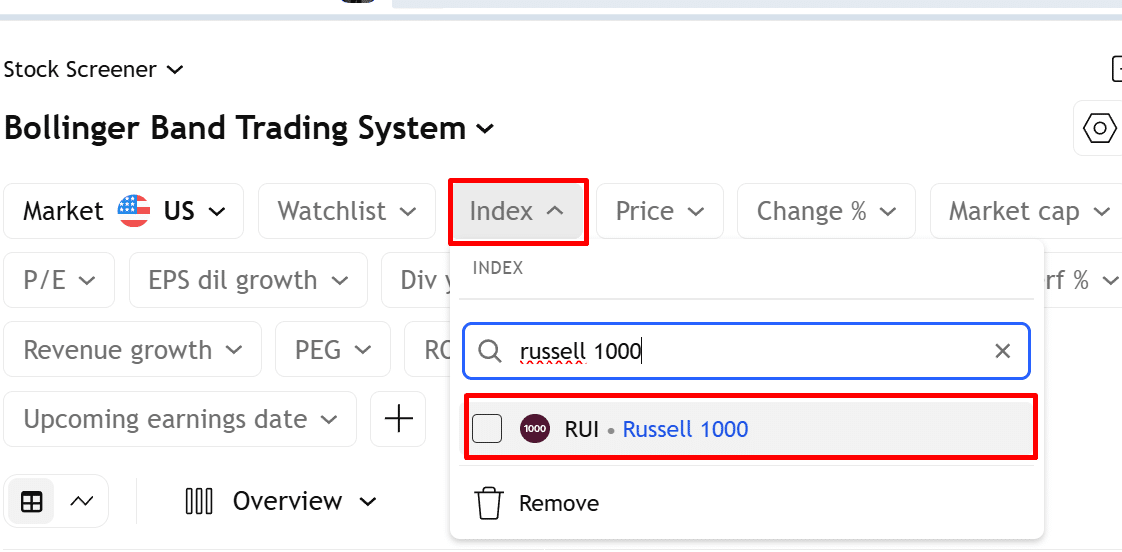
First, set your market to the Russell 1000…
And apply the moving average filter…
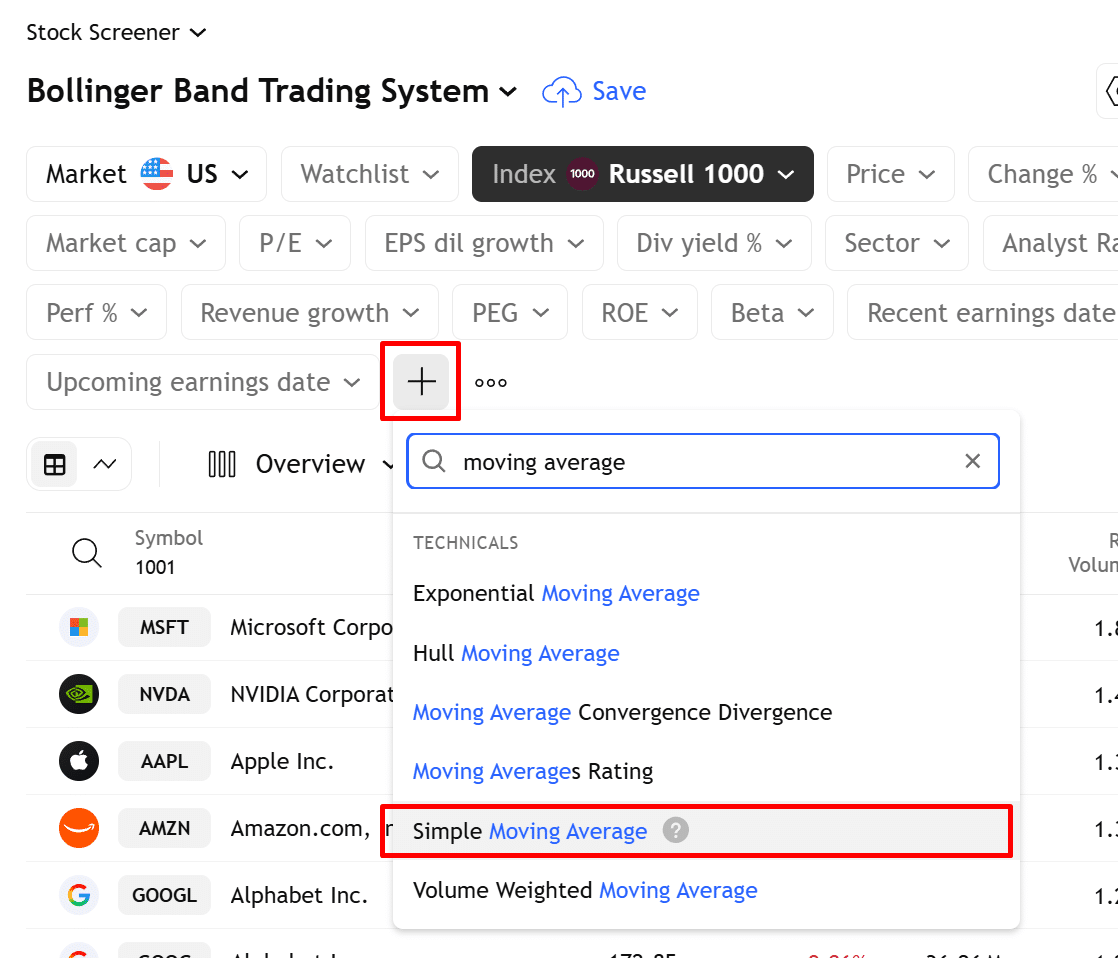
Set it to 200-period, so it only filters the correct stocks…
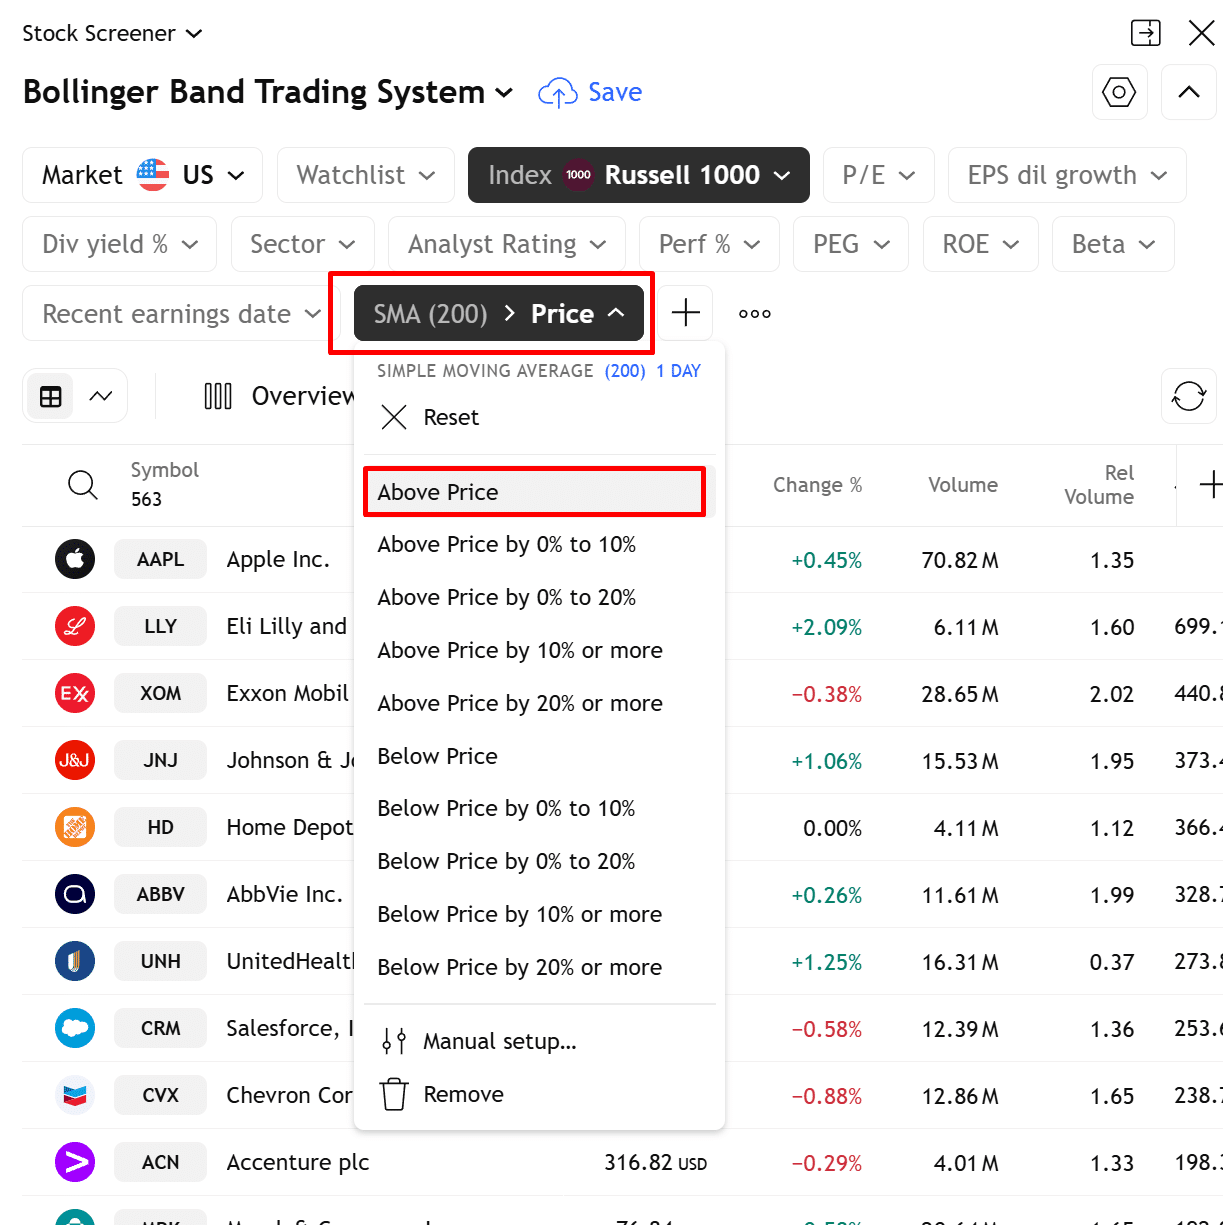
And with that, you’ve already got a powerful filter for this system!
Now don’t worry, as I go through the rules, I’ll continue to build upon this screener so you can follow.
With that said, what’s the next thing to look for?
The stock has closed below the lower Bollinger Band
This is where the Bollinger Band indicator comes in.
It’s used to systematically define a pullback – waiting for the price to “close” below the lower band…
In the TradingView screener, go ahead and apply the Bollinger Band indicator filter…
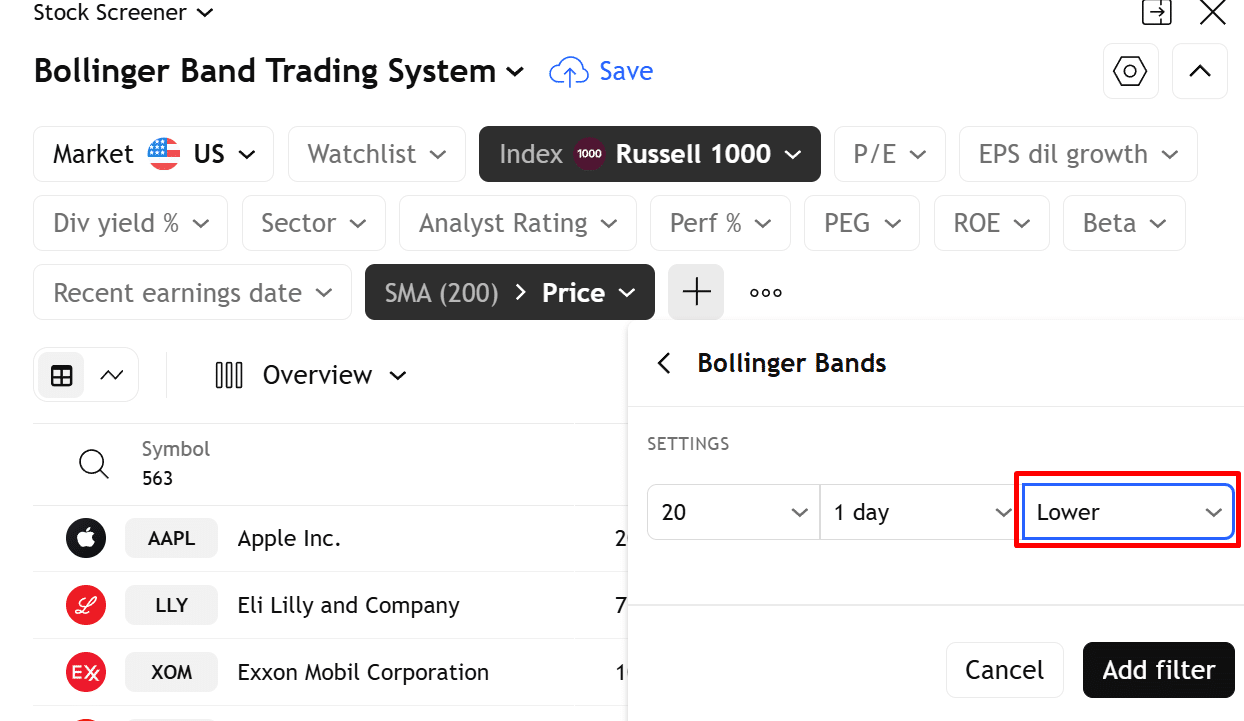
And finally, set it to only look for stocks where the price is below the lower band…
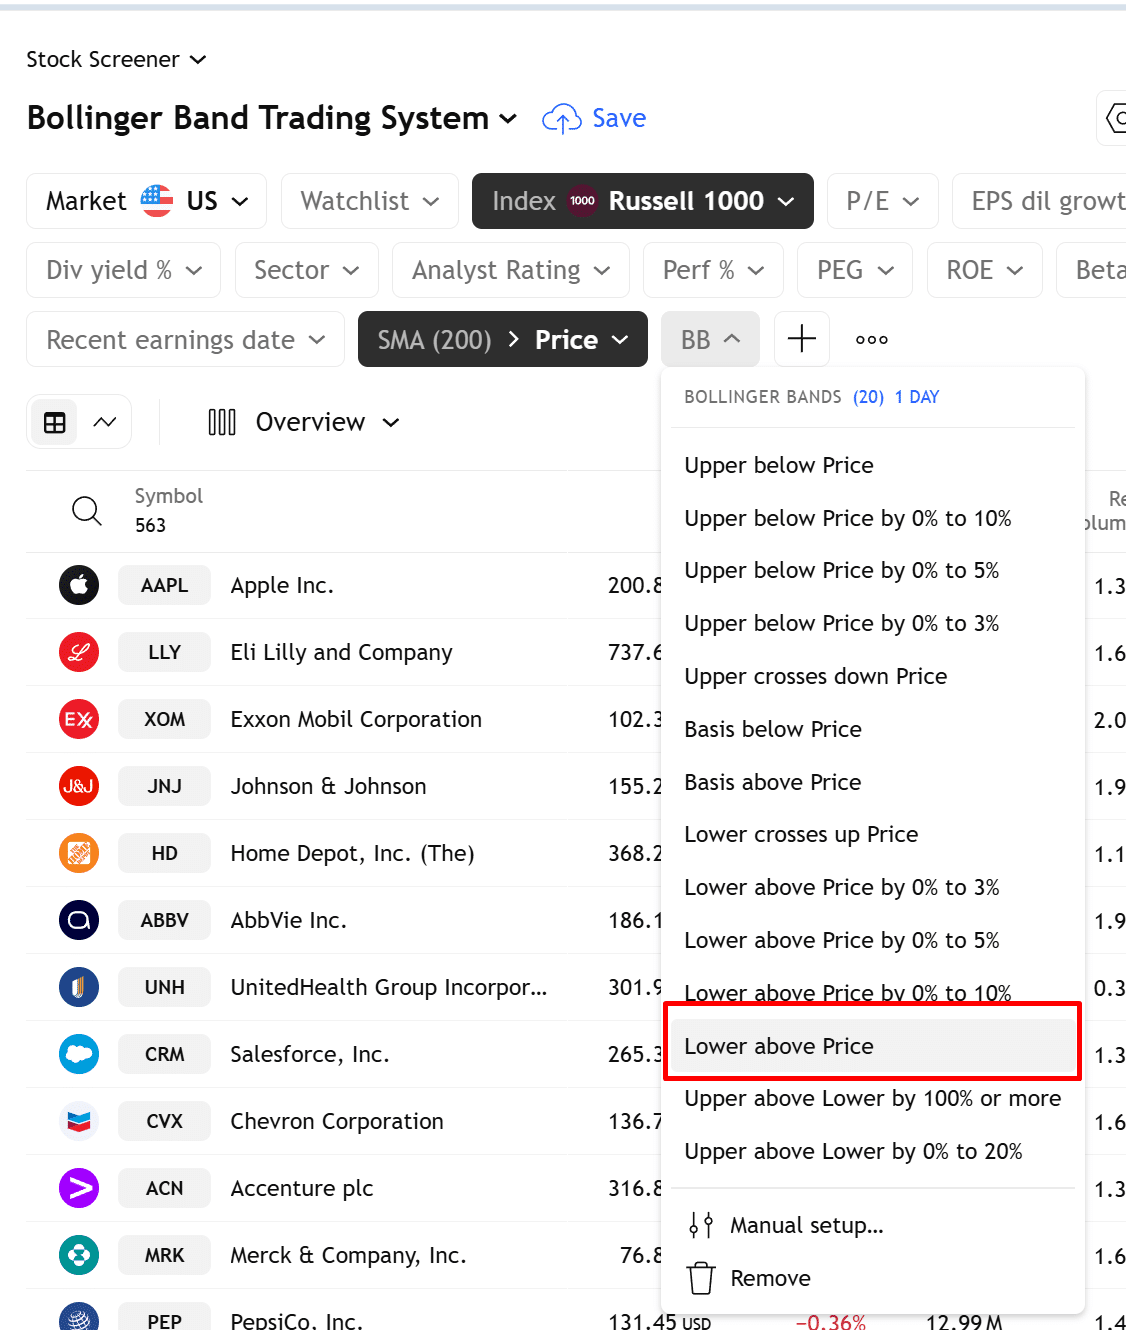
This means that on-top of the 200-period moving average filter, this screener will only look for stocks if the lower band is above the price, rather, if the price is below the lower band.
With that in place, if the stock makes a close below the lower band, what’s next?
If there are too many stocks to choose from, select the ones that have increased the most in price over the last 100 days
One merit of the stock markets is that when things are going great, countless opportunities arise.
This means that in a bull market, stocks are trending most of the time.
However, a trading portfolio can only handle so much.
This leads to the question… which one to buy?
Well, this rule specifically answers that!
Based on the screener results, you can see the following…
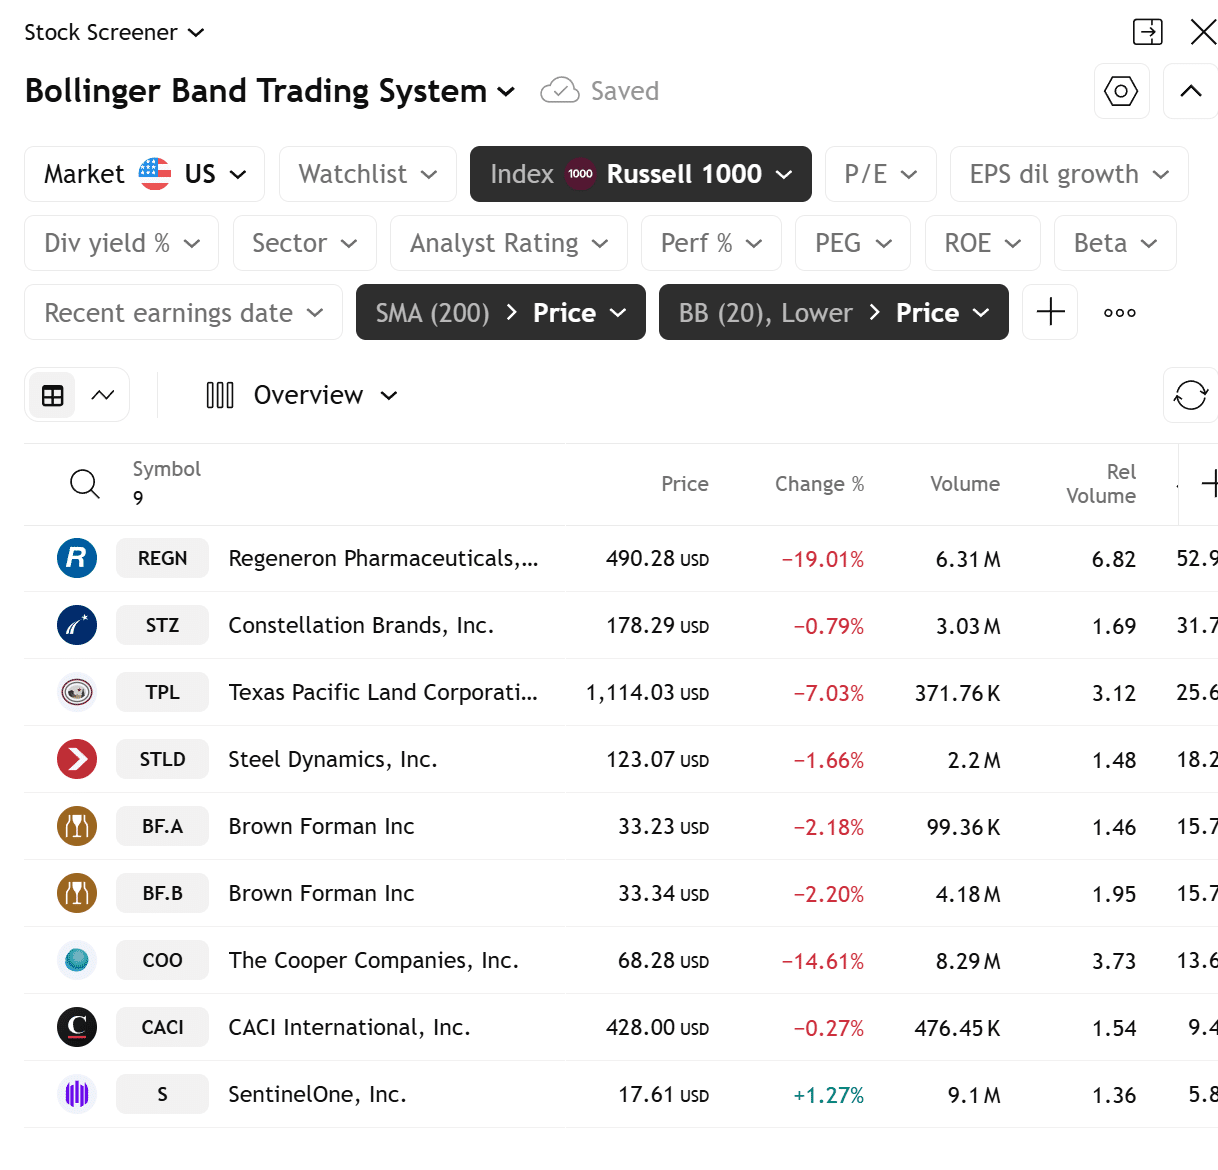
So what you have to do now is get each stock’s “rate of change” value.
Specifically, you’d have to pull up the rate of change indicator and set it at a 100-period…
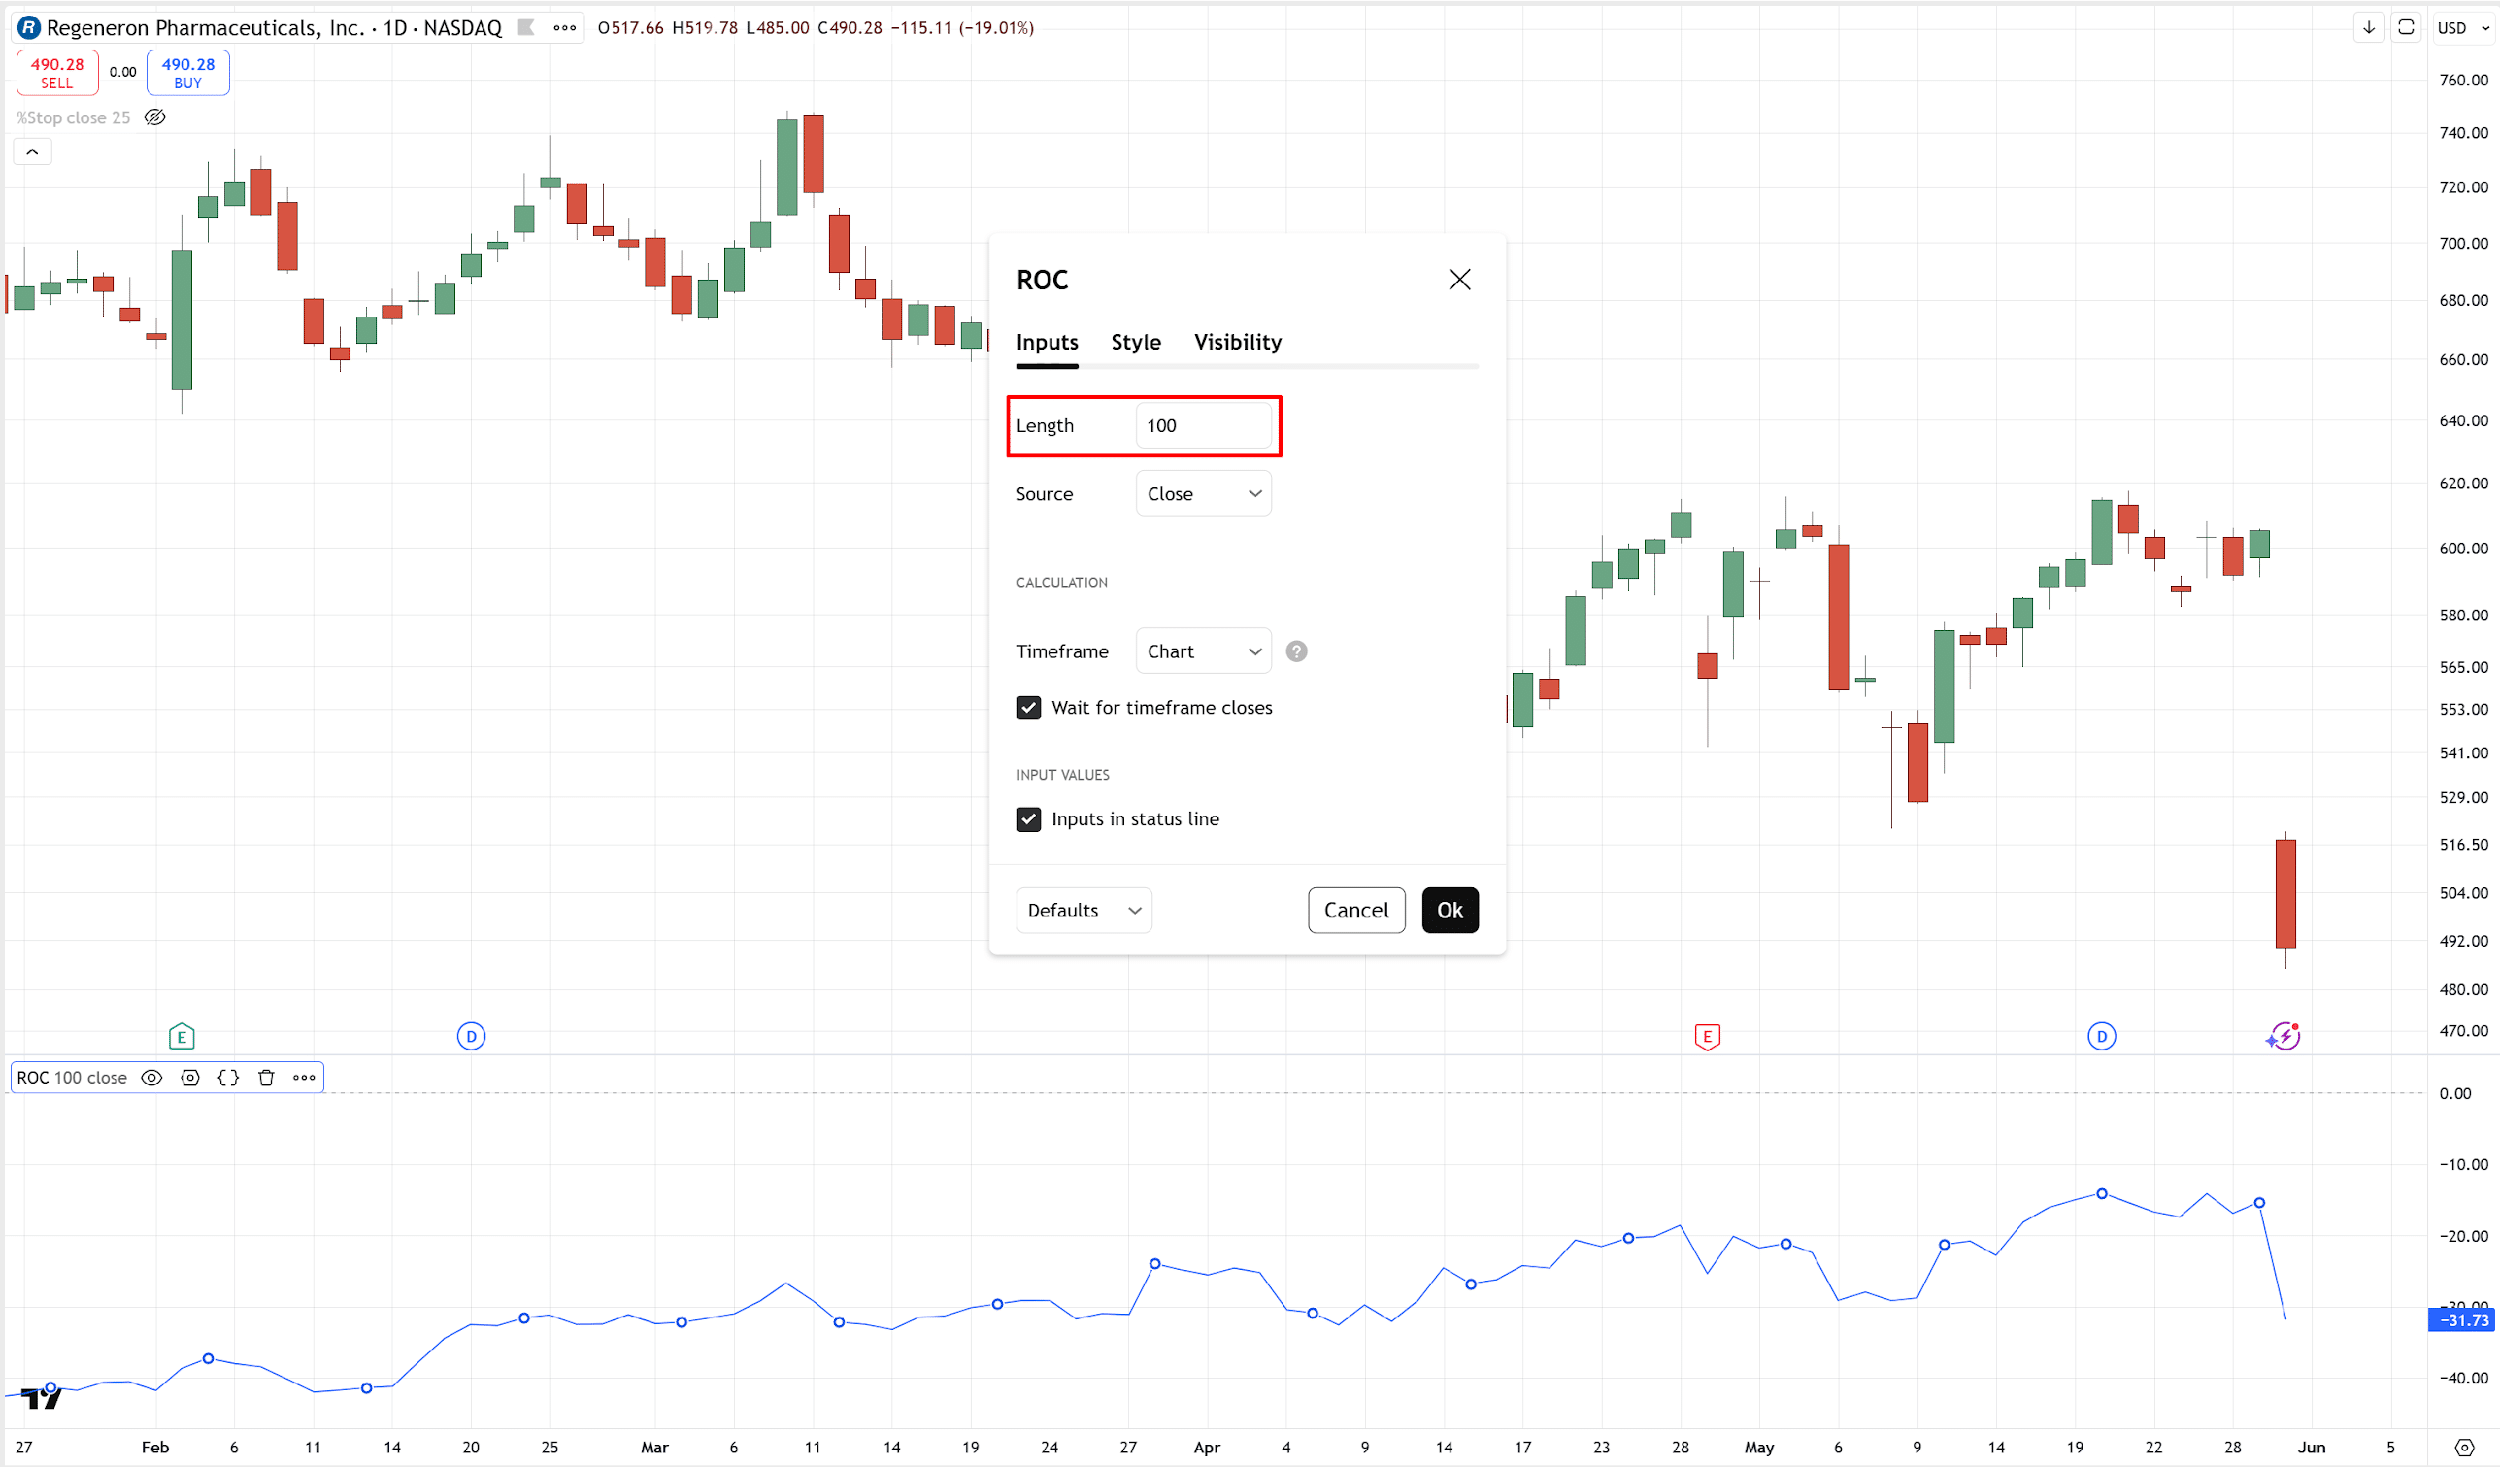
Based on what can be seen in the above example, REGN has a ROC value of -31.73
Now, although you need to obtain the 100-day ROC value for all the stocks listed in your screener results yourself, for the sake of this guide, I have provided some example values for you here!
- REGN: -31.73
- STZ: -19.66
- TPL: -8.01
- STLD: +8.77
- A: -8.03
- COO: -7.54
- CACI: +1.87
- S: -22.8
What you need to do next is rank them based on their values:
- STLD: +8.77
- CACI: +1.87
- COO: -7.54
- TPL: -8.01
- BF.A: -8.03
- STZ: -19.66
- S: -22.8
- REGN: -31.73
Recall, this Bollinger Band trading system has a maximum of 5 trades.
This means you should allocate no more than 20% of your capital to each stock.
So, this is a way of finding out which stocks are most deserving of your money!
And based on the rankings in this example…
You’d have to prioritize entering STLD, CACI, COO, TPL, and BF.A! (and ignore the rest.)
Now, if, for example, you already have 3 open trades, then all you need to do is to only enter the top 2 on the list.
So to reiterate – rank stocks from strongest to weakest based on their 100-day rate of change.
Then, prioritize trading them based on the ranking until you reach 5 total open trades!
With that out of the way, let’s now move on to entries and exits.
The best piece of advice I have is…
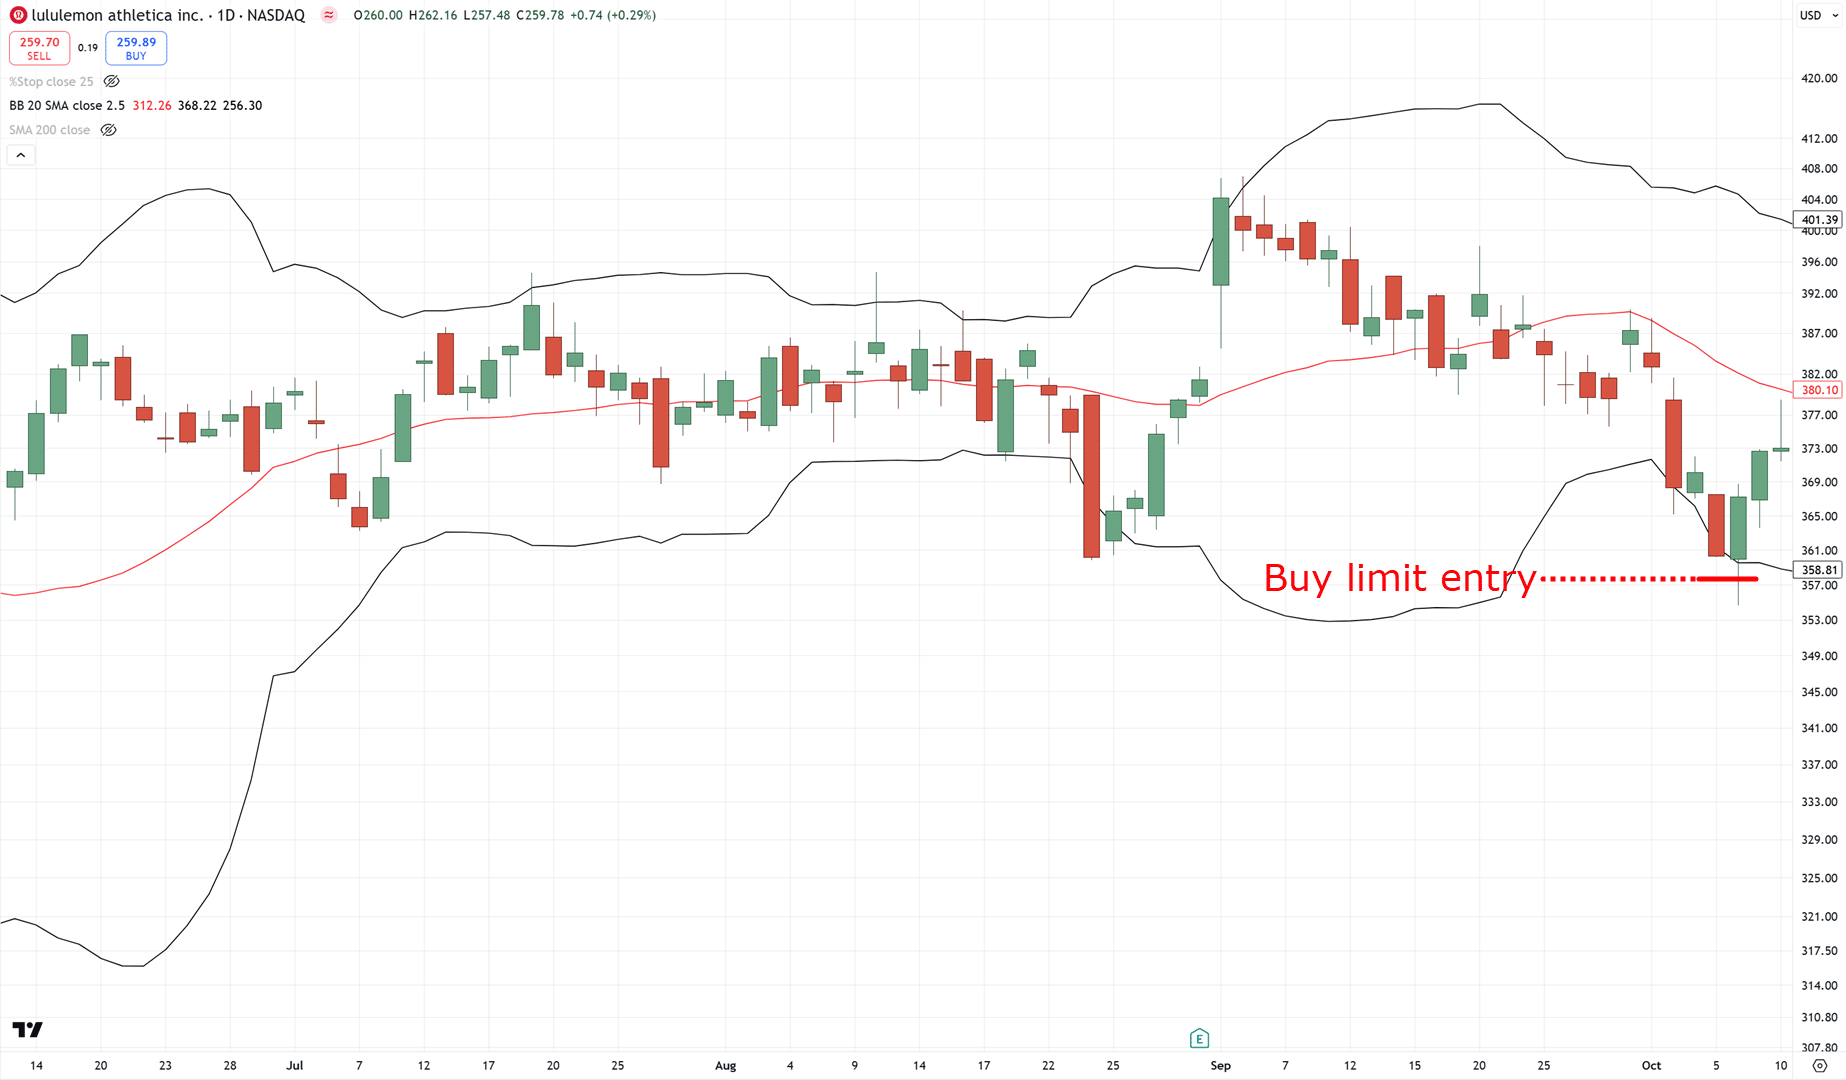
Place a 3% buy limit order below the last closing price
Whatever the last closing price is, as the stock closes below the lower band…
Just subtract 3% from the price, and then you get your limit order price!…
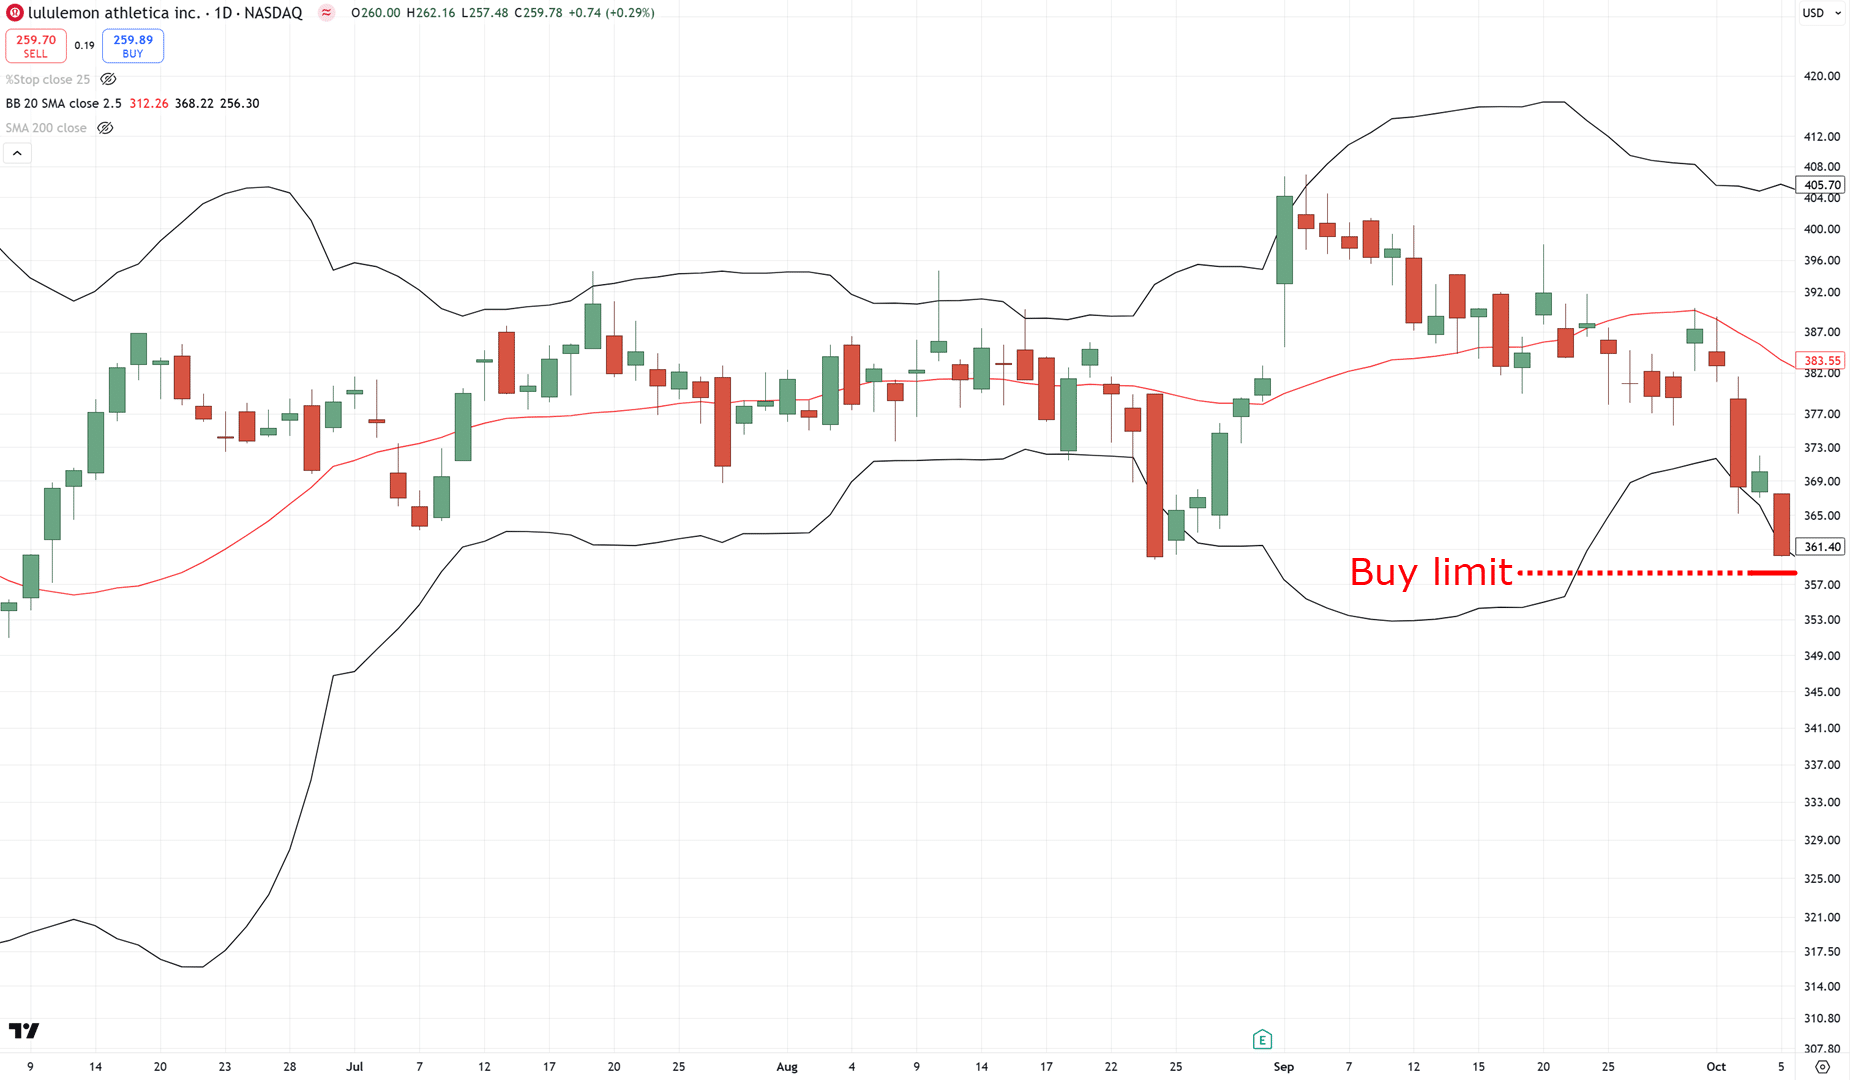
The reason you do this is that you want the stock to come to you even further.
There needs to be sellers still seeking the bottom, only for the buyers to swoop the price back in like an extended rubber band…
Essentially, if your limit order did not get triggered…
…take the order out and do your scans again the next day.
Make sure no limit order lasts more than a day!
Got it?
Overall, this rule is a pretty great criterion to identify oversold stocks.
So, now that you’ve entered the trade, how do you manage it?
After all, there’s no point in entering a stock if you don’t know how to exit it, right?
Importantly, no “gut feelings” necessary here, either…
If your order is filled, sell when the 2-day RSI crosses above 50 or after 10 trading days
I know, this article is about the Bollinger Bands.
So, why the heck is the RSI sliding into this article?
Well, the 200-period moving average makes sure the stocks being traded are in an uptrend.
With that in place, the Bollinger Band helps you enter and look for pullback setups.
The RSI indicator helps work out exits.
Recall, the idea of this strategy is to capture pullbacks…
At the same time, you don’t want to overstay into the trade, and at best, only capture the strength of that pullback setup.”…
And this, my friend, is what the RSI indicator is for
Once you’re in the trade, wait for the price to close above RSI 50…
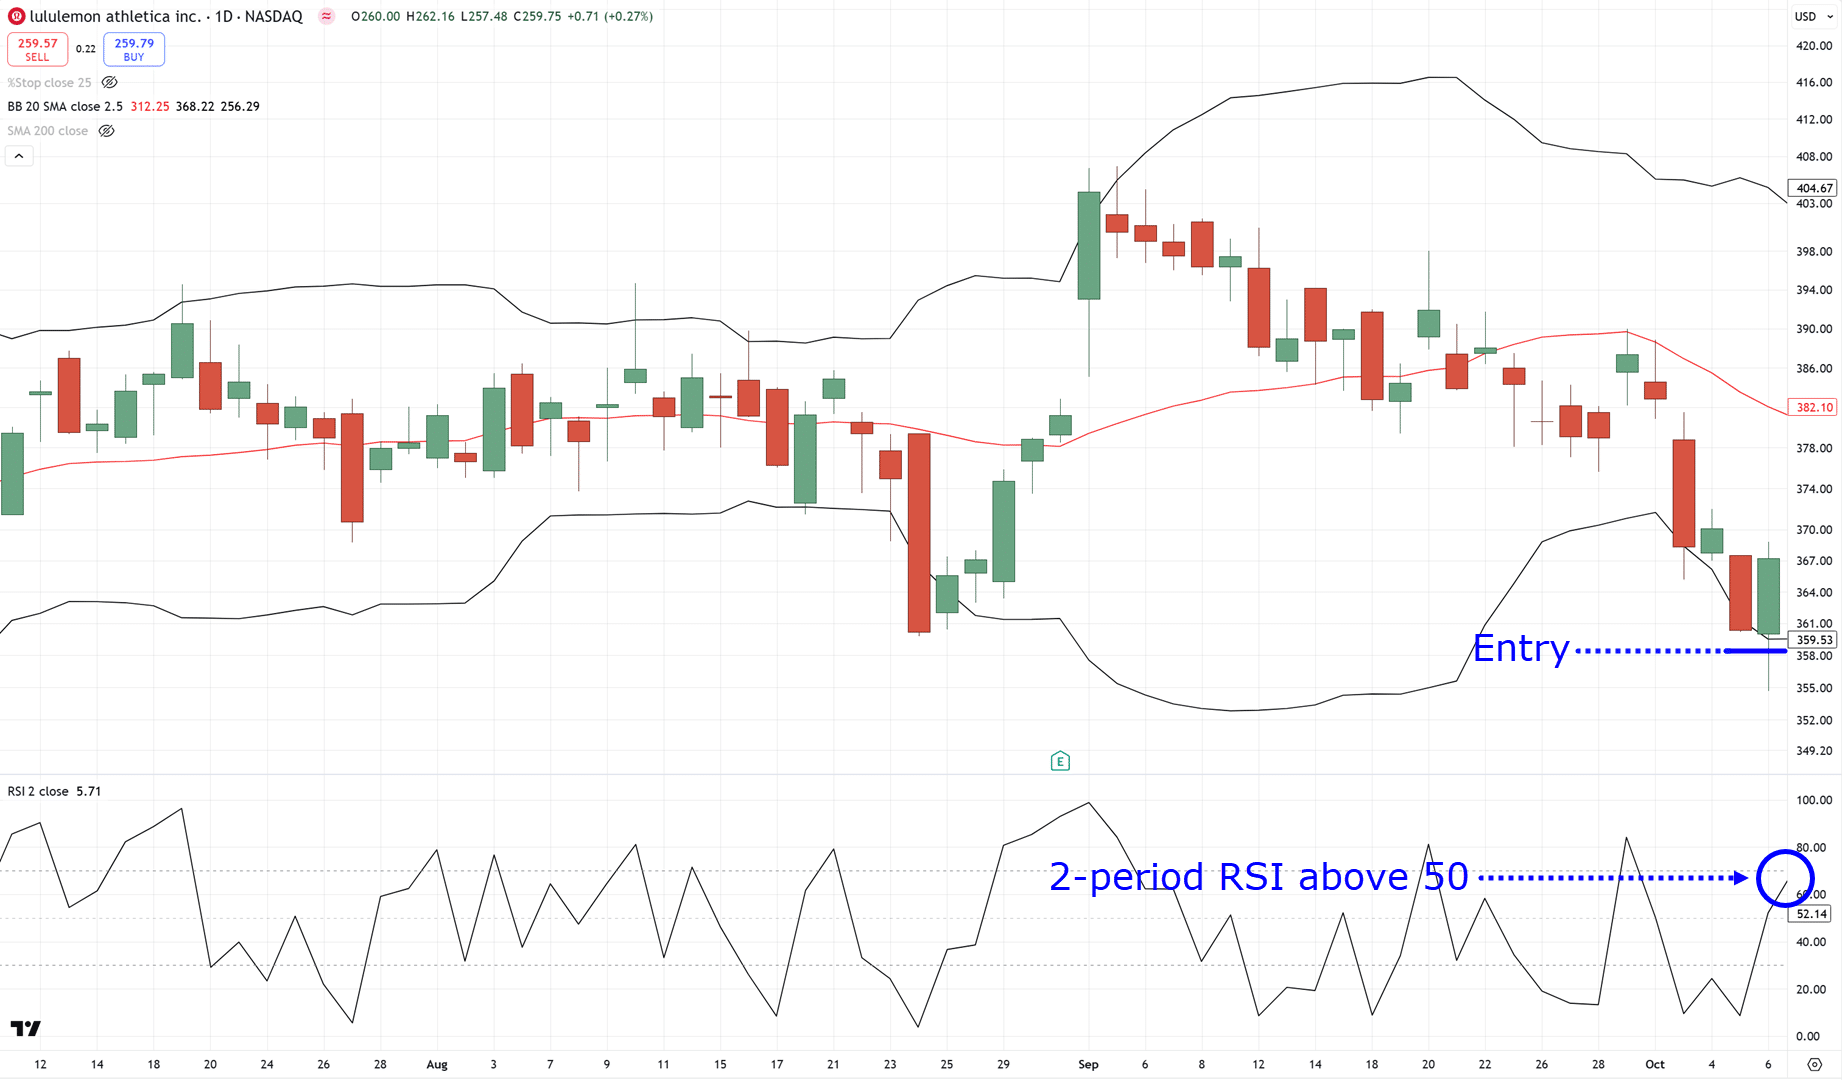
Then, exit the next day at the market’s “opening”…
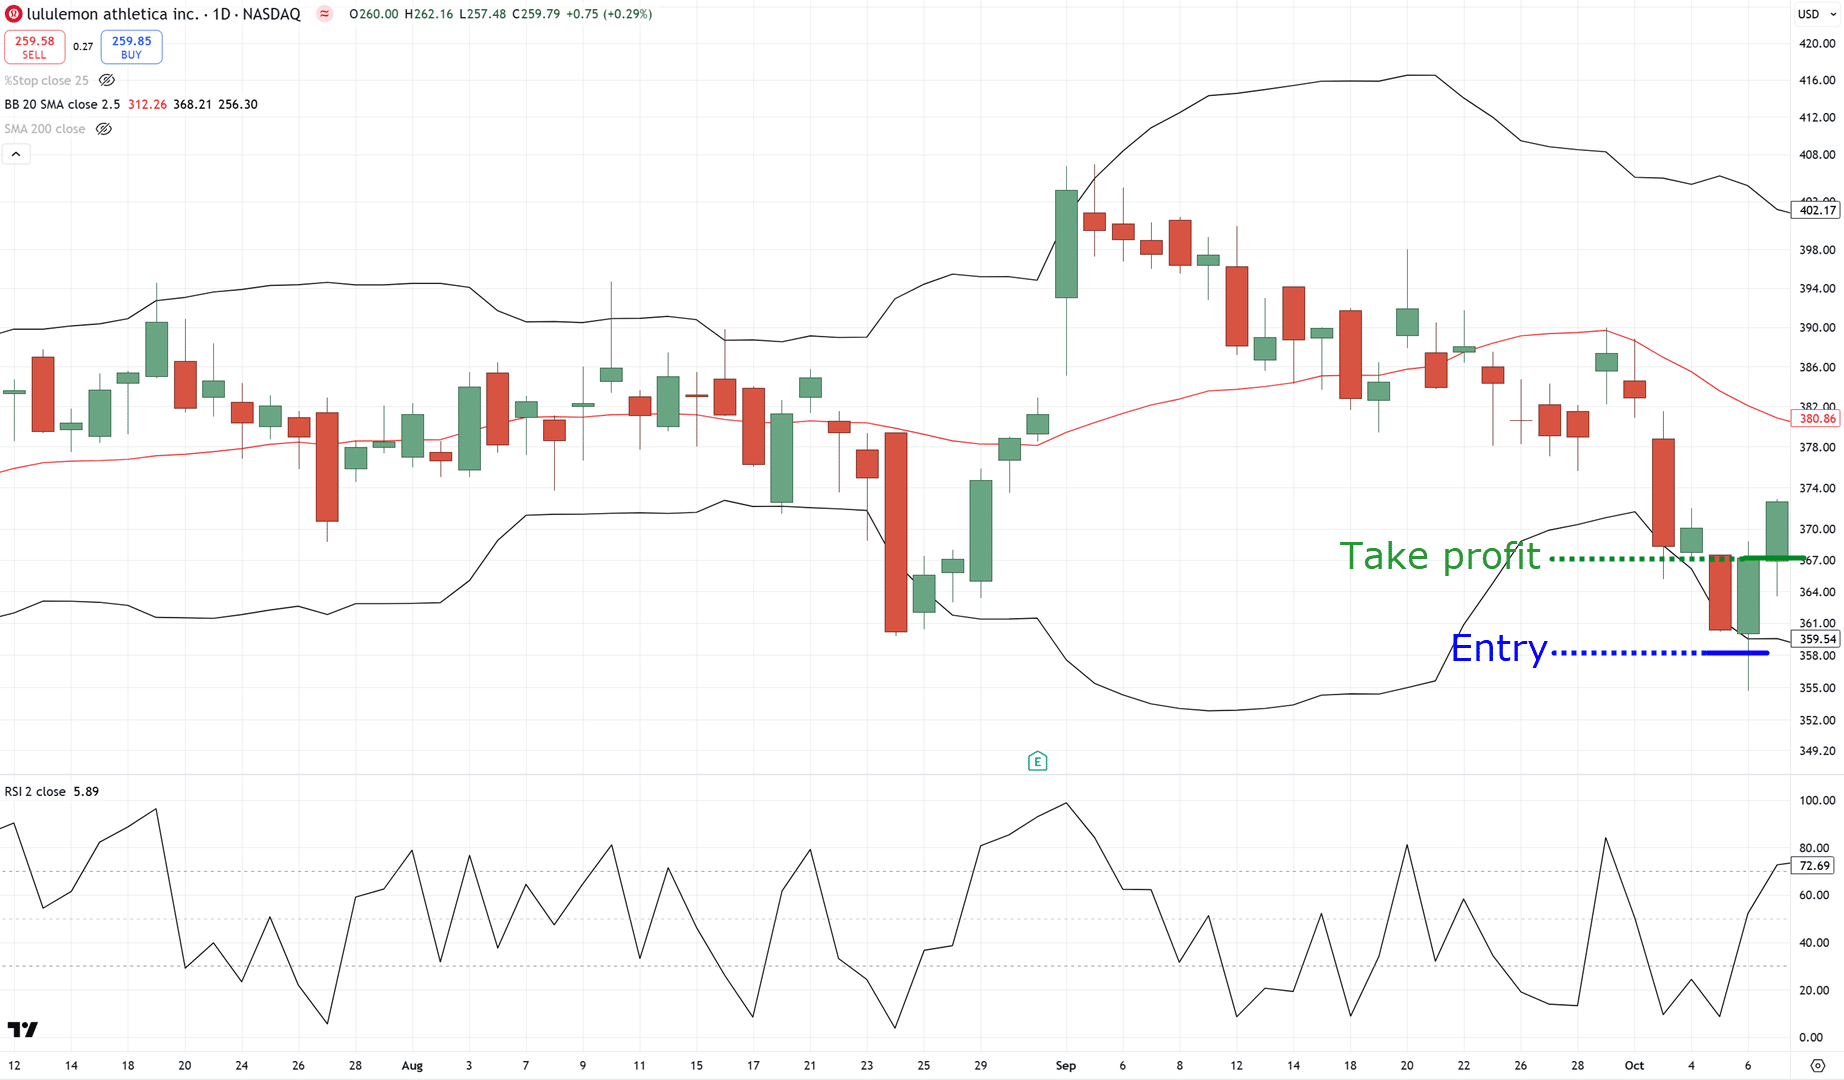
Oh, and don’t forget plan B.
Just in case the stock doesn’t do anything, there should also be a time-stop.
If the price doesn’t close above the RSI 50 after 10 day?
Exit on the 11th day.
And yes, if your limit order gets triggered, it already counts as the first day!
Make sense?
So now to address the questions lurking at the back of your mind…
Does this strategy work?
If it works, what kind of returns can you expect?
Bollinger Band Trading System Results
Notice how I always say “system” throughout this guide?
It’s intentional, because clearly there’s more than one aspect involved here.
However, the rules are objective and clearly defined, meaning it can be easily tested.
In this case, let’s backtest it from 1995 to 2024.
This set of data means that the strategy will show its performance, even through multiple financial crises!
And of course, this system operates in the Russell 1000 universe.
P.S. the data also includes stocks that are already delisted as well as stocks that came in and out of the Russell 1000 index.
So, here are the results…
- Net profit: +7,577.84%
- Number of trades: 1365
- Average Annual return: +15.56%
- Maximum drawdown: -23.20%
- Winning rate:94%
- Payoff ratio:74
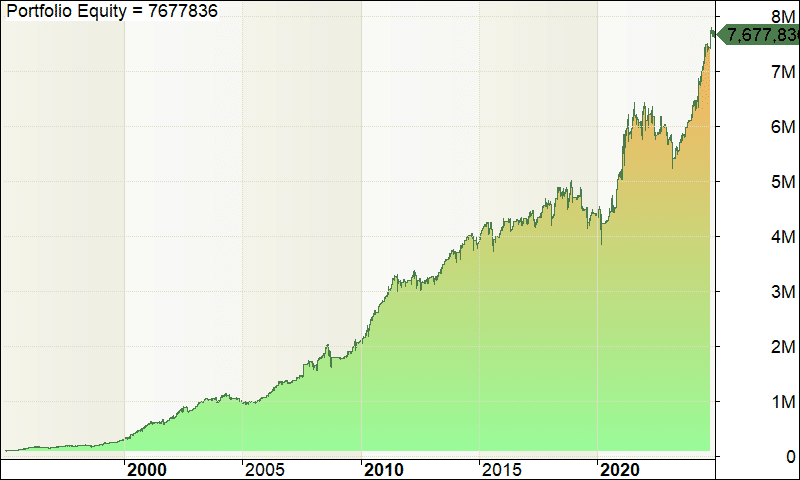
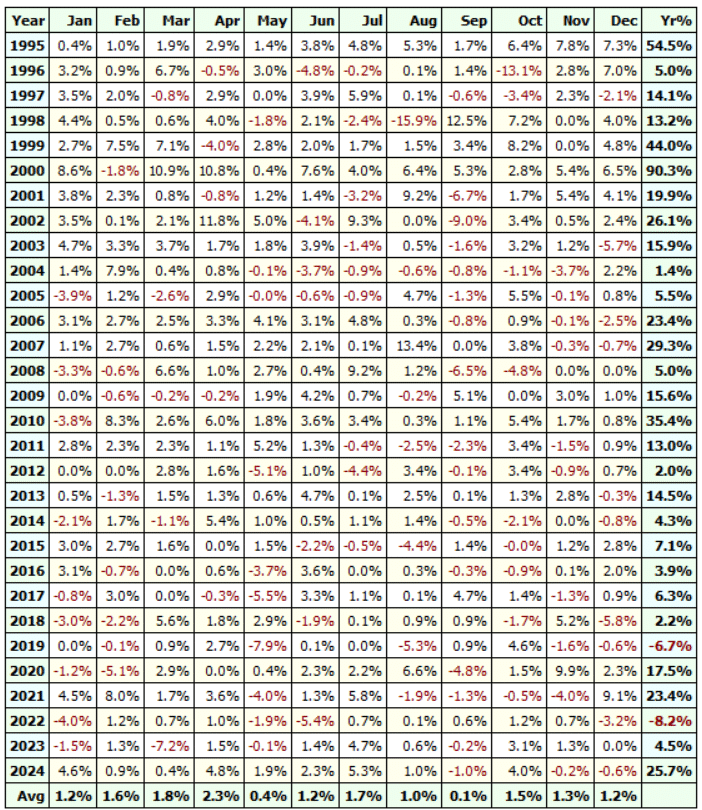
As you can see, this system only had 2 losing years out of all 30, and if you look at the statistics, this system has a win rate of 66%.
That’s one heck of a system!
I mean, sure, there are some mediocre years…
But overall, it’s clear the system has an edge in the markets.
However, as with all strategies, there are weaknesses.
Any strategies will have their losing streaks.
So, for transparency, here’s an underwater equity curve of this system…
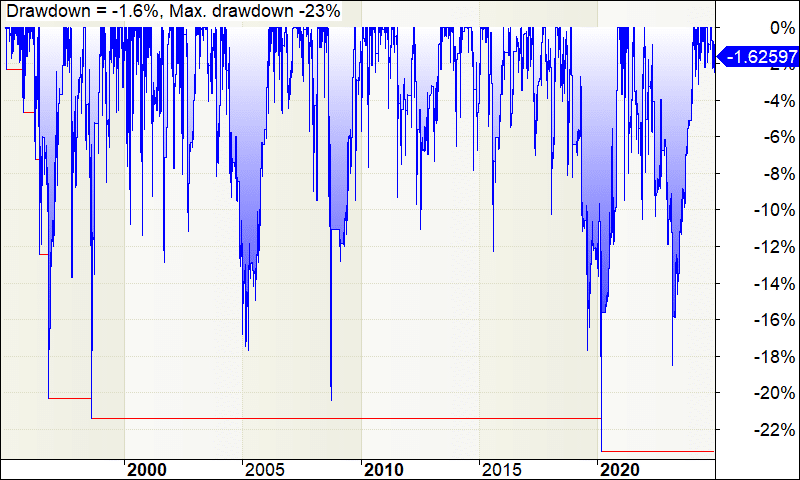
Basically, it shows how often the Bollinger Band trading system goes into a losing streak and for how long it stays there before it breaks even again.
And there you go!
A complete Bollinger Band trading system that works in the markets!
Now at this point, all that’s left is for you to apply the system, which admittedly is the hardest part.
Because as time goes on, you need to develop a full understanding of this strategy.
Which, at this point, you might start wondering…
“Why this indicator?”
“Would the system still work if I modified the settings?”
“How about trading this system in the S&P 500? Will the system still work?”
Rest assured, I have created an FAQ section, which likely contains the answers!…
Frequently Asked Questions
Some commonly asked questions about the Bollinger Bands trading system…
What type of order do I use to enter the trade?
As per the rules of the strategy, always use a limit order.
If your limit order does not get triggered for today’s session, for example, then the limit order must expire.
Basically, no buy limit order lasts more than one day.
Why do you use the Russell 1000 instead of the S&P 500?
There’s no particular reason.
You can use the S&P 500, and the trading system will still work!
When it comes to the 200-period moving average, do I use a simple or exponential moving average?
I use a simple moving average but to be honest, it doesn’t matter.
You can use an exponential or weighted average, and the trading system will still work!
The concept behind it is what matters, not the parameters.
I’d be worried if a trading system broke down simply because of a parameter change!
Does the Bollinger Band trading system work for short selling using an opposite set of trading rules, meaning you short stocks at the upper band?
I’ve backtested this extensively, and unfortunately…
It doesn’t work.
Would this trading system work for Forex markets?
Different markets have different behaviours.
So, if you want to trade this system on other markets, those markets must have a mean-reverting behaviour or it won’t work.
What does position size 20% mean?
It means 20% of your capital will be used to buy a stock.
For example, let’s say you have $100,000 capital and you need to buy stocks A, B, C, ,D and E.
This means you’ll allocate $20,000 to stocks A, B, C, D, and E.
After which, all your trading capital will be used up, and you’ll not take any new positions (even if there’s a valid setup).
Isn’t it dangerous to trade without a stop loss?
Although you’re trading without a stop loss, you have a time stop of 10 trading days.
So, if the exit signal is not met within 10 trading days, you’ll exit the trade on the open of the 11th trading day.
Also, for you to lose all your trading capital, every stock you buy must drop to $0.
It’s possible but unlikely as you’re trading stocks in the Russell 1000 (which are the 1000 largest stocks in the USA).
You rank stocks according to their Rate of Change (ROC). Is there a minimum ROC value you’re looking at?
No, there’s no minimum value for it.
If the screener results show a stock with a negative rate of change, do I still take the trade?
Yes, you still take the trade even though the stock has a negative rate of change
How much starting capital do you need to start trading with this system?
You should have at least $3,000 to trade the Bollinger Band trading system.
But if your broker allows you to trade fractional shares, then you can open an account smaller than $3,000
What if the stock price gap is more than 3% lower? Do I still buy the stock?
Yes, you will still buy the stock, albeit at a lower price (below your limit order).
Also, turn OFF pre-market trading. Most platforms have it turned off by default, but if yours is on, please switch it to OFF. If not, you will end up buying the stock at a higher price.
Now, here’s one secret that I want to tell you:
This is just one of the working systems.
What was discussed here is mean-reversion trading; however, there are also trend-following systems and breakout trading systems.
All with an edge in the markets!
Now, imagine if you could trade multiple (uncorrelated) trading systems that work.
It’s like having multiple streams of long-term income, right?
So, if you want to learn more about it, then there’s a new book being released called Trading Systems That Work.
In this book, you’ll get the full package.
It contains the system I shared with you today but much improved, and also three other systems.
If you’re interested, then you can check it out here.
With that said…
I want to know what you think.
Do you think that systems trading is the “easiest” way to find an edge in the market?
If so, do you plan to develop your system someday?
Or try to trade one that already works and then work from there?
Let me know your thoughts in the comments below!