
This post is written by Jet Toyco, a trader and trading coach.
The Average True Range indicator is one of the most popular technical indicators out there.
It’s usually used for setting stop loss and measuring volatility.
However, this trading guide will give you a masterclass on how to understand and use the Average True Range on a deeper level.
You’ll learn:
- The easiest way to understand the Average True Range in terms of buying and selling pressure
- What is the “best” Average True Range period to use
- A hidden ability that only the Average True Range can do
- A simple Average True Range Strategy designed to capture both breakouts and reversals
Interested?
Then let’s get started…
The easy way to understand the Average True Range indicator and how it’s meant to be used
Here’s a quick definition:
The Average True Range is an indicator that measures volatility that has been developed by J. Welles Wilder in 1978.
Now, I could spit out some complex formulas on how the Average True Range values are calculated.
But let me show you how to interpret this indicator in a way that even a ten-year-old can understand.
Sounds good?
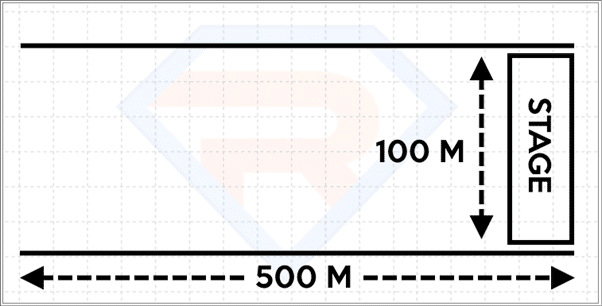
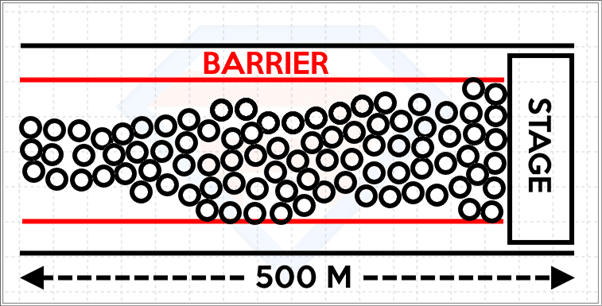
So imagine, you’re a concert organizer.
You’re trying to figure out how wide you should put the barriers to keep the crowd under control.
So you try to measure how long and wide the space is.
Which is 100 meters by 500 meters:
Now…
As time goes on, you and your team have observed that the whole space isn’t being filled up!
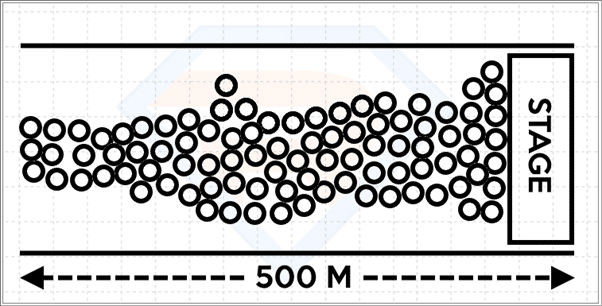
So, what do you do next?
Well, you measure the average length of the crowd!
Yes, there are times when the crowd goes out of hand outside the range, but as you can see…
The average length of it is 40 meters:
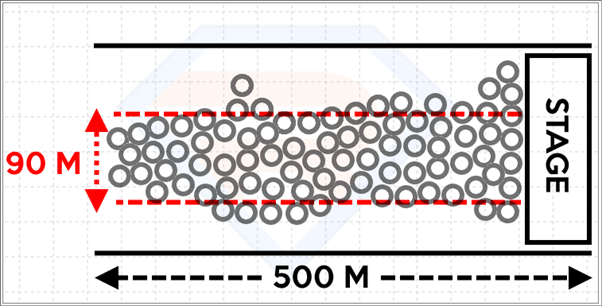
What does this tell you?
It tells you that the “Average True Range” of this crowd is around 40 meters!
With this information, you’ve informed the security to place barriers with a 40-meter gap.
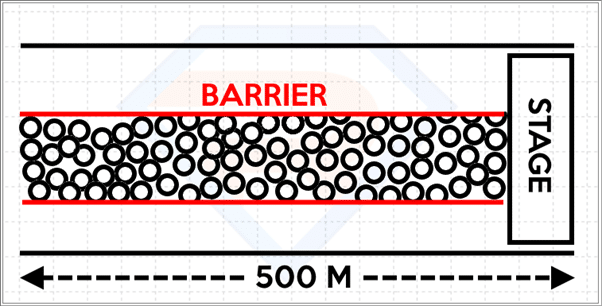
However!
As time goes on, more and more crowds are starting to attend the concert and things are getting cramped up.
So, what do you do?
Simple.
You try to multiple the calculation you had a while ago (which is 40 meters) to 1.5.
This time, you’ve informed the security to widen the barrier to 60 meters to accommodate more guests!
You see, this is almost the same thing for trading!
As you can see in the example…
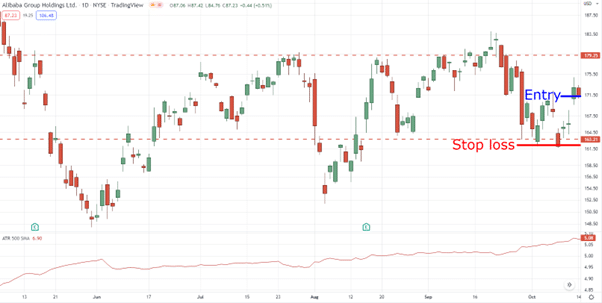
We’re using the 500-period Average True Range on BABA daily timeframe:
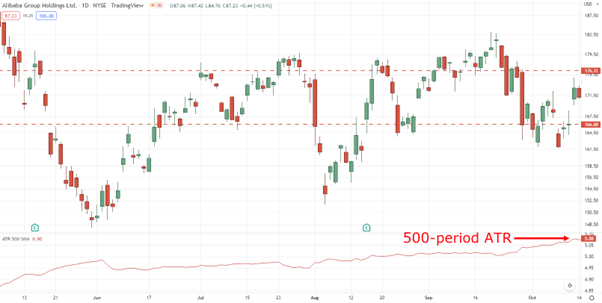
The current Average True Range period is 5.08
So, how do you use this information?
You add it to the current price to determine your “barriers.”
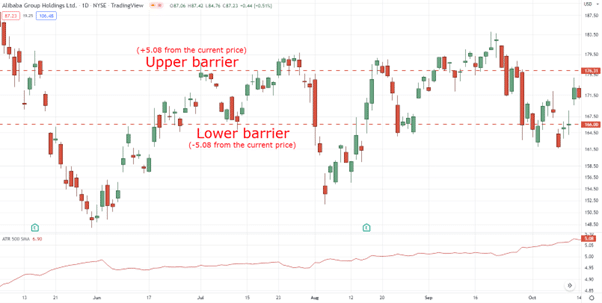
Now, do you recall what you did on the example a while ago on how to deal with potential “crowds” that could come in?
Good.
We multiply the Average True Range Value (which is 5.08) by 1.5 which gives us a wider range!
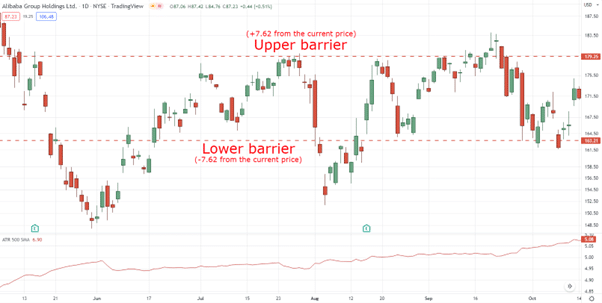
Makes sense?
Now, how is this important to your trading?
Well, if you are to enter a buy position on this trade right now, you would place your stop loss below the lower barrier to “accommodate” future price volatility:
Boom, there you go.
So can you see how powerful the Average True Range can be?
Pretty amazing, right?
Now you might be wondering:
“Okay so, should I use the 500-period Average True Range on my trading?”
The answer?
A big no!
The 500-period Average True Range you saw is just based on the example I gave earlier regarding a concert with a length of 500 meters.
And yes…
I’m sure you can agree with me that the first thing we ask after learning an indicator is:
“Sir, what’s the best period sir?”
“Should I use 10-period, 50-period, or 100-period, sir?”
Ah, classic.
So let’s tackle this in the next section on what the “best” Average True Range period is.
Ready?
Then read on.
What’s the “best” Average True Range indicator period
Here’s the thing, if someone tells you:
“Ah, use the 20-period Average True Range because it’s the best.”
“Use the 13-period Average True Range, it has made me money, trust me.”
Then make sure to run away and plug your ears.
Why?
Because it doesn’t take into account how that person is using the Average True Range as there’s no context!
And the last thing you want is to plug in and use those numbers blindly.
So, for us to determine the “best” Average True Range indicator period…
You must choose how you want to use this tool such as using the Average True Range indicator to:
- Set your initial stop loss
- Set your trailing stop loss
Let me explain…
Initial stop loss
Remember the first example I shared with you?
Good.
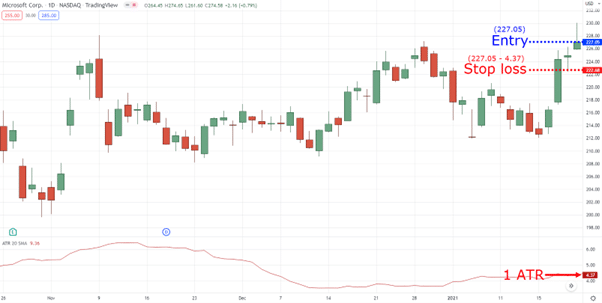
Because that’s exactly how you can use the Average True Range to set your initial stop loss!
Simply subtract the Average True Range value from the current price:
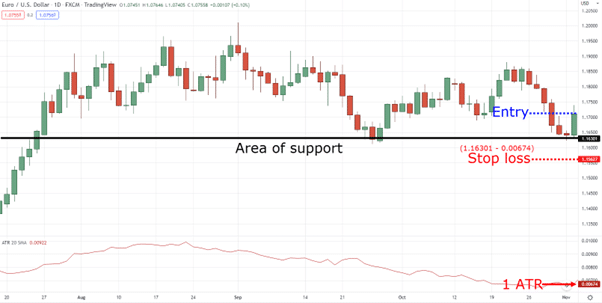
A bonus tip is to also identify an area of support, and subtract the Average True Range value from that level:
Now, if you intend to use the Average True Range this way…
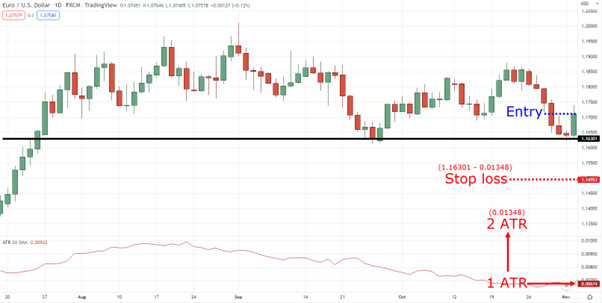
I highly suggest using a “medium-term” Average True Range period somewhere between 20 and 30 period and multiplying it by 1 to 2 as a buffer.
Next.
Trailing stop loss
In case you didn’t know yet, there are three types of trends:
- Strong trend
- Healthy trend
- Weak trend
Strong trends tend to be parabolic where higher lows are sloping:
These types of trends are usually short-lived.
It’s like a runner going on a 100-meter sprint!
So, what Average True Range indicator you should use?
I suggest using a “short-term” period of 10-20 and multiplying the value by 1 to 2 as a buffer.
In short, the period and buffer suggested are so that you can capture a short-term trend!
P.S. In this chart, I’m using a Chandelier Stop, which automatically subtracts the ATR from the current price.
Now, healthy trends tend to have a balance of pullbacks and breakouts, so these types of trends usually last quite long.
Again, imagine that this trend is like a marathon runner!
In this case, I suggest using a “medium-term” period of 20-30 and multiplying the value by 3-6 as a buffer.
Yes, I know how the stop loss seems to be wide on this one!
But since we want to capture a medium-term trend (which goes into pullbacks from time to time), we want to make sure we capture the “meat” of the move.
Makes sense?
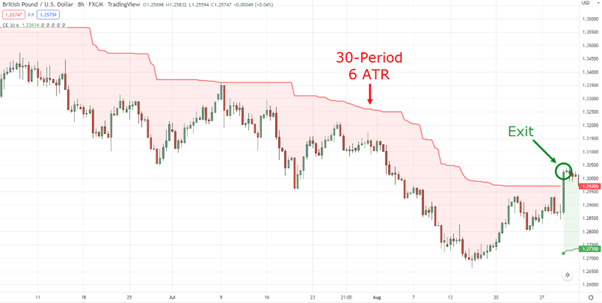
Finally, weak trends tend to have more range in them, but the general trend is still clear.
Here’s what I mean:

So, what Average True Range indicator period should you use on such a “long-term” trend?
A period of 30-40, and of course, multiply the value by 6-8 as a buffer.
Now you might be wondering:
“Awesome, so what’s the best type of trend to capture”
Unfortunately, there is no best, just like how there isn’t a best period for Average True Range.
So you would have to choose and stick to it consistently.
Got it?
You better!
But the bottom line here is…
Knowing what Average True Range indicator period to choose should depend on your chosen trading style.
With that said…
I’m sure you know that the Average True Range is known for setting your stop loss.
But did you know that you can also use this indicator to spot potential trend reversals as well?
Let me teach you how in the next section.
How to spot potential market reversals with the Average True Range indicator
First, let me ask you…
What are some of the common chart patterns out there?
Sure, we have the:
- Ascending Triangle
- Head and Shoulders
- Double Bottom
But what’s a chart pattern that has existed and is effective ever since the market has been invented?
A kind of chart pattern that’s the mother of all chart patterns?
A kind of chart pattern that’s simple to understand?
Let me tell you…
It’s the fact that the market is in an endless cycle of impulse and corrections.
A cycle of breakouts and pullbacks.
A cycle of being silent, and being loud:
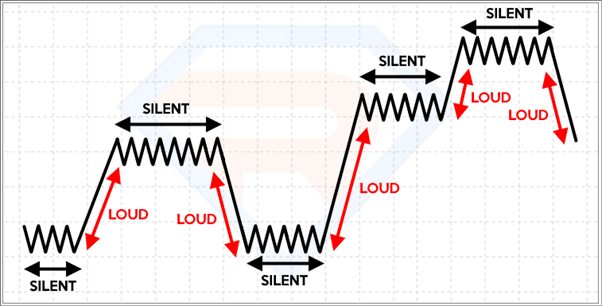
However, you must know that there will be times when the market can be silent for years while loud for a few months, it’s a chart pattern that has no “fixed” form.
So, why am I sharing this?
Well…
Because the Average True Range can detect such cycles accurately in a way that you don’t even need to look at a price chart!
Let me prove it to you:
So now…
If you are to look for potential reversals in the markets, you need to keep in mind these two things:
- The longer the market is loud, the higher the chance of a reversal
- The longer the market is silent, the higher the chance of a breakout
Let’s go to the charts and let me show you what they mean, shall we?
The longer the market is loud, the higher the chance of a reversal
One good example of this concept is in XXXXXX at the daily timeframe:
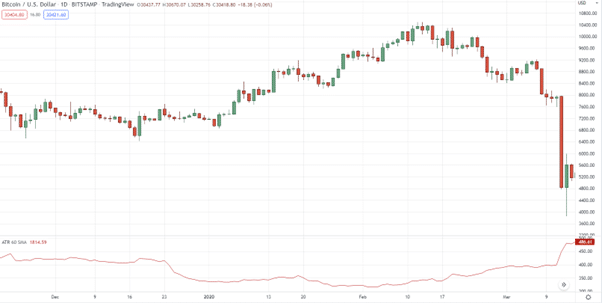
As you can see, using the 60-period Average True Range on the daily timeframe, the volatility is increasing:
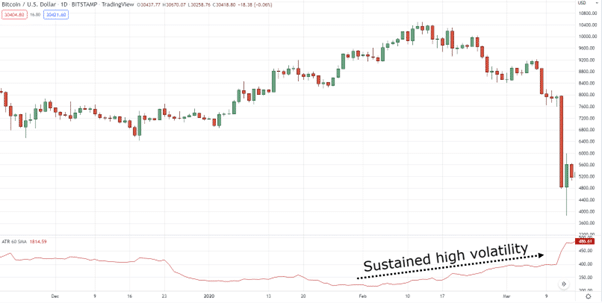
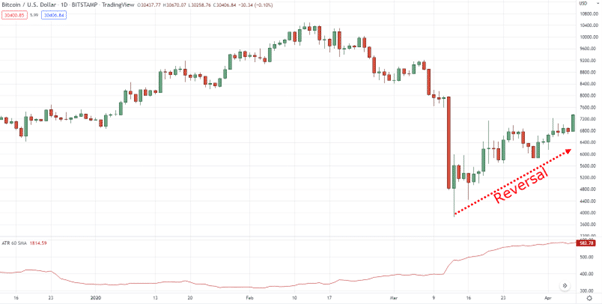
If you see that your Average True Range’s values are sloping higher…
Then chances are the market is about to reverse:
So, why 60-period?
Because in this example…
We are trying to measure the volatility for the past 3 months (there are 20 days in one trading month) to come up with an analysis, and not a trading idea.
Makes sense?
Next.
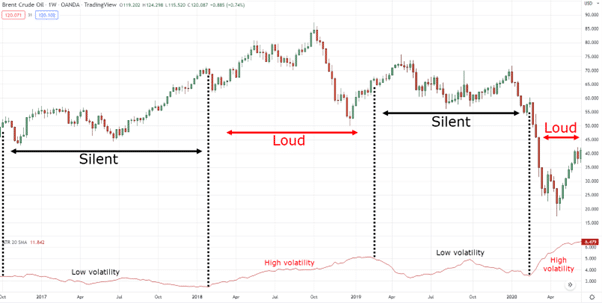
The longer the market is silent, the higher the chance of a breakout
The concept is similar to the previous example!
But this time, the outcome is the opposite:
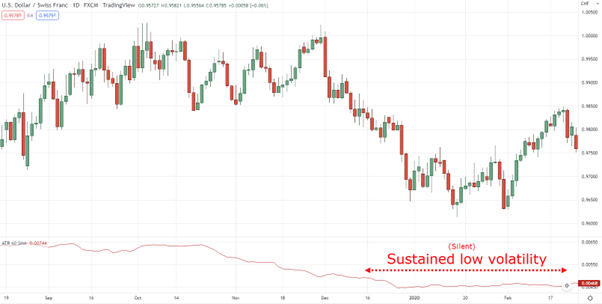
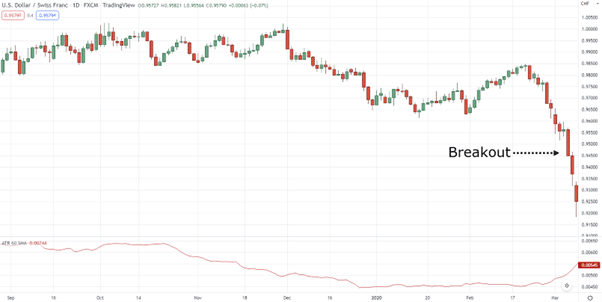
Notice how the 60-period Average True Range is silent before it broke out!
So, this is one consistent method of trying to determine market reversals as the Average True Range aims to “simplify” data on your chart in a way that you won’t second-guess it.
Now…
I know that I have just taught you how to analyze a chart and make calls if the market will potentially break out or crash.
How about entering trades, though?
After all, that’s how money is made, through putting actual trades and not analysis, right?
So let me put everything that you’ve learned so far so that you’ll be able to profit from them.
Keep reading…
A simple Average True Range indicator strategy to ride bubbles and profit from crashes
Finally, the moment that you’re waiting for!
However, my objective for this section is to use everything that you’ve learned so far in this training guide and combine them in a way that they can be used practically in entering and exiting trades.
Sounds good?
So, this simple strategy only has two rules:
- If volatility is low, look for breakout opportunities
- If volatility is high, look for pullback opportunities
Of course, you’re free to add your trading tools and setups if you wish (as long as it doesn’t violate those rules.
But that’s pretty much it.
Simple, right?
Now let me give you a couple of examples for this to make more sense…
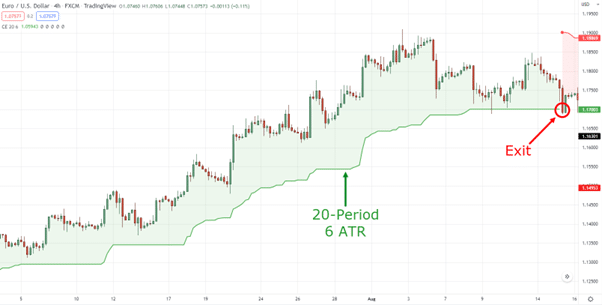
If volatility is low, look for breakout opportunities
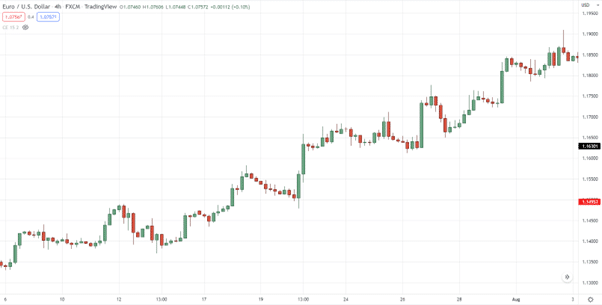
If you look at USDZAR on the daily timeframe:
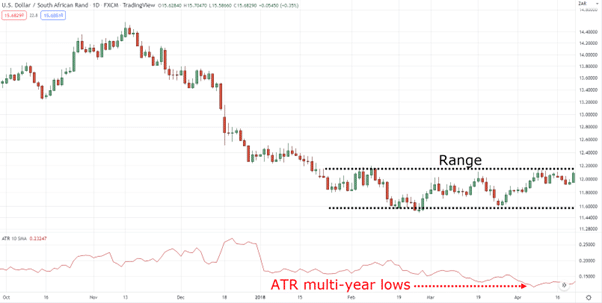
You can see how the volatility is constantly declining on the Average True Range indicator.
This is a sign that the markets are getting ready to get loud.
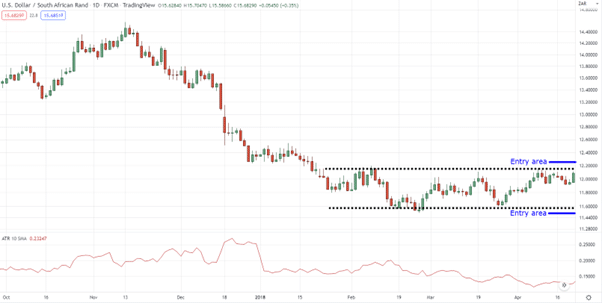
At the same time…
We can see that the market is in a range, so we have a good reference on where our entries would be:
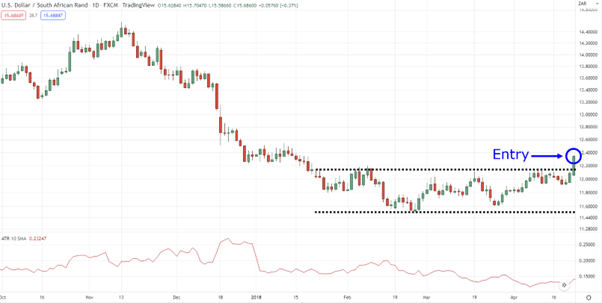
As the price develops, it eventually broke out of the area of resistance, which gives us a valid entry trigger:
How about our exits?
Remember, if it breaks out of a range there’s a high chance that it can develop into a trend.
So what we would do is to use a trailing stop loss using the 20-period Average True Range, then multiply it by 4:
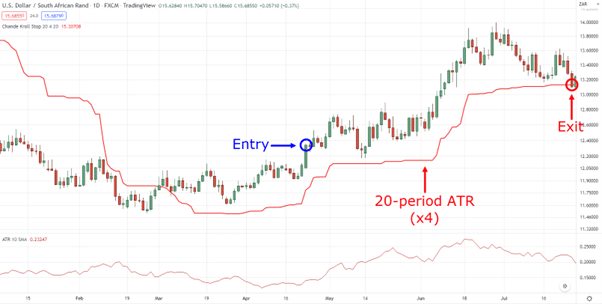
Pretty awesome, right?
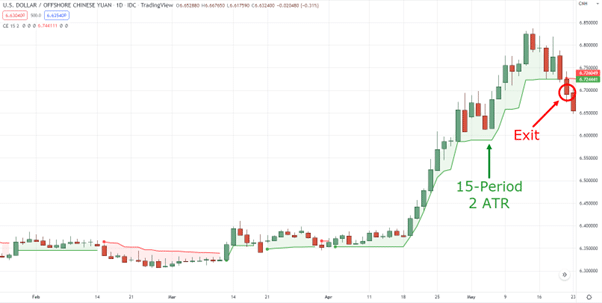
If volatility is high, look for pullback opportunities
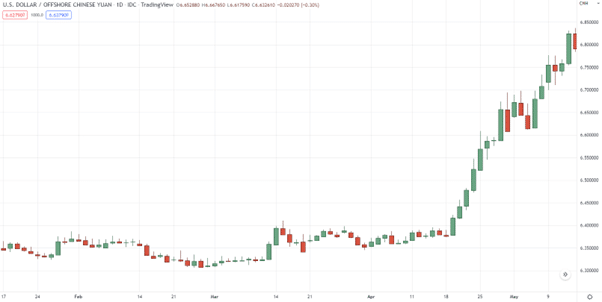
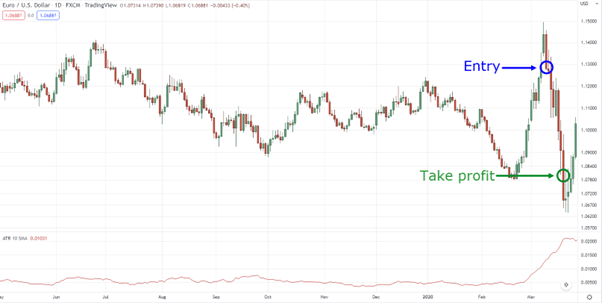
As you can see on EURUSD daily timeframe:
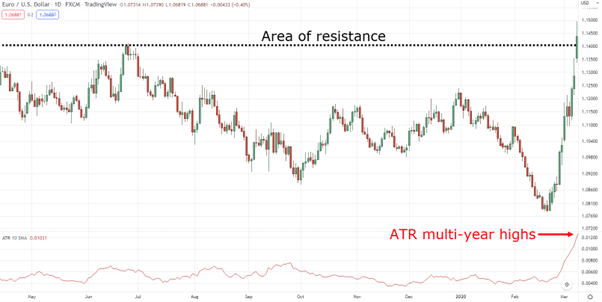
Volatility has picked up so much that it broke the area of resistance!
This is a sign that the “rubber band” is overstretched and about to reverse.
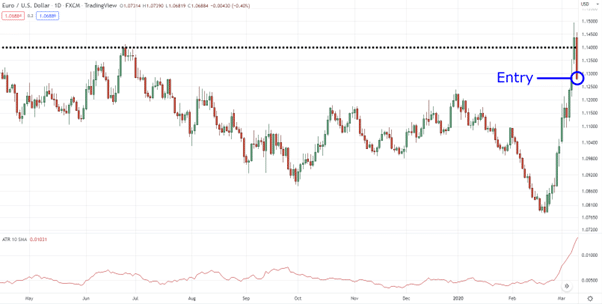
Since the price is currently at the area of resistance, this gives us a reference on where to enter our trades:
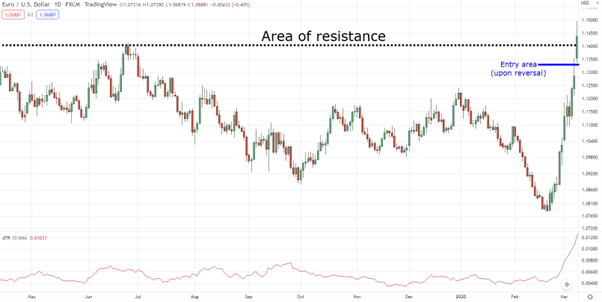
You can either place a sell stop order below resistance when the price reverses, or wait for a bearish engulfing candle:
So, a while ago, we used a trailing stop loss to take our profits.
But in this case, I highly suggest that you have fixed target profits.
Where would that be?
The nearest swing low, of course!
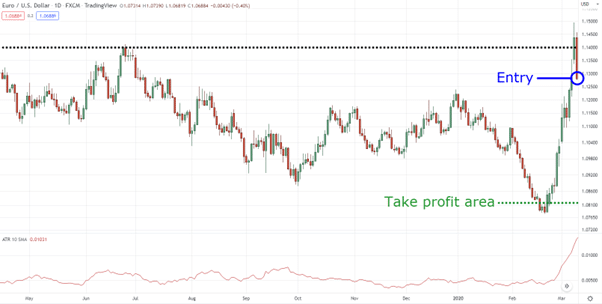
Eventually, the market was able to reach it:
That’s pretty much it!
Of course, I’ve shown you a lot of winning trades today.
But in actual trading, there will be losing trades and times when you might be uncertain whether the volatility is high or low on your Average True Range Indicator!
Nonetheless…
This strategy only simply piggy-backs on the principle that the markets go from loud to silent and vice-versa:

And that the longer the market is silent, the higher the chance it will break out and vice-versa.
All good?
Then let’s do a quick recap on what you’ve learned today.
Conclusion
- The Average True Range is an indicator that measures volatility in the markets
- Finding the Average True Range period depends on how you want to use the indicator and the type of trend you aim to capture
- You can spot potential market reversals with the Average True Range if the volatility has been loud or silent for a long period
There you go!
Now over to you…
How do you use the Average True Range indicator?
Were you able to apply some of these concepts to your trading?
Let me know in the comments below!
There are secrets to using the ATR and now I have learned some of them. I still want to know if I can use the ATR line on a Yahoo chart or the ATR column on the Finviz screener OR if it is necessary to create the ATR formula for each stock/etf.
Hey there CD, one way or another, I believe it’s possible on Finviz, with putting the ATR on Yahoo chart, that I’m not sure
Nonetheless, plotting ATR values one by one is very unproductive, so best find something that can automate it for you!