USDJPY Weekly Chart:
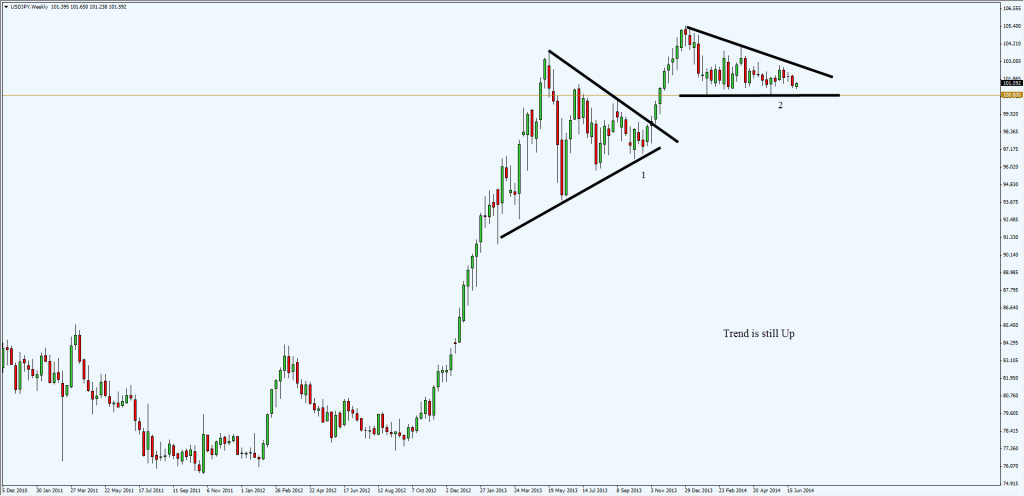
The weekly chart shows that USDJPY has been in a steady uptrend since Oct 2012.
Notice the 1st triangle pattern that took 25 weeks to form before it finally broke out.
Now, we have another potential triangle pattern which has been consolidating for about 27 weeks now.
If the historical pattern holds true, we should see another breakout in the coming weeks.
The Daily Chart:
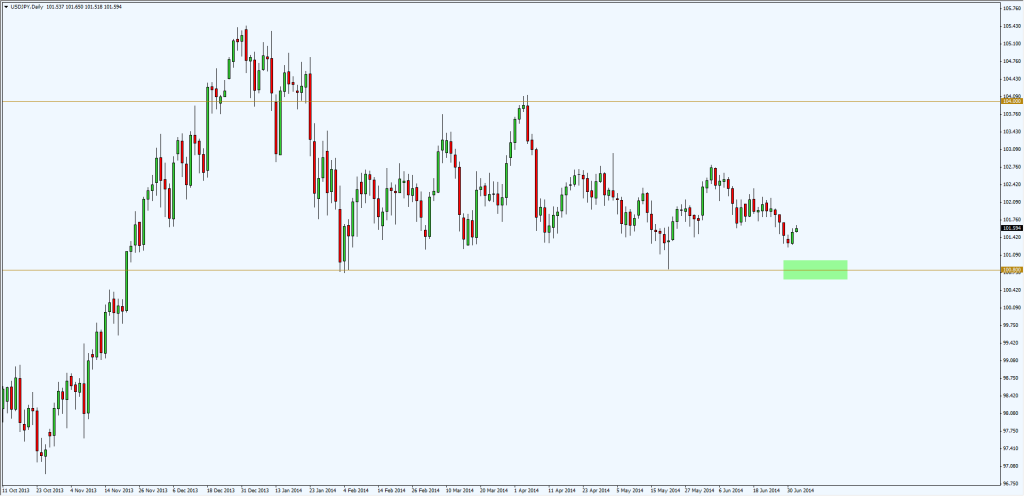
The daily chart here shows this currency consolidating between 101 & 104.
Looking to long at 101
Stop loss 70 pips
1st target at 102.60
I hope you have found this post helpful, if you have any questions related to trading, please do not hesitate to reach out. I always love to help my audience in finding their desired information.
also, go through my blog section I have written articles on almost every topic related to trading. As always comment down your thoughts on the post and what you liked and didn’t about the post, It helps me create better content for you and provide the exact piece of information you are looking for. Cheers


