This post is written by Jet Toyco, a trader and trading coach.
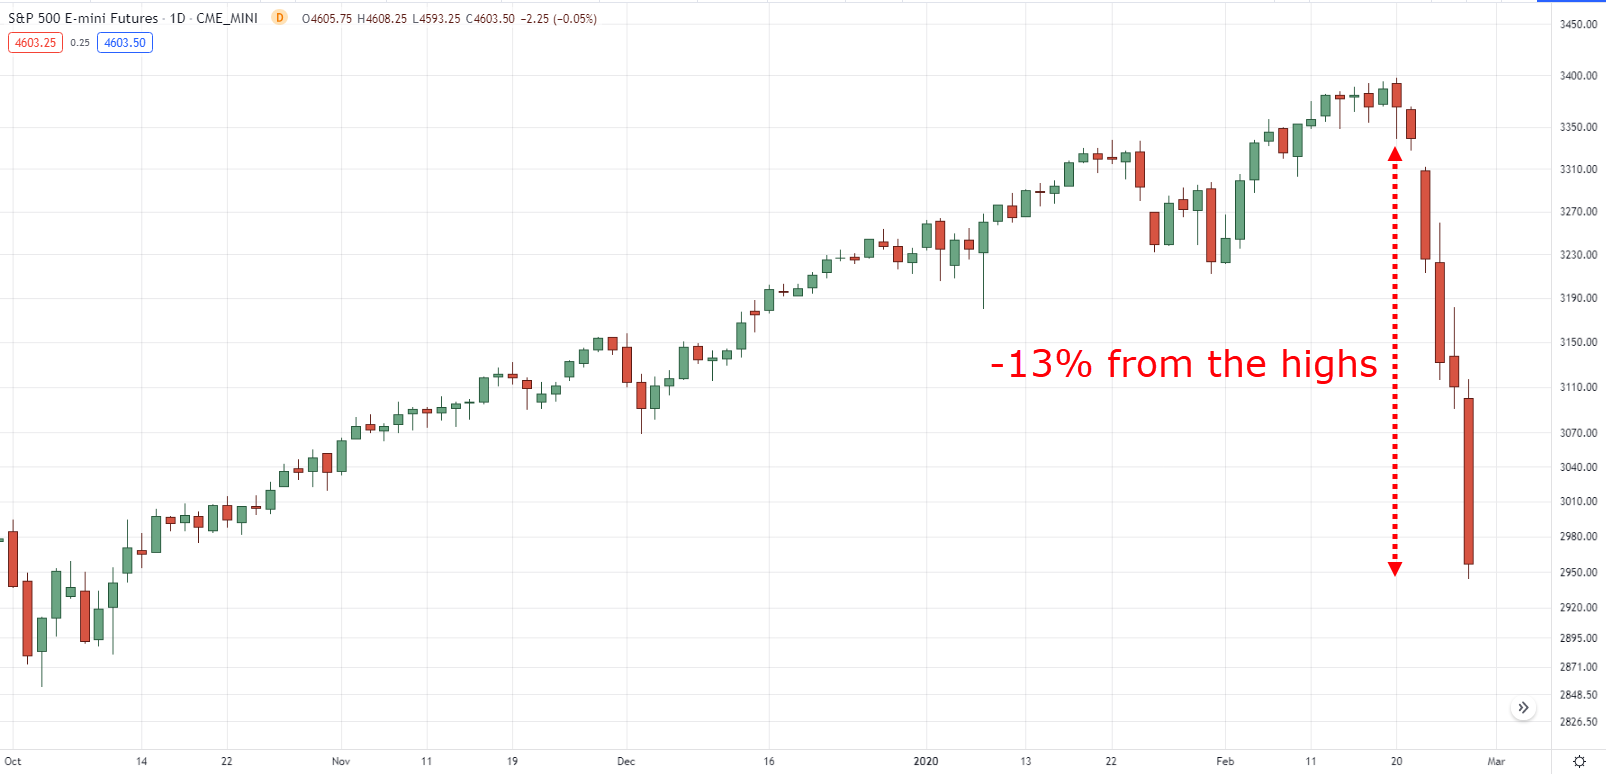
A stock market correction happens when an index such as the S&P500 falls below 10% or more from its highs.
Correction on S&P 500 daily timeframe:
Also, stock market corrections usually last for about 3-4 months.
But here’s the ugly truth…
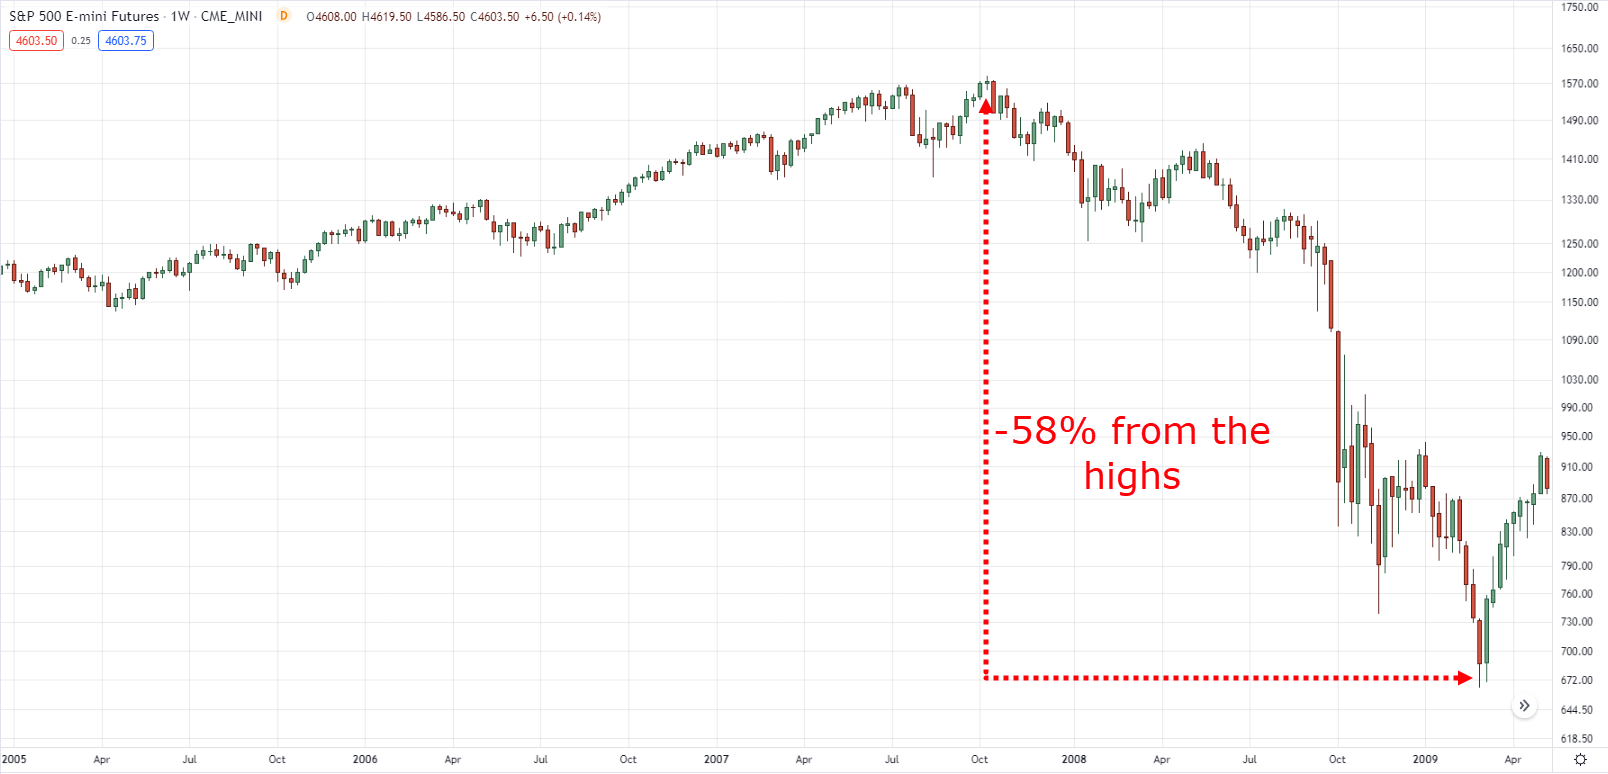
Stock market corrections can turn into a bear market.
Bear market on S&P 500 weekly timeframe:
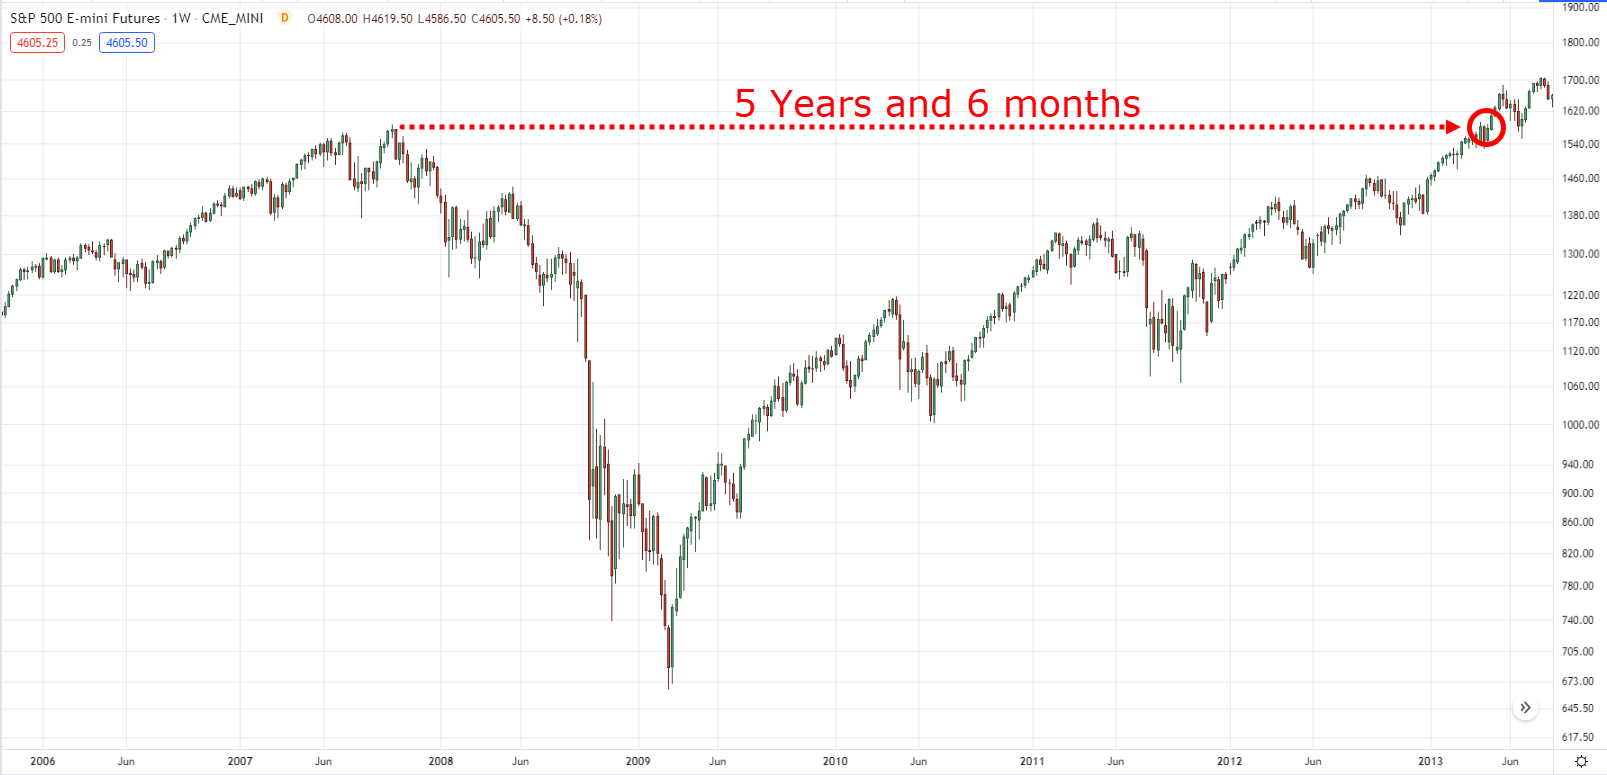
And can take years to recover.
Recovery from the bear market on S&P 500 weekly timeframe:
That’s why in today’s guide…
I won’t waste your time telling you what stock market corrections are and when they end.
Instead, I will teach you practical trading techniques on how you can navigate this market condition.
So that you could reduce potential losses and potentially make profits in a stock market correction.
Are you ready?
Then let’s get started.
#1: Apply A Fool-Proof Portfolio Defense Mechanism
Before I share with you this secret “mechanism.”
Let’s first have a quick lesson on risk management.
Shall we?
How to apply risk management on a stock
Let’s say you have $2,500 on your portfolio.
When you buy a stock, you’ll purchase shares that are worth no more than 10% of your portfolio balance – a maximum of $250 worth of shares per stock.
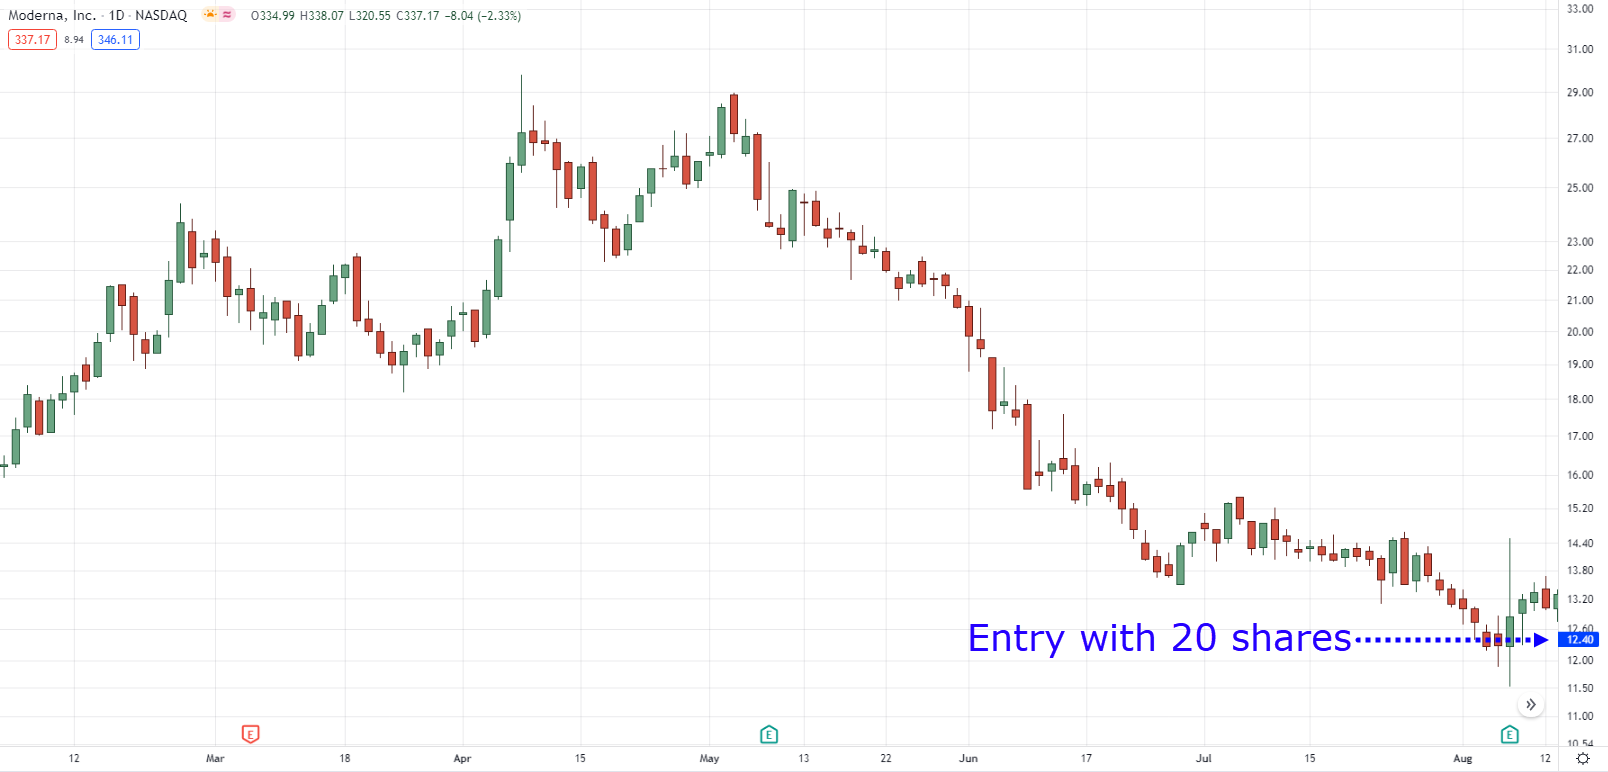
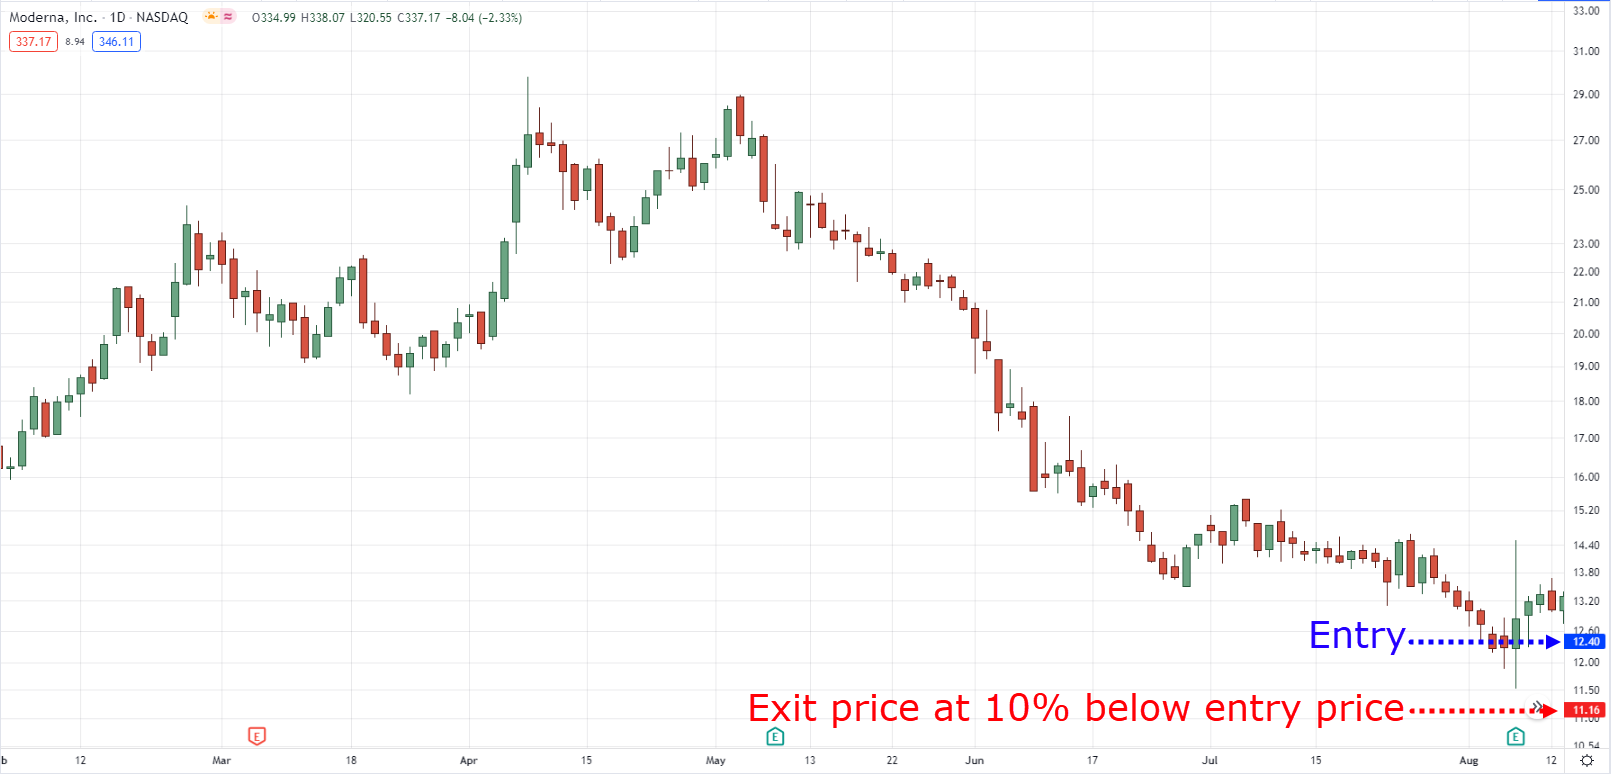
So if you’re looking to buy MRNA at $12.4 per share, you should enter the trade with not more than 20 shares.
Position sizing on MRNA daily timeframe:
Now we’re not done yet!
Because you want to make sure that you have a stop loss order that’s -10% of your entry price!
So if your entry price is $12.4, you should also have a stop loss order on 11.16.
Stop loss order on MRNA daily timeframe:
Okay, I know what you’re thinking right now:
“Why a 10% allocation and why a -10% stop loss from entry price?”
“What’s the purpose of this?”
Here’s the real reason why…
If you allocate not more than 10% on stock and have a stop loss price -10% away from your entry…
Then you won’t lose more than 1% on the trade.
If you enter a MRNA at $12.4 per share with 20 shares, you shouldn’t lose more than $25 if the price hits your stop loss.
Boom, there you go!
To put things in perspective…
- Allocation per trade: 10% of the portfolio
- Stop loss price: -10% from the entry price
- Maximum risk per trade: 1%
- Maximum open trade: 10 trades
Now…
As a person who almost flunked math at 6th grade, it can be confusing or intimidating.
So to help you out…
I’ve specially made this interactive position sizing calculator just for you!
Now that you’re equipped with this powerful knowledge let’s get onto the meat of this section.
The portfolio defense mechanism method
Put yourself in this scenario:
We are in a stock market correction.
Before, every stock you touch turns to gold.
Now, every stock you touch turns into crap.
What should you do?
Recall:
Previously, I recommended you allocate 10% of your portfolio per trade.
But in a stock market correction or a losing streak, you must play more defensively.
Which is to allocate 5% per trade.
That’s right, that small!
So, if allocating 10% gives you a maximum open trades of 10.
Allocating 5% gives you a maximum open trades of 20.
Additionally, the stop loss price remains the same, which is -10% from the entry price.
This, in turn, would give you a maximum risk per trade of 0.5%
That small as well!
You see, not only does this increases your chances of finding a stock that outperforms the market during a stock market correction…
But it also reduces your losses to a microscopic level that so it wouldn’t affect you too much psychologically if a stock didn’t work out.
Again, to put things into perspective for this defense mechanism…
- Allocation per trade: 5% of the portfolio
- Stop loss price: -10% from the entry price
- Maximum risk per trade: 0.5%
- Maximum open trade: 20 trades
I know what you’re thinking:
“Can’t I just stay in cash and wait for the stock market correction pass before I buy to keep it simple?”
The answer?
Yes!
You can stay in cash.
But then again, you’ll never really know when stock market corrections end.
By the time you decide to hop into trades when the correction is “over,” there’s a chance you would’ve missed a couple of opportunities already.
So you’d want to apply this defense mechanism so that you can reduce losses during hard times and be precisely involved when the next bull run happens.
Here’s the thing though:
Diversifying your portfolio may reduce potential profits.
However, it can also reduce your potential losses.
So, reduce your allocation, reduce your risk per trade so that you can diversify.
Makes sense?
With that said, next comes the crucial part…
How do you know which “high-quality” stocks to trade out of the thousand stocks out there?
Which stocks would you want to diversify your portfolio into?
Let me show you in the next section…
#2: Identify and Follow Market Leaders
Not putting all your “eggs” in one basket is one thing.
But how do you know if that basket’s built to last?
Sure, you can get your friend’s or even your dog’s opinion, but how can you be so sure?
You can’t blame them if that basket turned out to be crap since it’s you who makes the final call, right?
It’s the same thing with stocks.
How can you repeatedly and objectively look for “good” stocks to trade without relying on someone else’s opinions?
You guessed it!
Stock screeners.
Now…
There are many ways on how you could use a stock screener as the combinations are endless.
At the same time, we’re not here to mix and match screener settings that don’t make sense.
That’s why we’ll use a time and tested principle from William O’ Neil’s book:
“What seems too high in price and risky to the majority usually goes higher, and what seems low and cheap usually goes lower.”
Imagine seeing a stock that’s consistently performing so well despite a stock market correction…
Now that’s something.
So to put this into action, here are two filter settings that can quantify and represent this principle:
- 52-week highs
- Rate of change
Let me show you how to apply and use them.
52-week highs
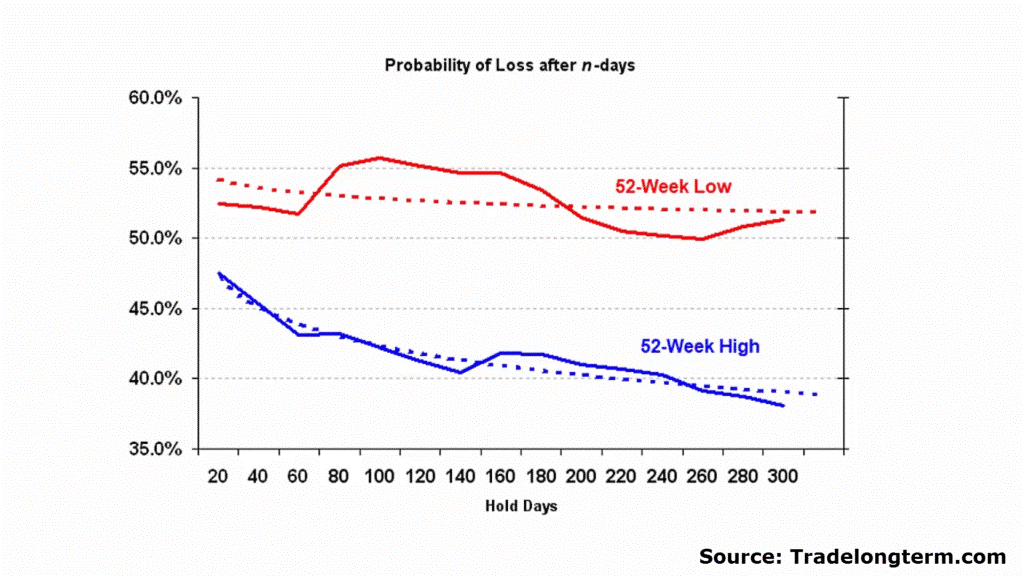
Based on a historical backtest study, your chances of losing money decreases as time goes on whenever you trade stocks at their 52-week highs.
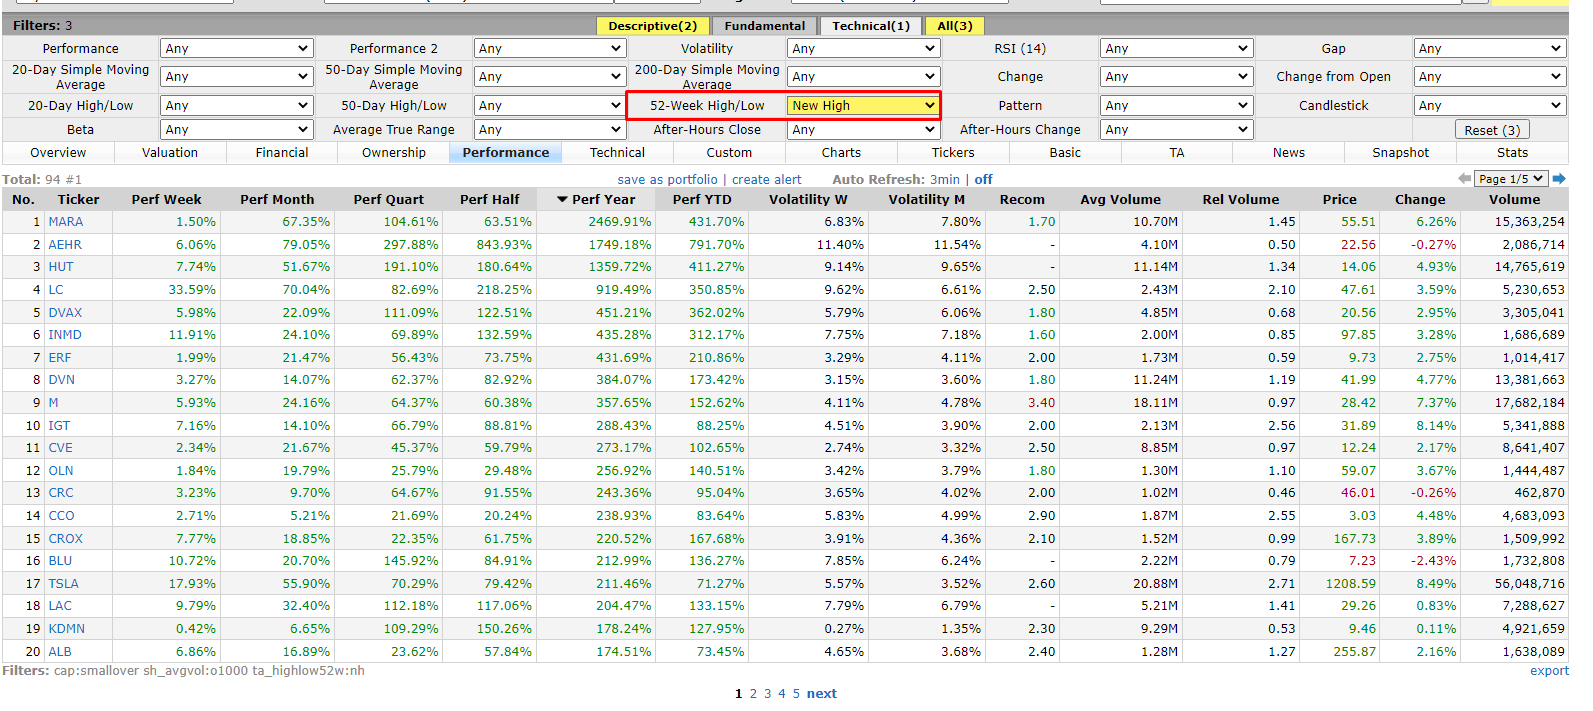
I’m sure most stock screeners have this setting.
However, feel free to use this setting on a free stock screener called finviz.
Now, if you want more flexibility in looking for market leaders below 52 weeks, you can consider the rate of change.
Rate of change
The rate of change determines how fast a stock has moved further in price given a certain amount of period.
The best part?
You can modify how far you want to go!
It means that if you want to look for stock market leaders within the last three months, then you have the freedom to change the settings and use the 12-week rate of change period.
Why is this important?
Well, if you trade the lower timeframes, then waiting for a 52-week high would be irrelevant.
So you’d want more flexibility on which tools to use.
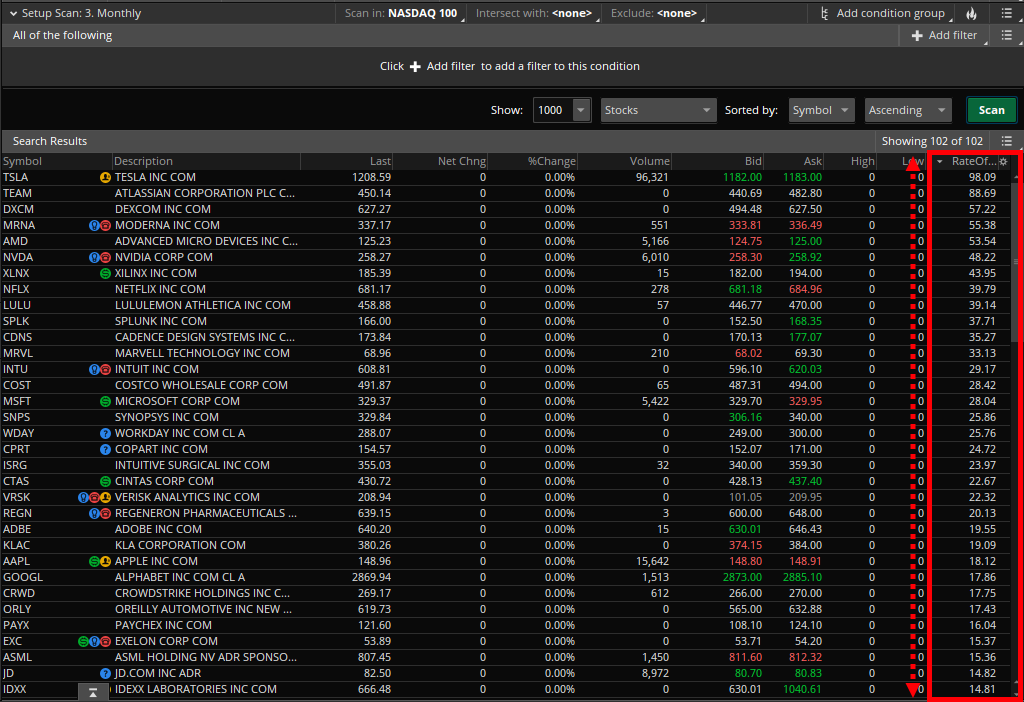
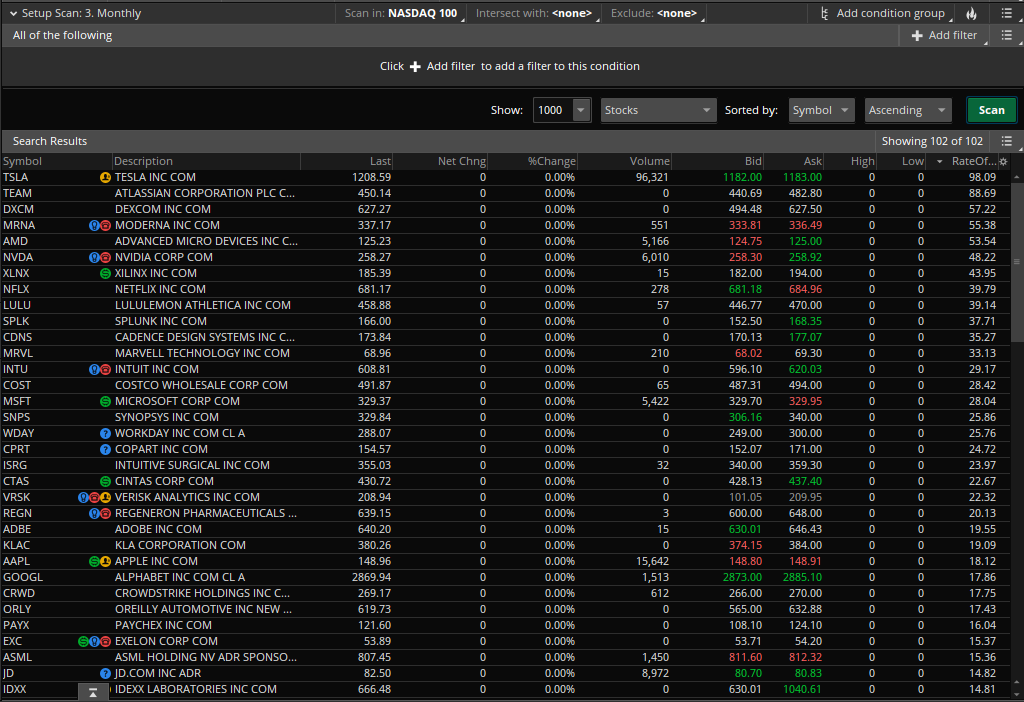
Nonetheless, if you are currently using the ThinkorSwim platform, you can filter your screener results using the 50-week rate of change:
Now that you’ve set up your screener and hit scan, what’s next?
What should you do now?
Let me tell you…
Rank and prioritize
Let’s go back to the results you had:
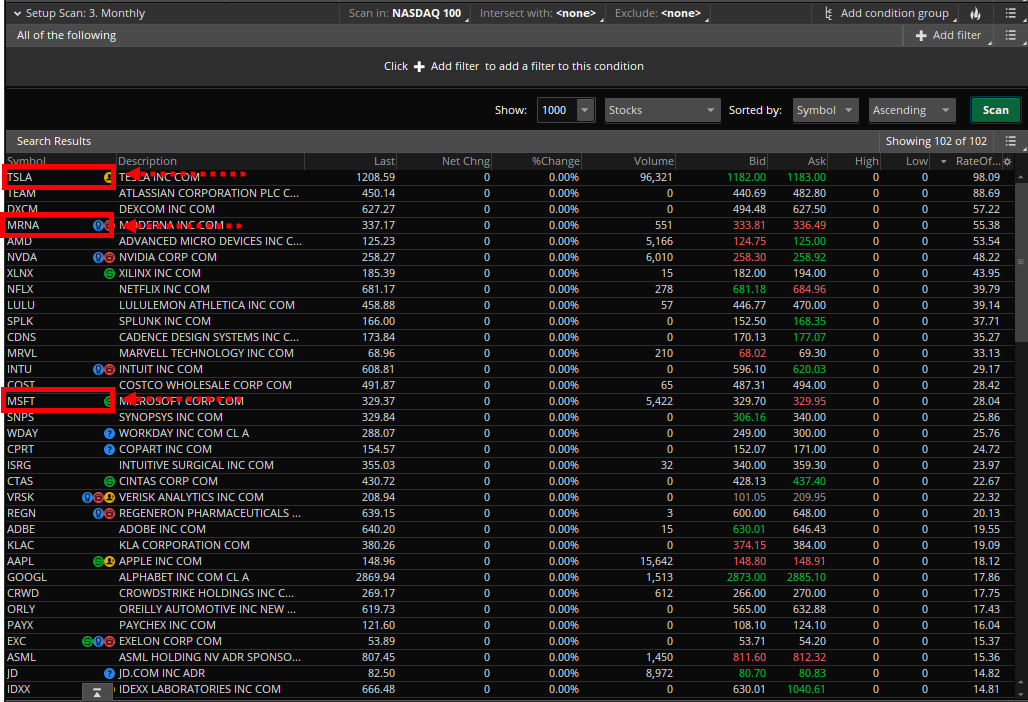
Since you’re screening for market leaders, you’d want to pick leaders as well.
So if you’ve found trading setups on TSLA, MRNA, and MSFT.
Then you want to make sure that you prioritize entering TSLA first, MRNA second, and so on.
But to make myself clear…
You want to make sure that they meet your trading strategy’s rules first before you enter the trade and not enter each stock immediately based on the screener’s results!
Clear?
Good.
With that out of the way…
We’ll now be honing into the nitty-gritty details on how you can manage your trades, now that you have a bird’s eye view on how to manage your portfolio.
Don’t miss this.
So go to the bathroom, drink a glass of water, and keep reading.
#3: Implement A Powerful Trade Management Technique That Reduces Risk and Increases Rewards
What if I told you…
That there’s a way to reduce your risk and potentially increase your rewards in a single trade?
Well, you already know the “reducing your risk” part in the previous sections.
So let’s give that knowledge a bit of an upgrade:
- Allocate small
- Scale-in and move stop to breakeven
- Trail your stop loss
Let me break it down for you…
1. Allocate small
Here’s an example:
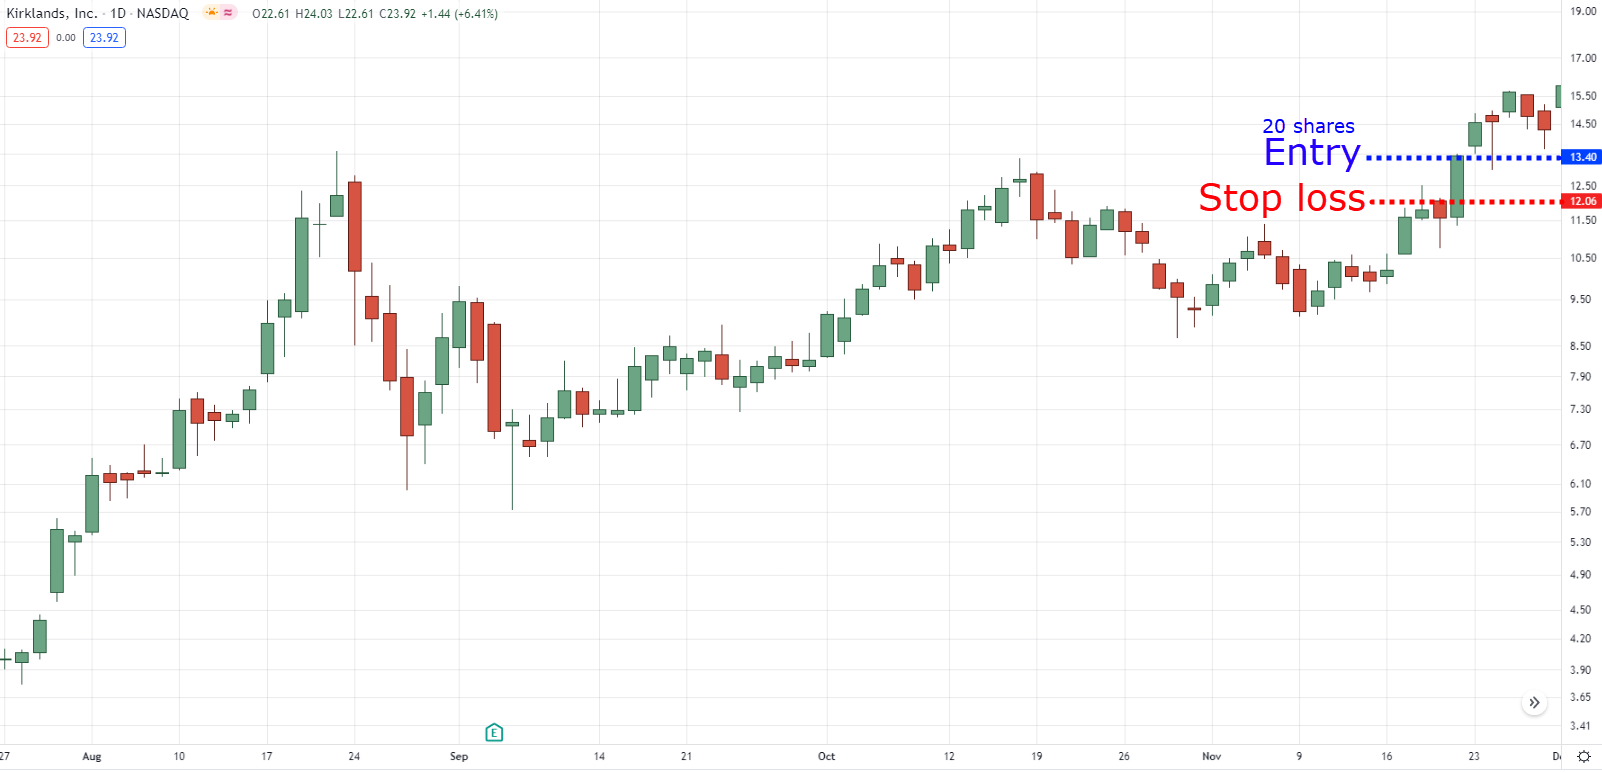
You have a $5,000 account and entered a trade on TSLA with a 5% allocation along with a -10% stop loss order.
Trade management on KIRK daily timeframe:
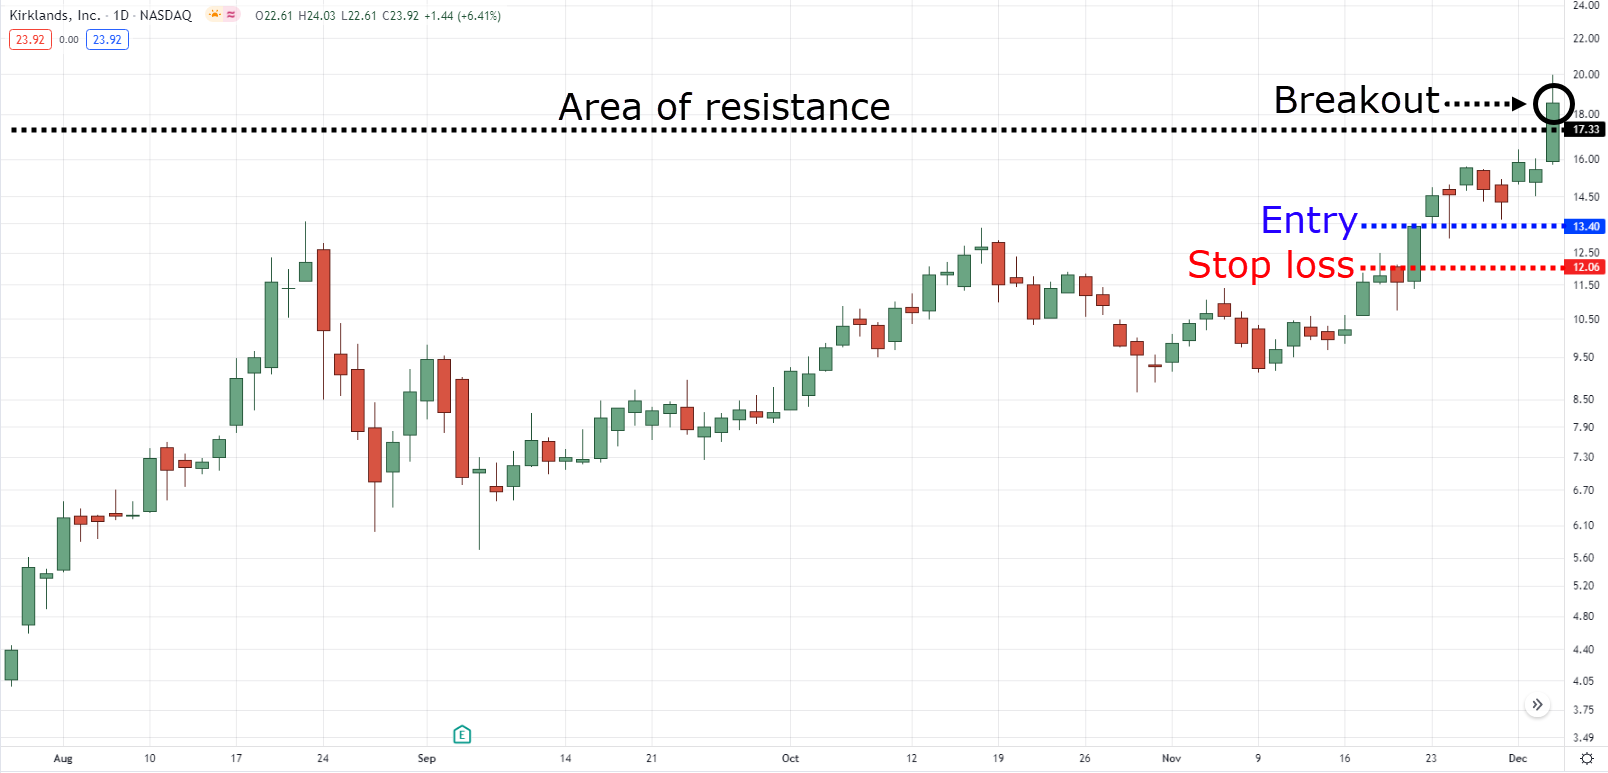
What you now want to do is wait for the stock’s price to move in your favor and to break and close above the nearest swing high or area of resistance.
Breakout on KIRK daily timeframe:
Once it makes a clear breakout, the next thing you want to do is to…
2. Scale-in and move stop loss to breakeven
Imagine:
You’re a hopeless romantic person who’s received a lot of rejections.
But you’re not giving up and still trying to determine who to date.
Of course, it would make more sense if you would “test the waters” first then determine if a person is worth investing your time into instead of going all-in and getting hurt fast!
It’s the same thing with trading.
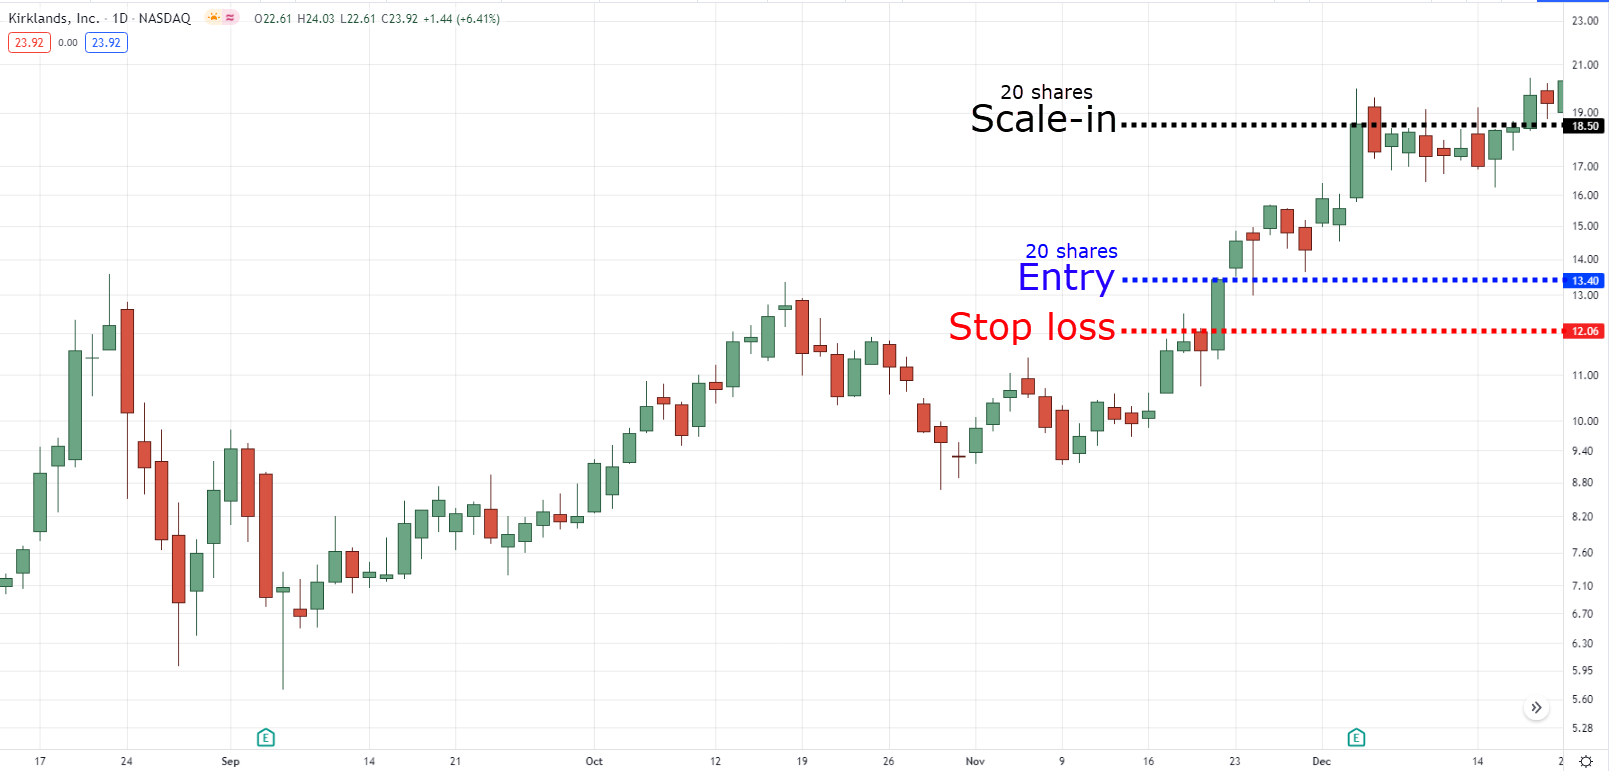
We want the stock to prove that it can perform first and then cast our votes to something that works by scaling in.
Remember…
We are in a stock market correction.
So what you want to do is to add another 5% allocation to your stock position.
Scale-in on KIRK daily timeframe:
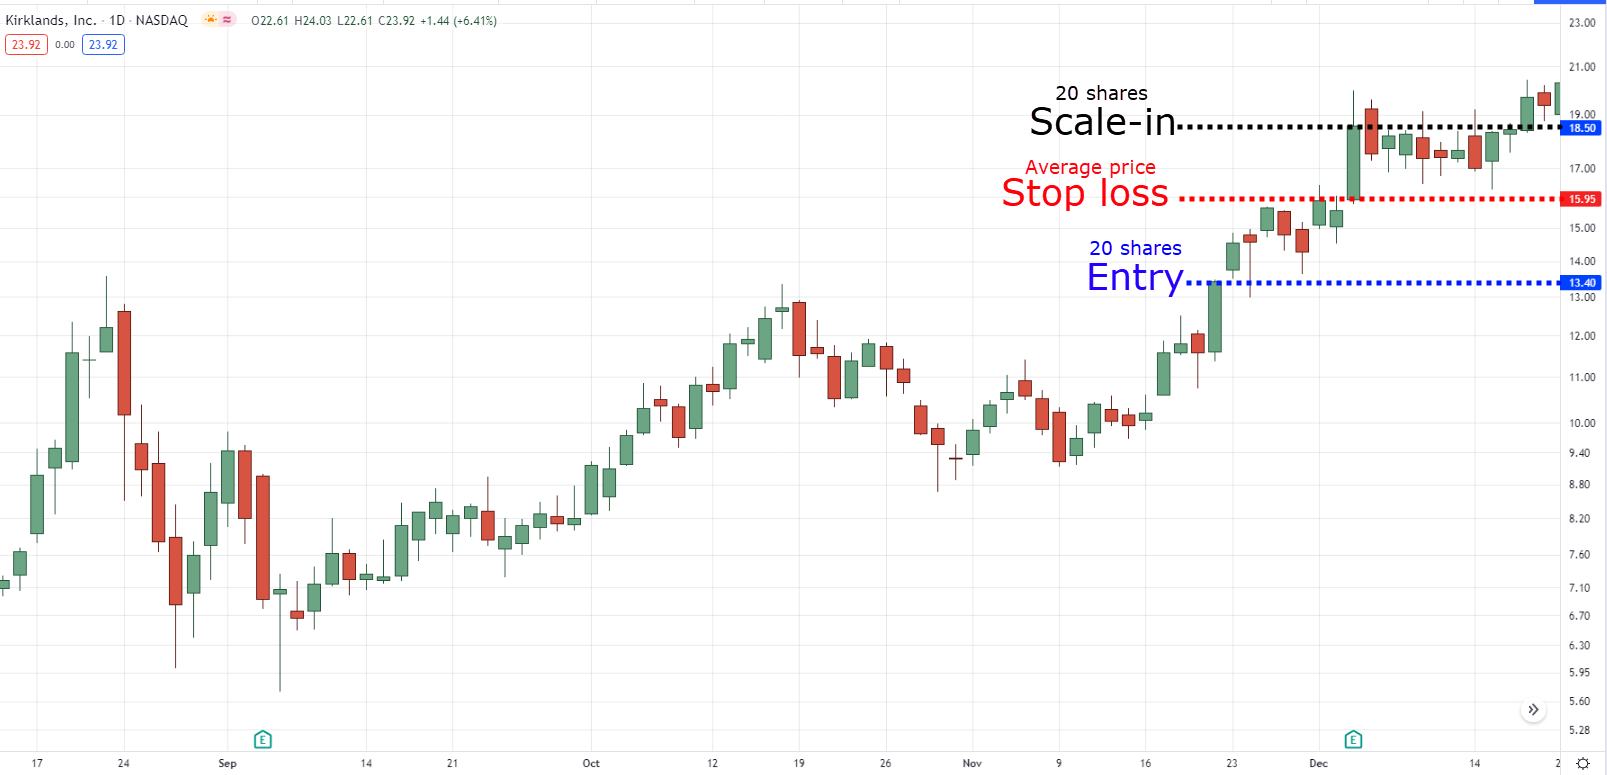
Then move your stop loss to breakeven (average price) based on the whole position where you won’t lose a single dime on the trade.
Stop loss at breakeven on KIRK daily timeframe:
Finally, the last thing you want to do is to…
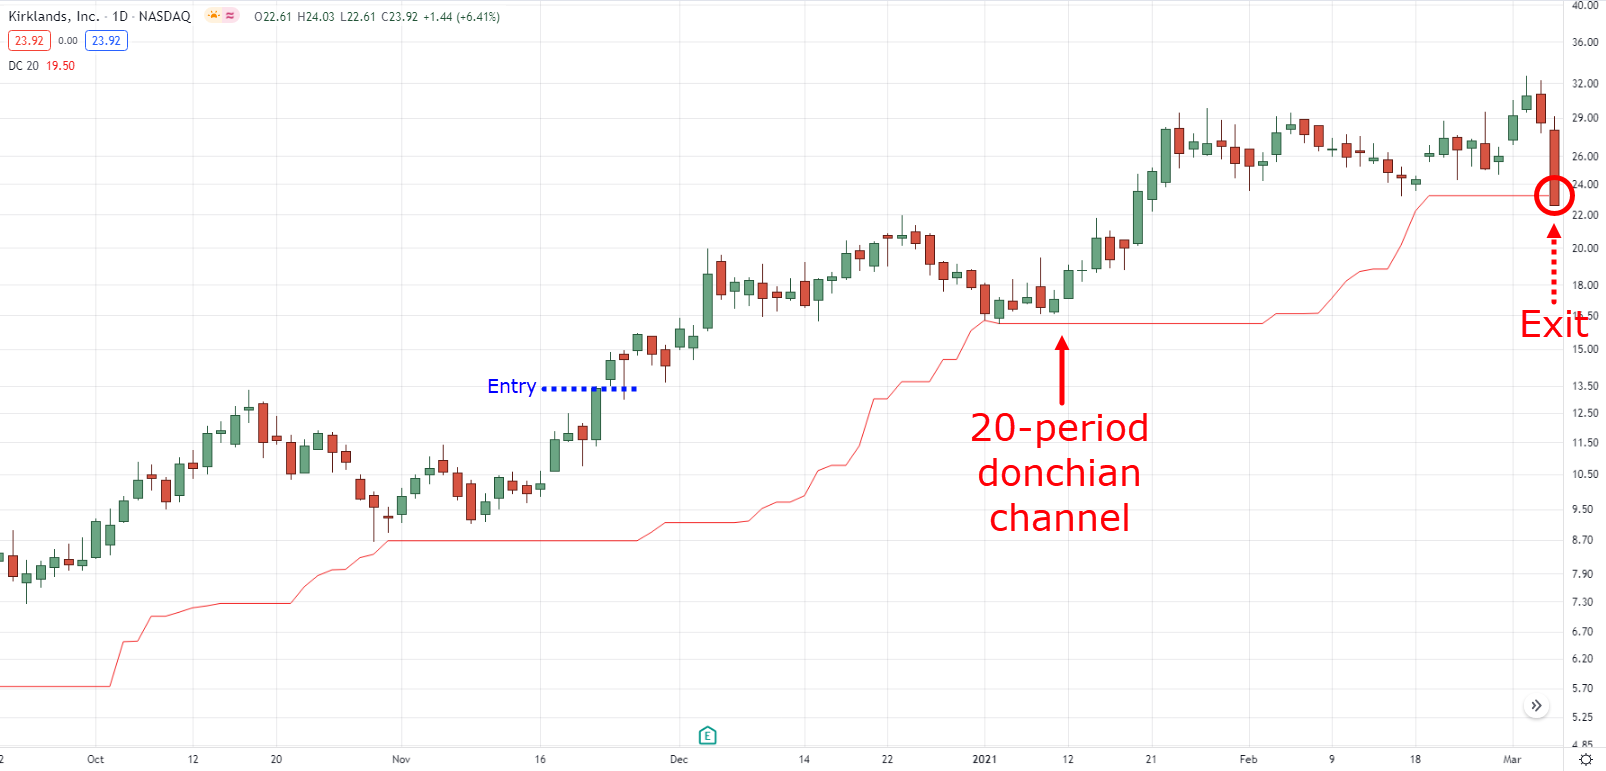
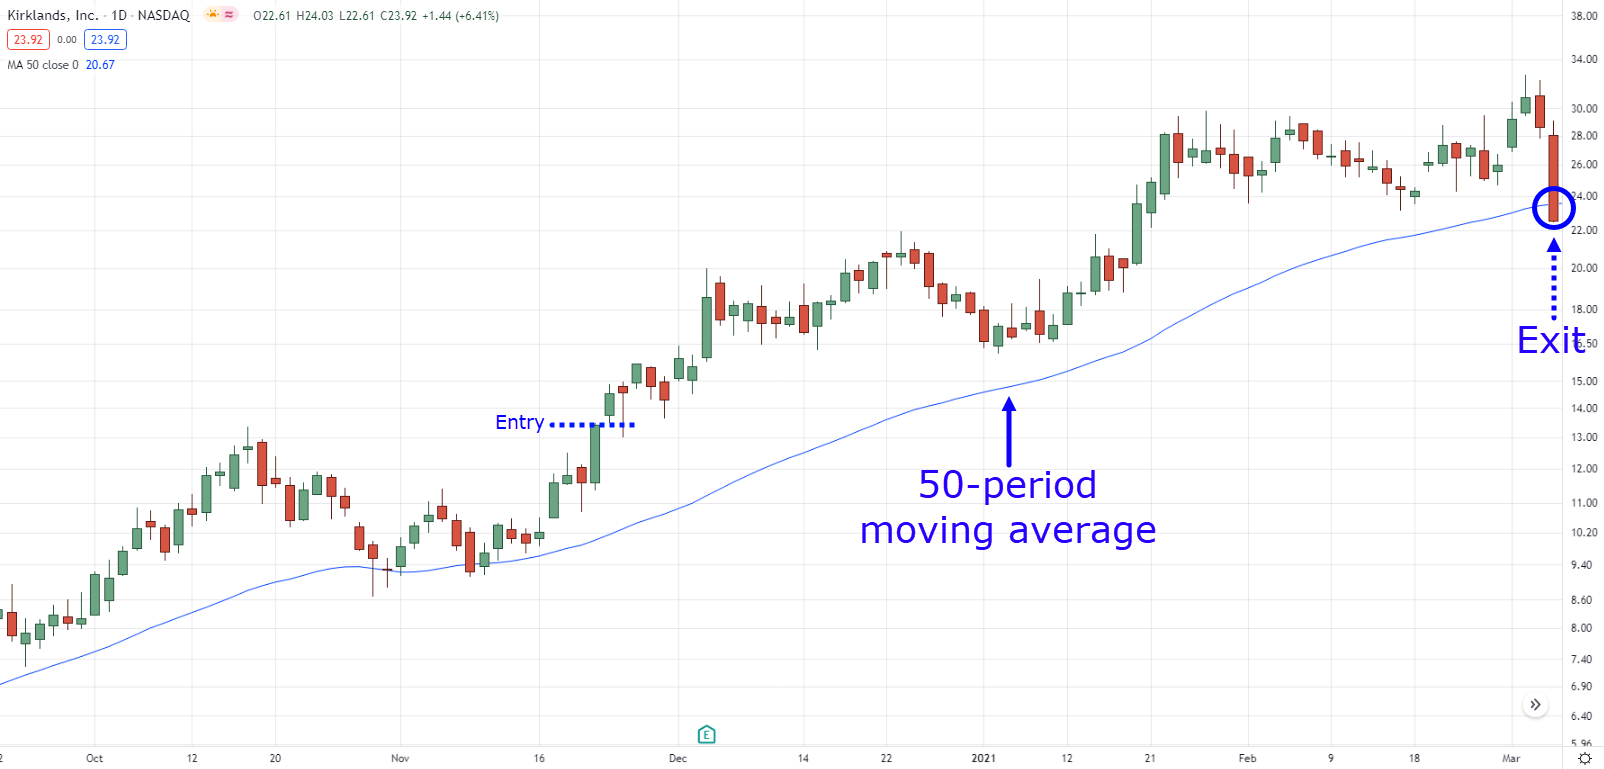
4. Trail your stop loss
There are so many ways on how to trail your stop loss.
But here’s what’s surprising…
The indicators don’t matter too much.
Whether you use a Donchian Channel trailing stop loss:
Moving Average trailing stop loss:
It doesn’t matter!
What matters is what type of trend you wish to capture to determine the indicator’s settings that allow you to achieve that goal.
That’s it!
Those are the three techniques you need to survive and profit from a stock market correction!
However, I have to be honest that this isn’t a fool-proof method and that there are downsides.
Such as exiting a trade at breakeven despite being in it for 2-3 months.
But just like every indicator, strategy, or concept out there…
Everything has its pros and cons.
That’s why you choose one that makes the most sense to you and one that you can apply consistently through good and bad times.
With that said…
What would you do when stock market correction ends and turns into a bull market?
Do you still allocate small?
Should you make tweaks to the screener?
Don’t worry, my friend…
I won’t leave you hanging to know what to do during the transition once the stock market correction ends.
#4: Go Full Force To Magnify Gains As The Correction Ends
Stock market corrections “usually” end after 3-4 months.
But as mentioned earlier, they can get worse or can last for a year or even more.
So there are no fixed rules that can predict when they end.
What’s the solution, then?
Look at the price.
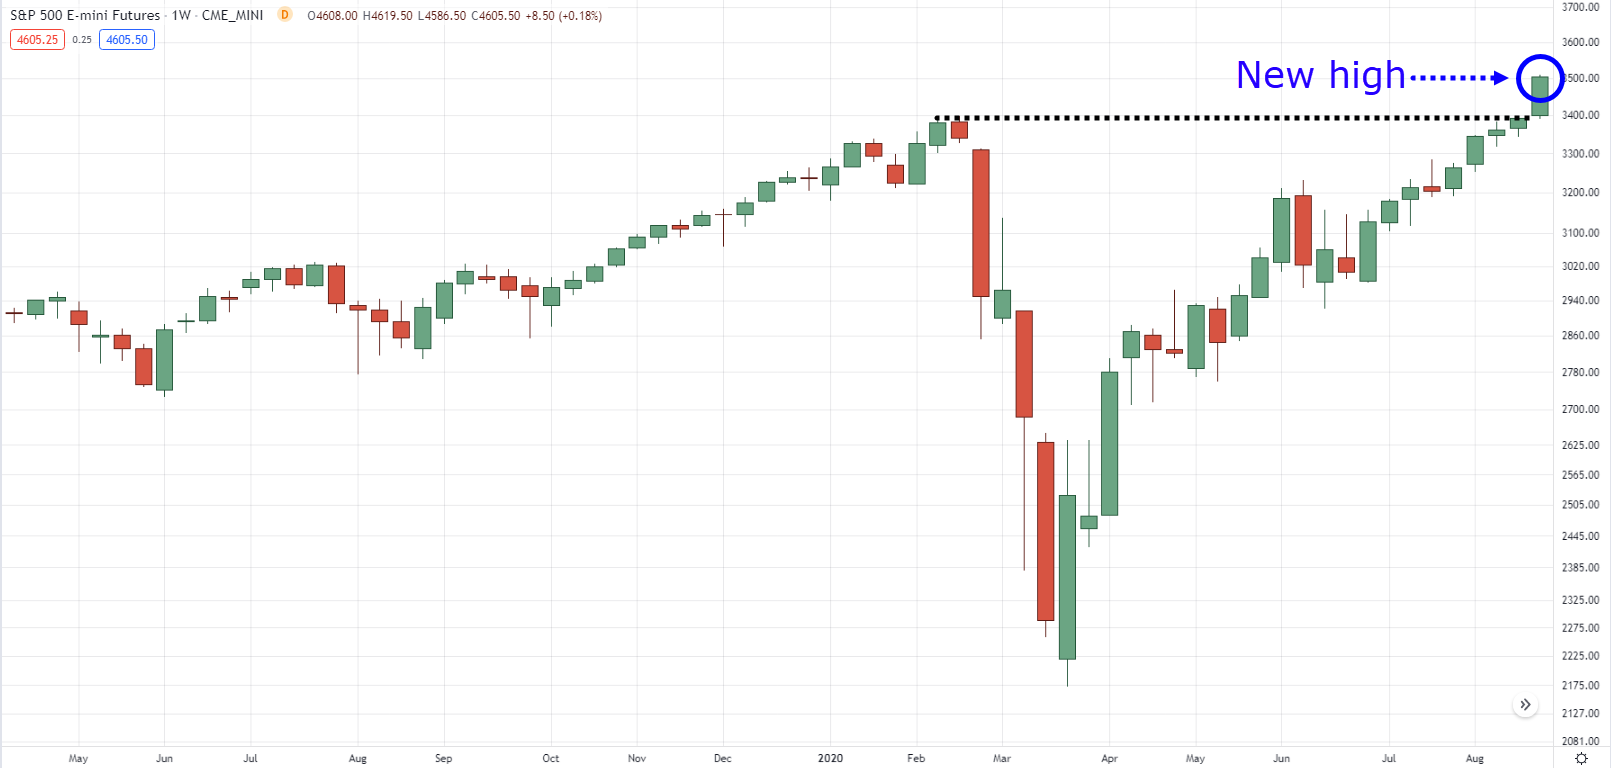
So once the stock index breaks and closes above its all-time highs…
Then there’s a chance that the stock market correction is over.
New high on S&P 500 weekly timeframe:
Now here’s the best part…
Everything that you’ve learned so far works at its full potential during bull markets.
Not surprising, am I right?
So the only thing that you should change is to Increase allocation.
Once the index has reached all-time highs, you can consider increasing your allocation from 5% to 10%.
It means that instead of diversifying with a maximum of 20 trades…
Your portfolio will now be more concentrated with a maximum of 10 positions with a 10% allocation which puts the tide in your favor as the market potentially transitions into a bull market.
However…
It’s crucial for you also to associate this with your trading performance.
Imagine you’re still losing money even though the stock market is making new highs…
Isn’t that weird?
If that happens, you must first take a hard look at your strategy or psychology before increasing your allocation.
Sounds good?
Learned something new today?
To make things even more transparent, let’s put all of this into perspective through a quick recap.
Conclusion
Trading during a stock market correction can undoubtedly be difficult as false breakouts and whipsaws happen more frequently.
However, these advanced money management and trade management gives you a fighting chance to profit from an adverse market condition:
- Apply a portfolio defense mechanism by allocating 5% per stock
- Follow market leaders by using screeners that filter stocks based on their 52-week highs and rate of change
- Apply a trade management method wherein you scale in once the stock breaks above its previous high/resistance, then trail your stop loss
If there’s one thing you should learn in today’s guide, it’s that it all boils down to how well you manage your risk and your trades instead of how well you mix and match indicators.
Now here’s what I’d like to know…
Have you traded through multiple stock market corrections or recessions?
What was your experience?
Let me know in the comments below!


Thanks for the great info, Jet. I started using a similar strategy approximately 10 days ago with a small portion of my account after remaining in cash for almost a month and it’s performing well. I will hone it to your recommendations and fill out my portfolio to weather this storm.
Cheers!
Awesome to hear that you’re taking things into action Randall, good luck!
Hey Rayner!Thank you for sharing.I wish there were friendly pdf option on the site.Thus we would be able to print the article easily.
Thanks for the suggestion!
We’ll see if we can consider it on our next articles 🙂
Hi. so how about the fees involved?
say certain brokerage’s fee is min $25 per transaction, by scaling in , wont it eat up the profits?
for this example the stock price rise to a very high level, but what if the stock only raised by $2, and u have 40 shares after scaling in?
Yes, fees would eat up some profits.
We didn’t include it in this article since fees can vary from broker to broker and from country to country.
But yes, when position sizing, you must take into account the fees as well!
Scaling in is also a complex topic of its own, so we’ll try to discuss it in a future guide!
Excellent
Thanks, Anand!
Good morning sir I’m very grateful to go through ur teaching team thanks sir but only thing that worries me is the how can I create my PayPal account plz help me out of this problem
Hi, Benji!
You can create here: https://www.paypal.com/
For assistance, you can email their support at https://www.paypal.com/us/smarthelp/contact-us/
Hope this helps!