In this video…
You’ll discover these three price action trading strategies that will help you better time your entries, and exits – and even “predict” market turning points:
Video Transcription
The first trading strategy that I have for you is what I call the…
Break Of Structure
This strategy is for traders, who find out they are entering the trades too early and then getting stopped out.
Let me give you an illustration…
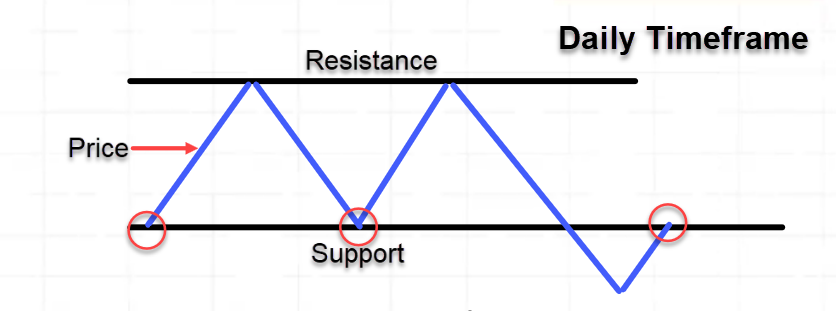
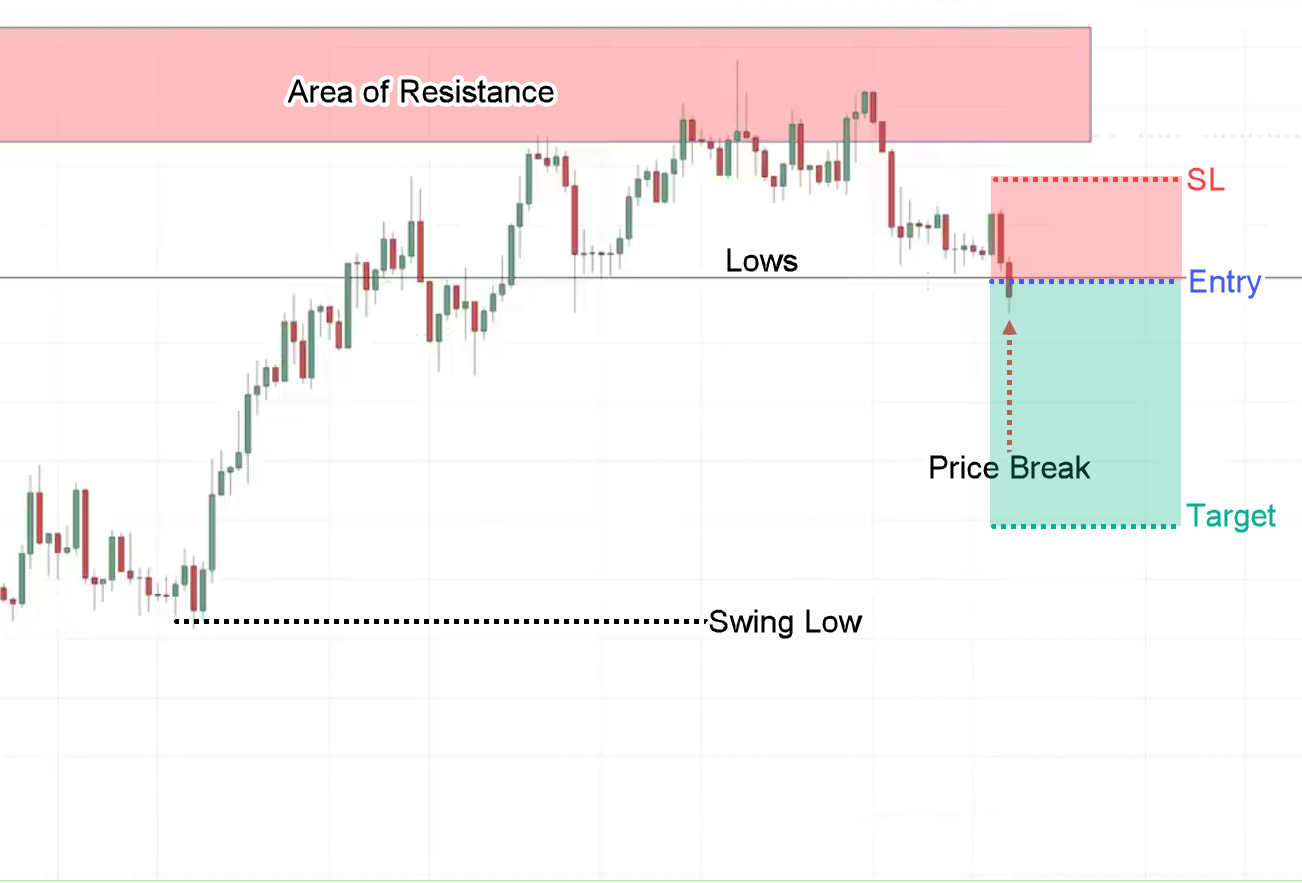
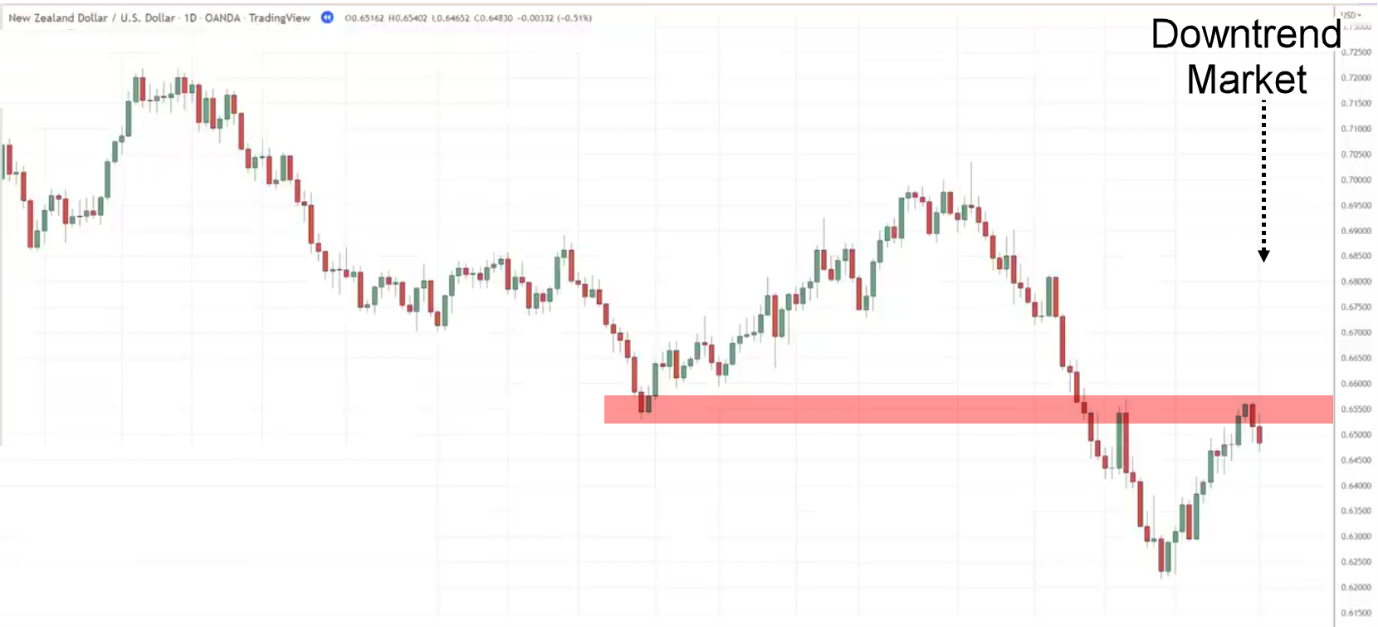
What we’re looking for in essence on the daily timeframe, is the market is in a range, and breaks below support approaching the area of resistance.
This is the previous support that could become resistance.
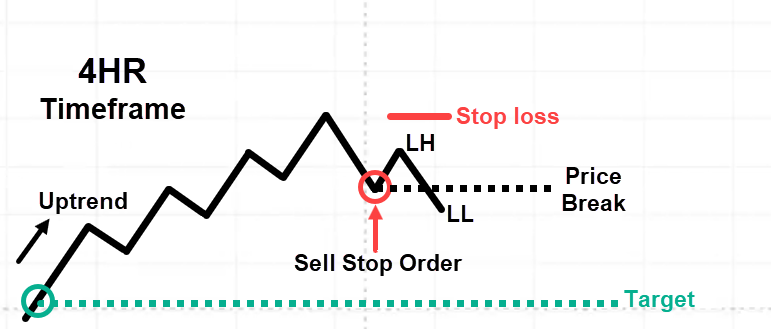
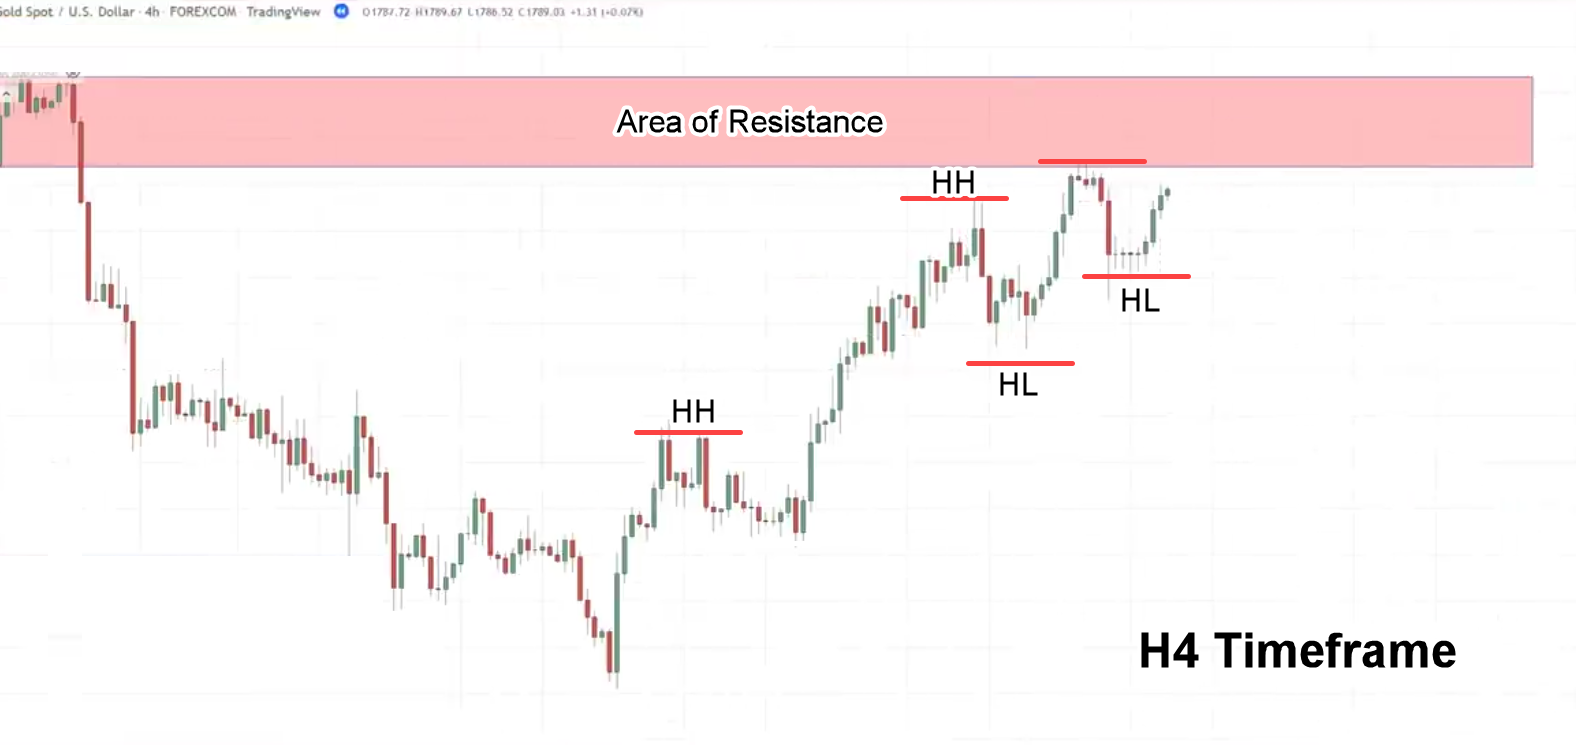
On the H4 timeframe, this is what you’re looking for:
You will see that a price is forming a series of higher highs and higher lows, otherwise known as an uptrend.
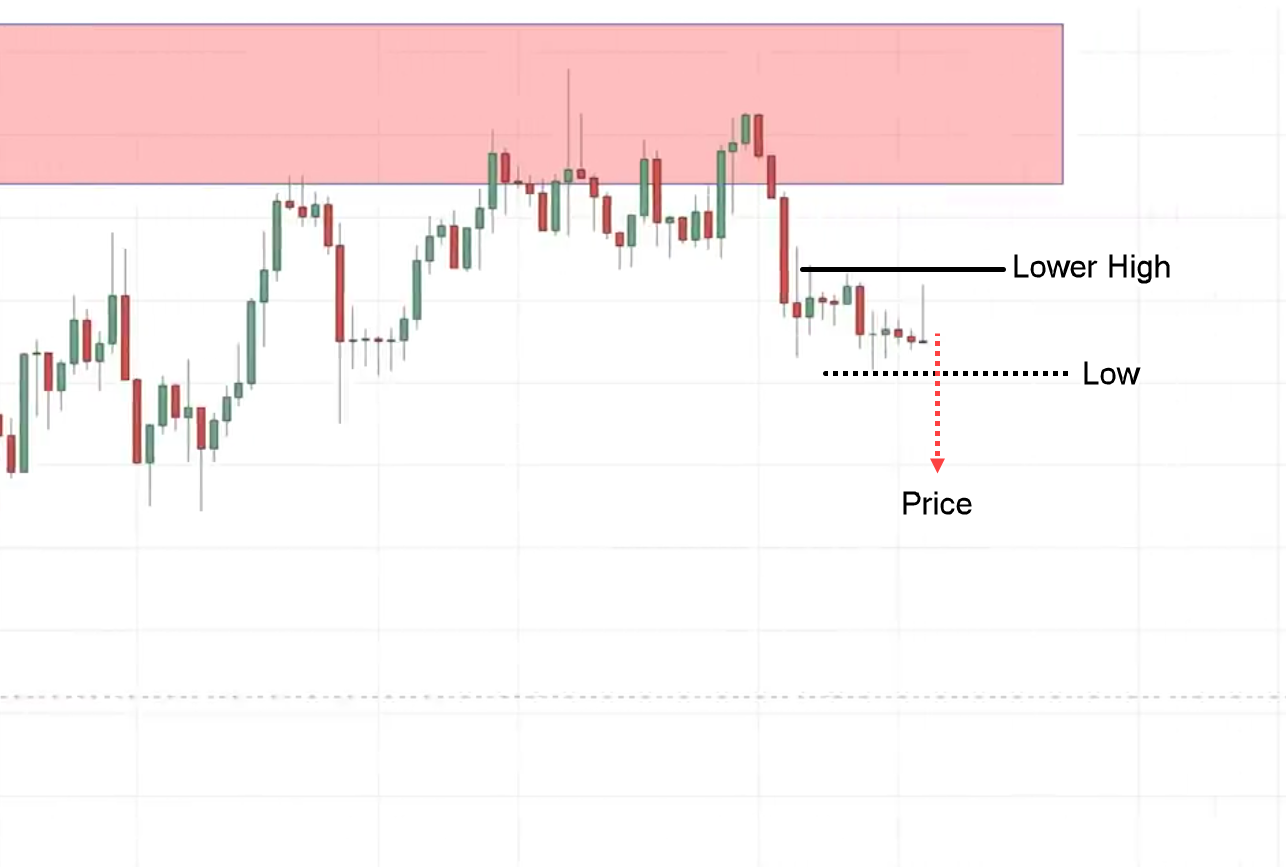
What you’re looking for is for the price to form a lower high and lower low.
It pulls back and goes up. At this critical point is where we place our sell-stop order.
Because if the price breaks below this low, we have a lower high and a lower low.
The stop loss can just go a distance above the highs
The target can be just before the extreme swing low.
Examples:
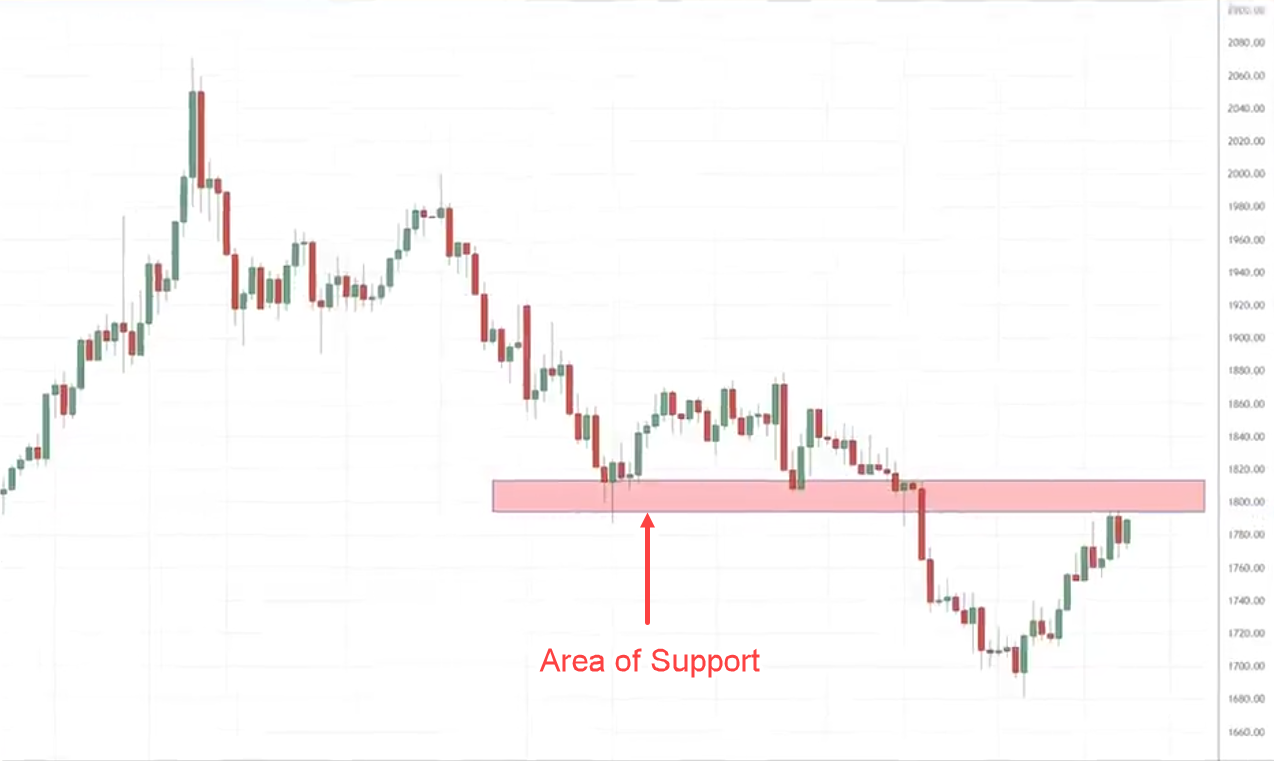
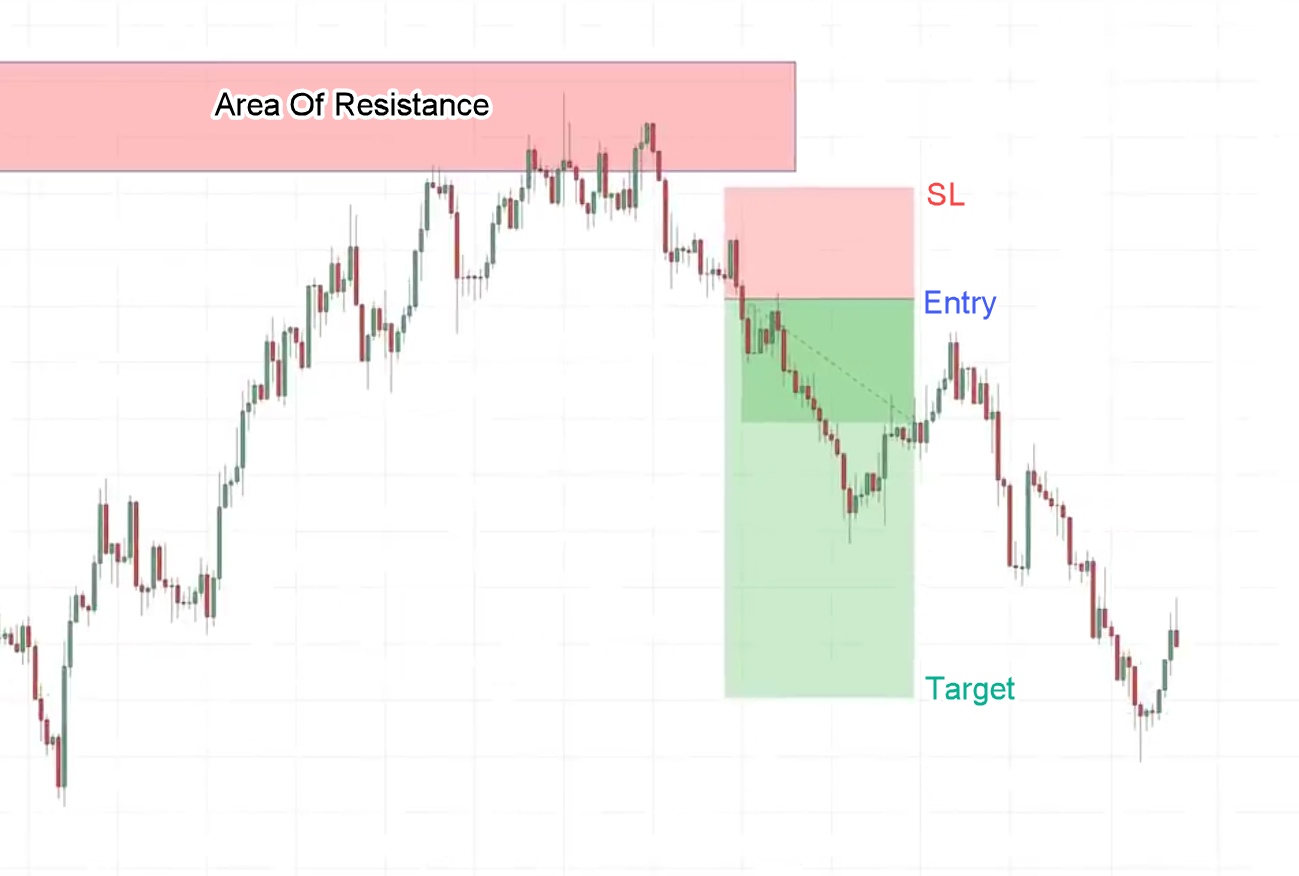
You can see that the price broke below this area of support which could become resistance.
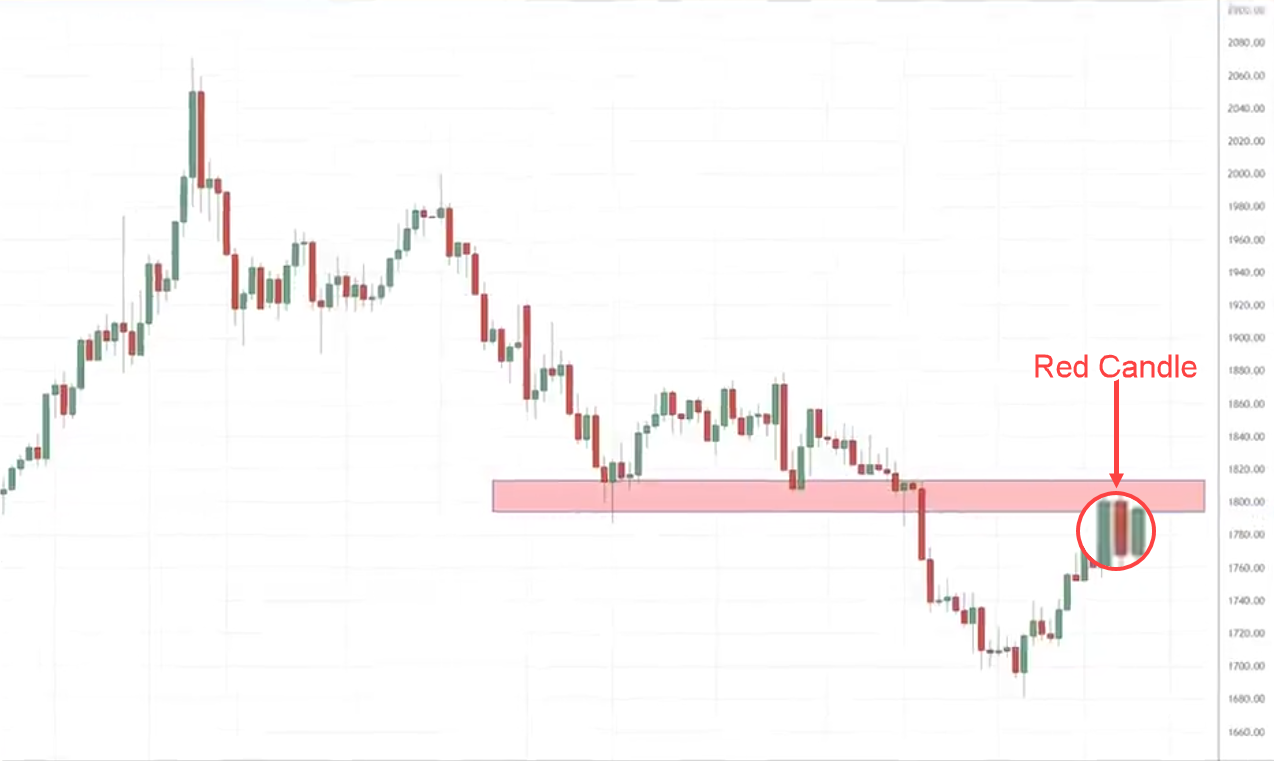
The mistake that many traders make is that whenever they see the market showing signs of reversal or having a lower close, they quickly go short on this particular candle. Here is what I mean:
Thinking the market is about to reverse lower.
Usually, what happens next is the price will do another move up before it reverts.
How do you not get caught in such a move?
This is where you can use the H4 timeframe which is the lower timeframe to help you better time your entry.
In this case, let’s go down to the H4 timeframe and see what’s going on.
The red box is the area of resistance that I’ve highlighted previously.
The price structure is still in an uptrend in this timeframe, with a series of higher highs and higher lows.
This tells you that the buyers are in control in this timeframe.
You want to see signs of reversal first before you look to short this market.
At this point, the market is still in an uptrend so be patient.
Let’s see what happens next…
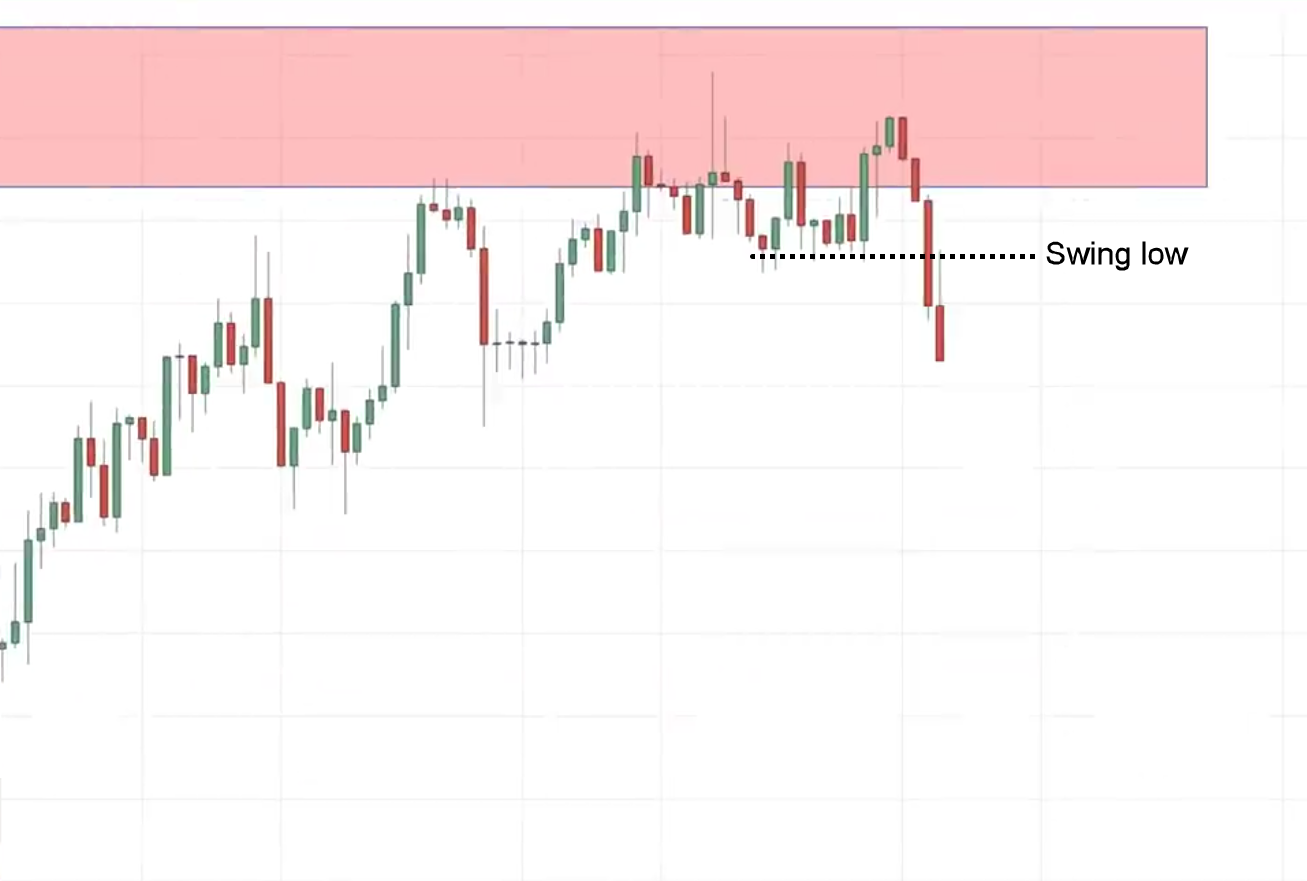
We have something interesting: the price has broken below the swing low.
The price now forming a lower high.
From the looks of this chart, we see that we have a lower high and if the price breaks below these lows we now have a lower high and a lower low.
This serves as an entry trigger to go short.
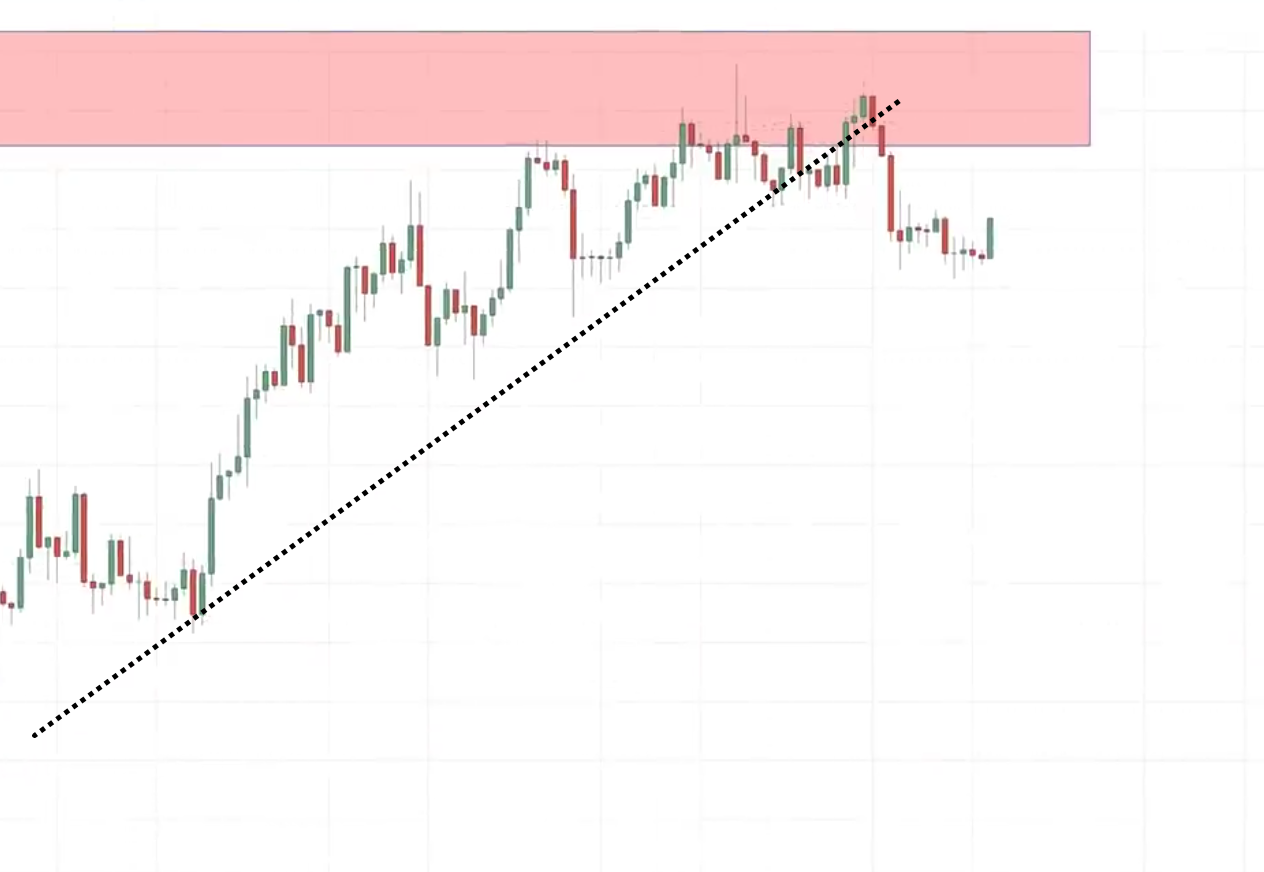
Traders who use trendline can draw a trendline and it’s broken at this point.
We have multiple factors telling us that the selling pressure is stepping in and we can look to go short.
So, if the price breaks below the lows, we will go short.
Let’s see what happens…
Where do we set our stop loss?
We go a distance above the high, we don’t have to set it very high so that we don’t get stopped out prematurely.
For our targets, you can remember we can set it just before this recent swing low over here, I don’t want to set any extreme low because the price might get there and reverse.
This is a cherry-picked chart. You can see that the price reached our target.
Trade Management
I want to talk about trade management because not all trades will move in your favor.
There are times when it will mess with your feelings.
How do you manage your trade?
I want to share with you a technique.
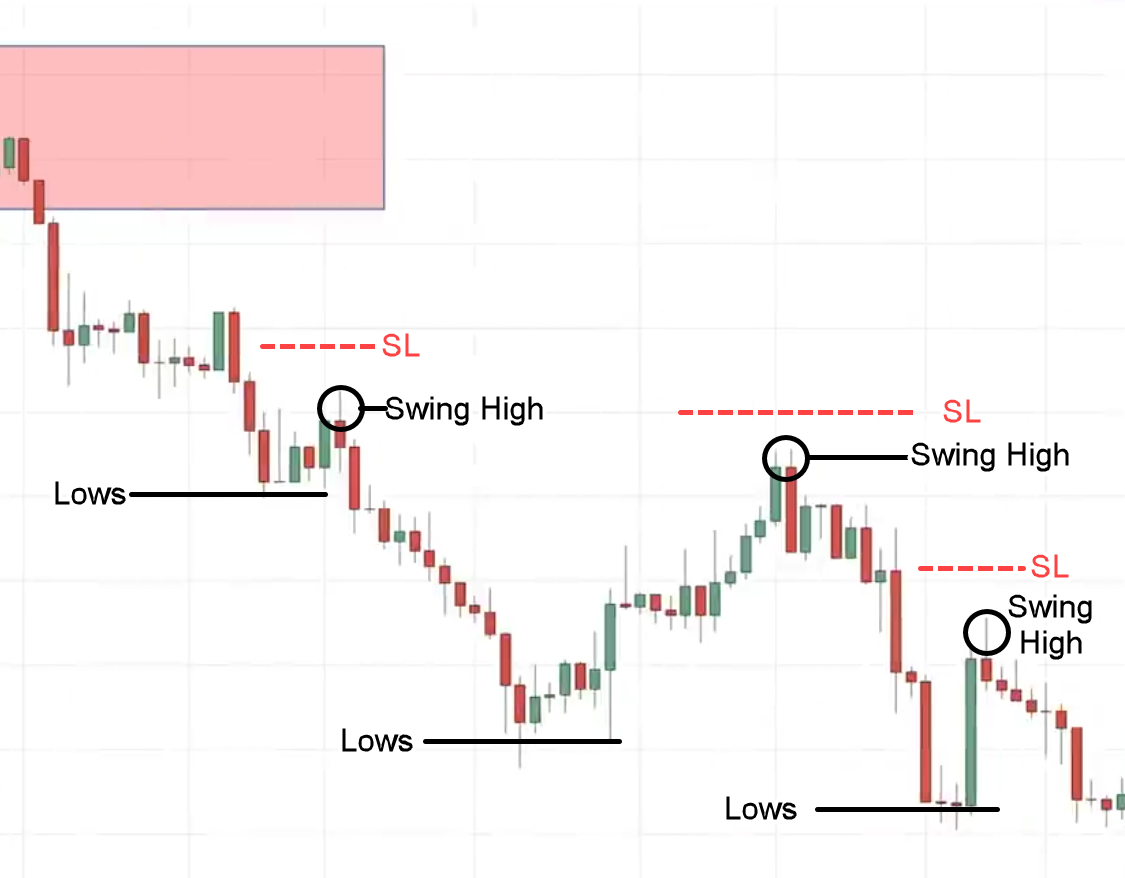
You can look to trail your stop loss based on the price structure.
Technique 1
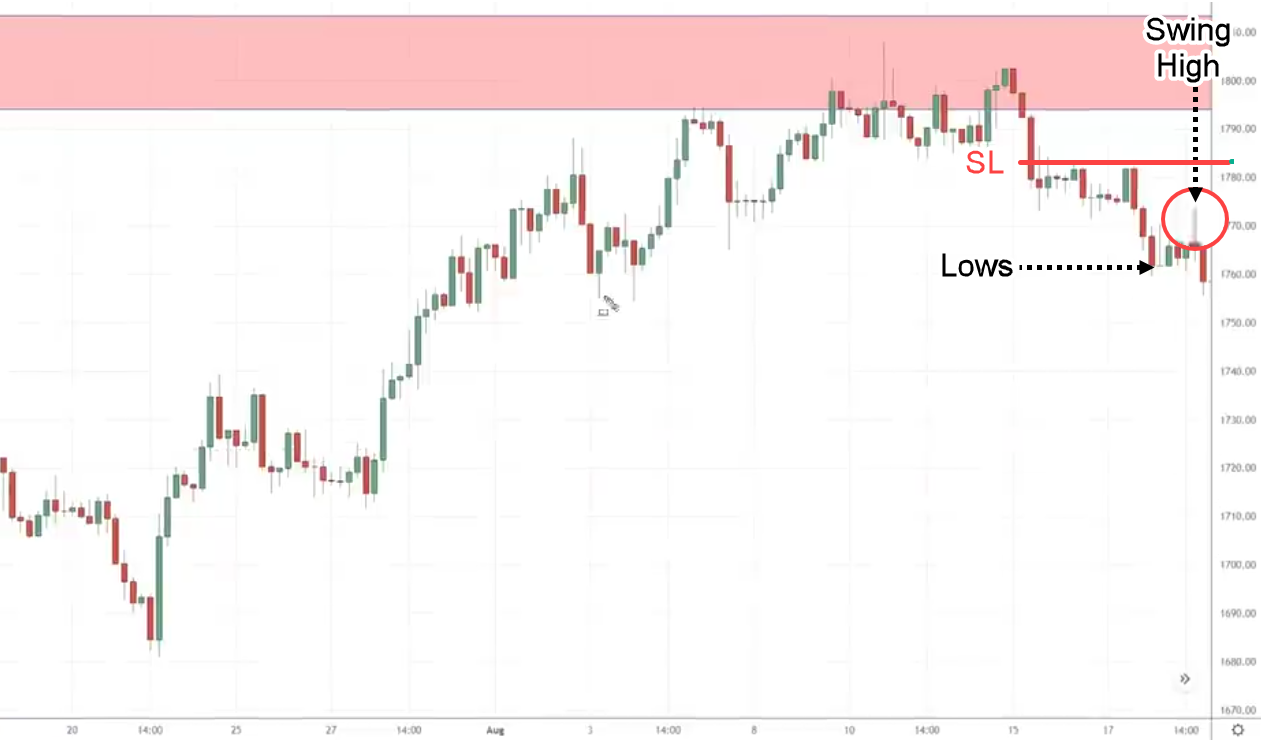
When the price breaks below these lows, you now have a new swing high that you can reference.
Your stop loss can be just a distance above the swing high.
As the price continuously makes new swing high you can always reference it to set your stop losses.
You can see over here:
Progressively we trail our stop loss based on the price structure of the market till it reaches our target.
That’s one technique that you can consider to protect your profits.
At the same time, you need some buffer to reach your target.
Technique 2
This is another variation of the break-of-structure strategy that you can consider.
This is a little bit advanced, but it offers you a low-risk entry to enter the existing trend.
This market is in a downtrend, and the price has come towards this previous support which could become resistant.
How do you find a low-risk entry to enter this trade?
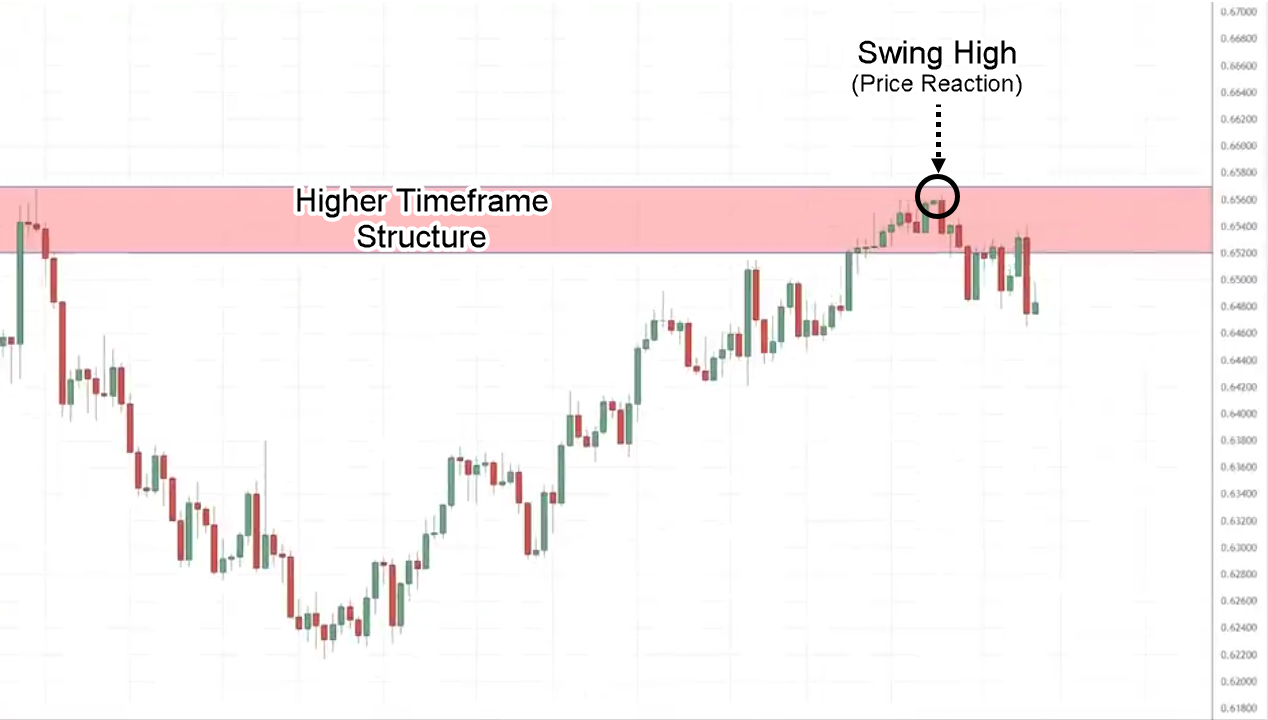
We go down to a H4 timeframe. This time instead of looking for a break of structure, we see how the price reacts at this level.
Why is this level significant?
This is the swing high that coincides with the higher timeframe structure as you’ve seen earlier.
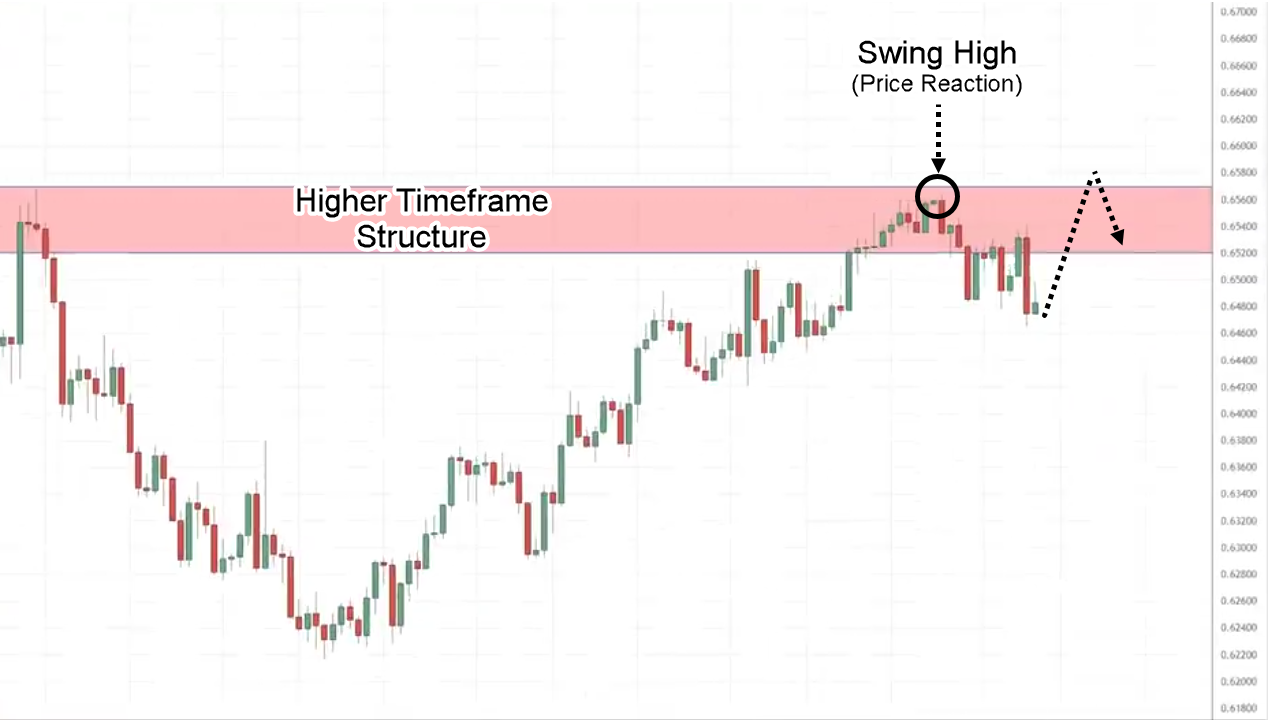
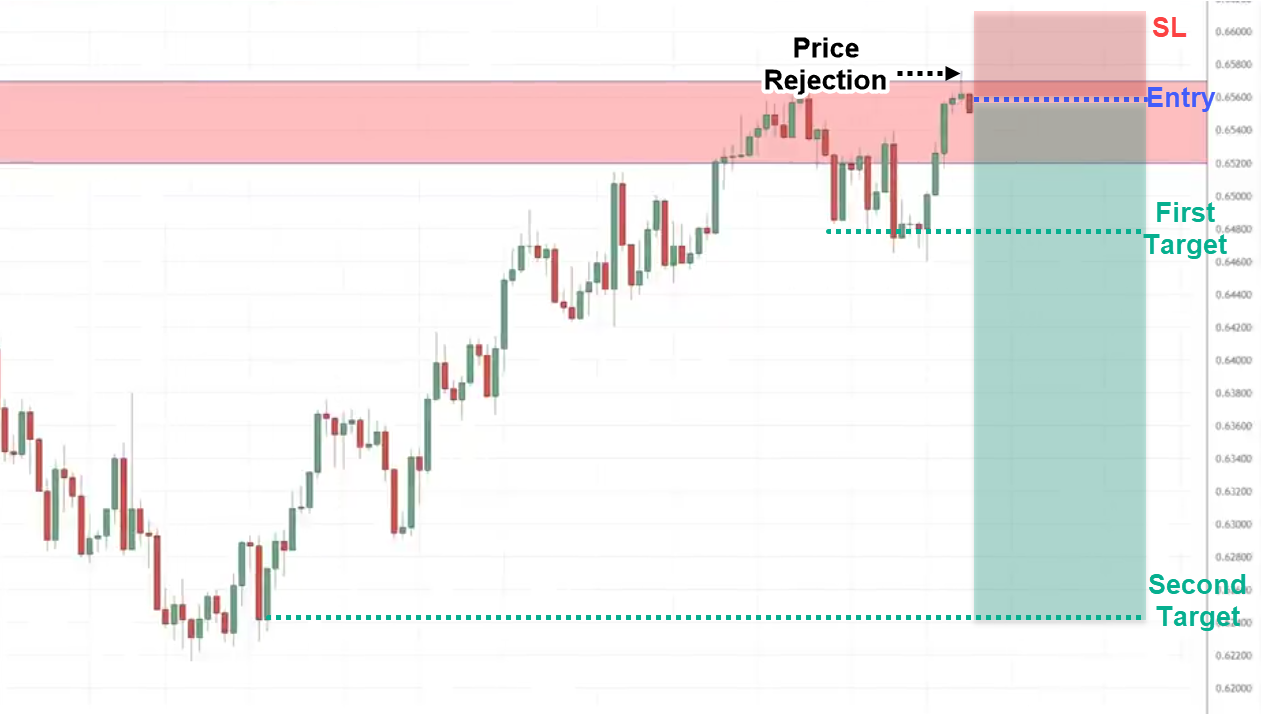
What we’re looking for is for the price to go up higher retests and then get rejected and close back below it. This is what I mean:
It could look something like a shooting star pattern for those of you who are familiar with candlestick patterns, telling us that there is price rejection at this high.
You can see we are shorting into this uptrend. But this uptrend is only an uptrend in this H4 timeframe.
Because as you’ve seen earlier on a daily timeframe, we are in a downtrend.
We are timing our entry on the H4 timeframe to get on board with the trend on the daily timeframe.
Does it make sense?
Let’s see what happens on the H4 timeframe:
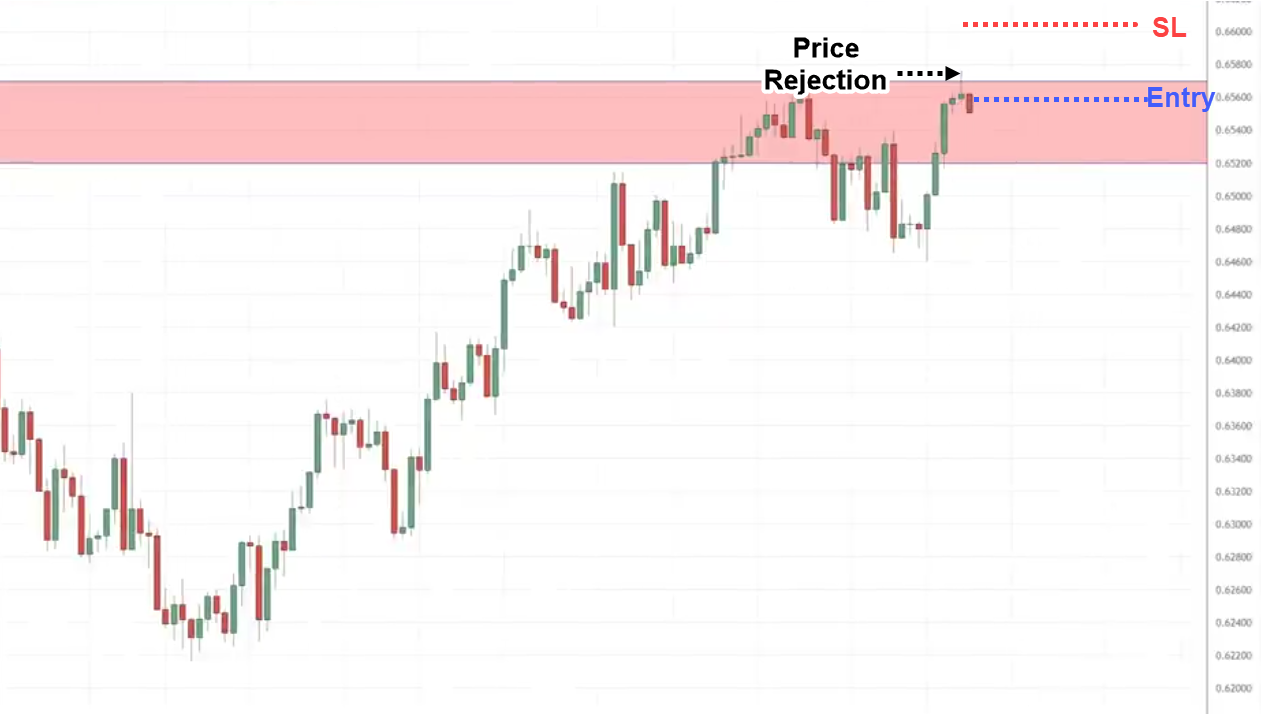
We are looking for the price to retest these highs and give us a bearish price rejection.
In this case, the market did rally up
You can see over here we have a bearish price rejection the price retests the highs over here, rejected, and closed lower on the next candle.
We can look to go short on the next candle open. Stop loss above these highs.
What about Target?
Since you’re entering your trade relatively early compared to the break of structure as I shared with you earlier.
You can have two targets.
Let’s see what happens…
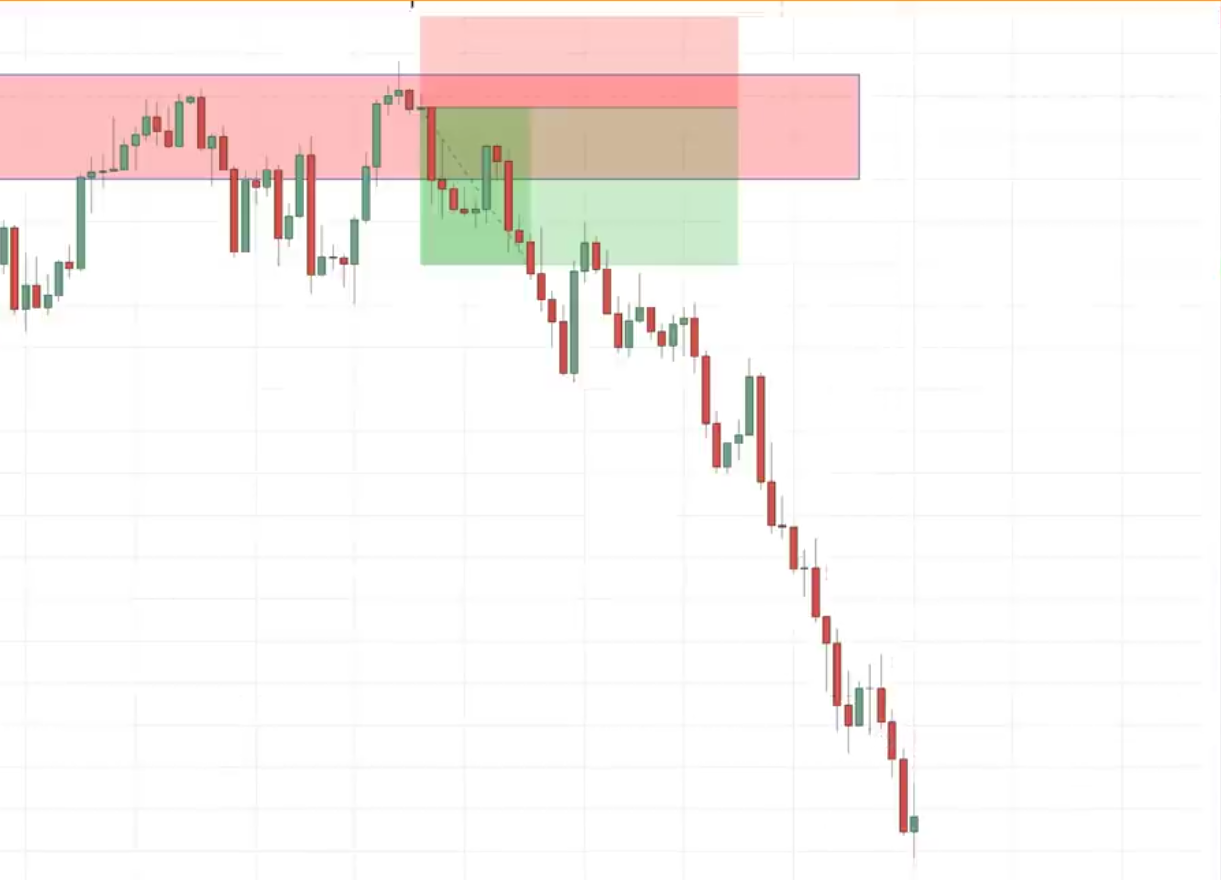
It reached our targets.
Again, this is a cherry-picked chart just for illustration. You can go and test it out on your own.
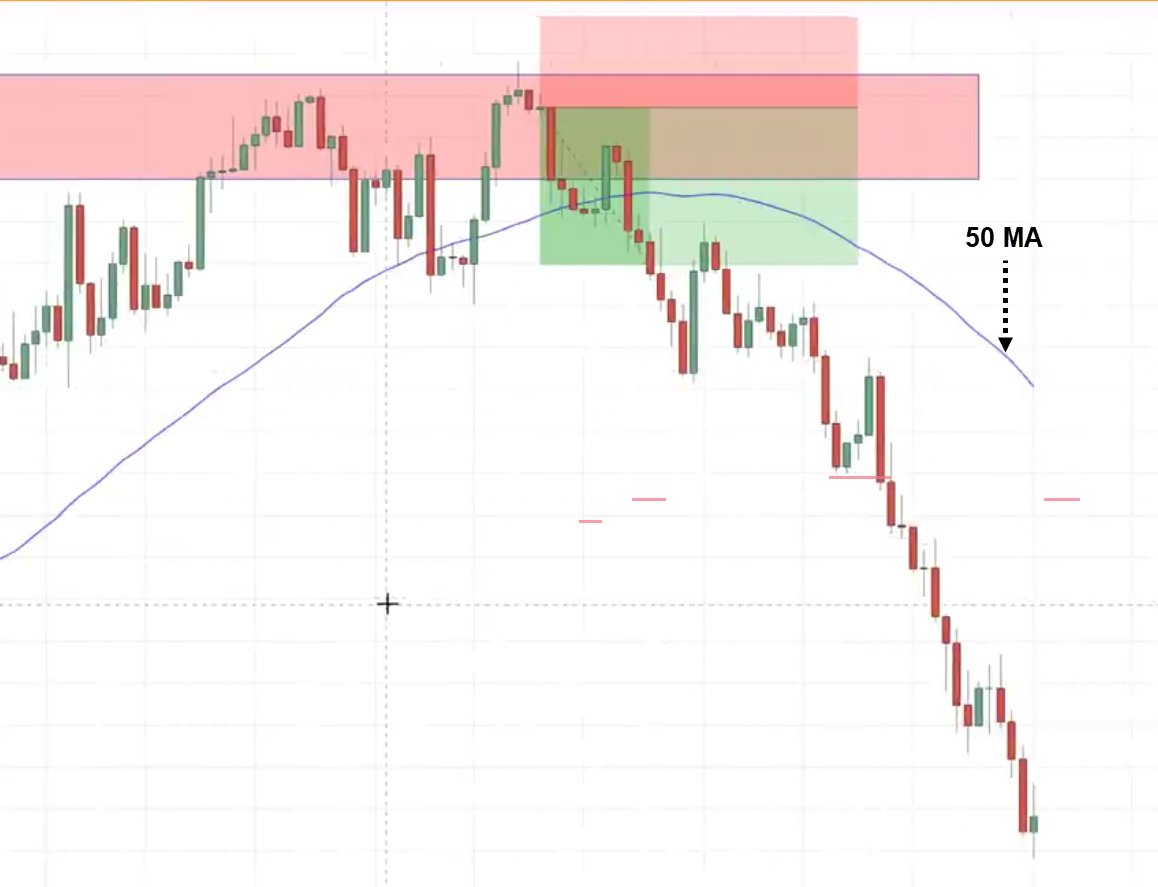
If the price closes above it, you exit the trade.
There are different ways you can use to manage your trades.
Alternatively, you can also trail using the 50-period moving average.
The False Break Trading Strategy
This strategy is for you if you’re the type of trader that…
“Rayner, I need to trade with the trend, the trend is your friend but I don’t know when to enter”
If that sounds like you then this trading strategy is for you because we’ll share with you how we can hop on board the trend.
Illustration:
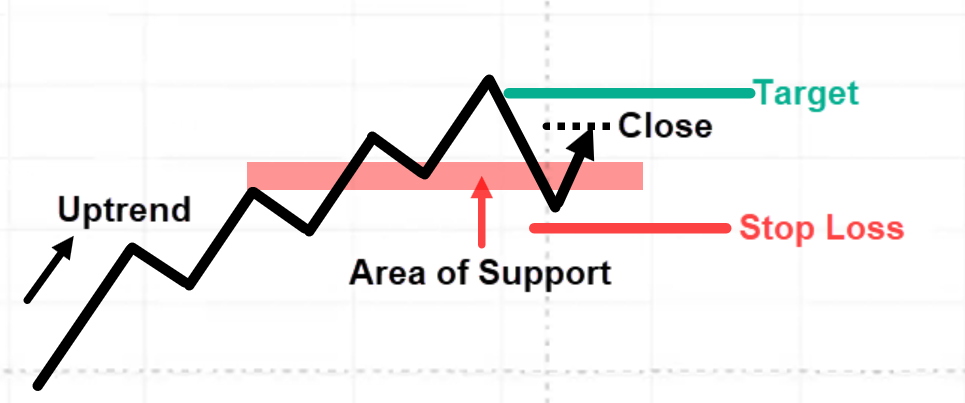
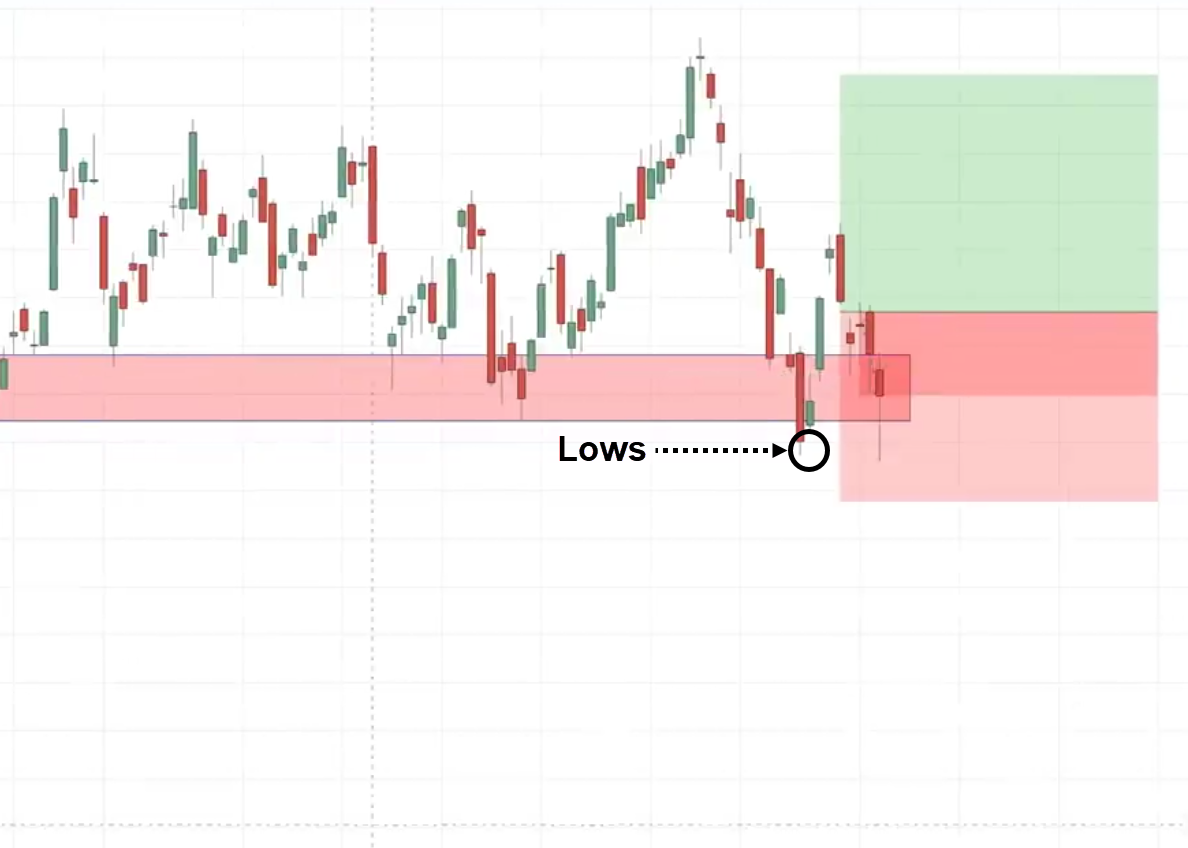
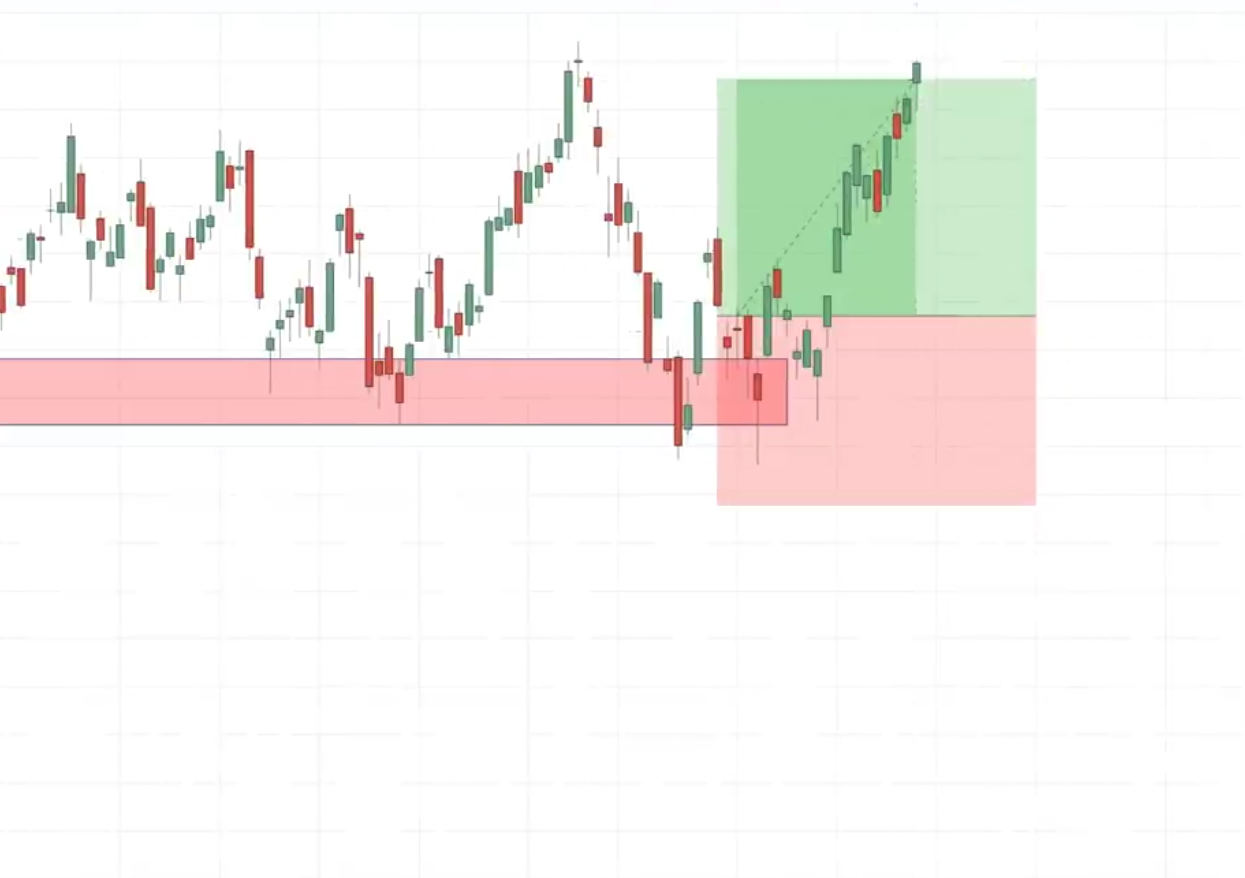
The market is in an uptrend like this, you do not know where to buy, you want to wait for the price to retest this area of support, let it break below support, and then quickly revert above it and close back above support.
When that happens, you can look to enter on the next candle open.
Stops a distance below the low.
Your target could be just before this recent swing high.
Why don’t we set above the highs?
Well, the problem is sometimes the market might come into these highs and then reverse down lower from it.
If you set it above the high, sometimes the market may not reach and then reverse back and hit your stop loss, you don’t want that. Let’s be conservative.
You’ll have your stop loss just before the recent swing high.
Example:
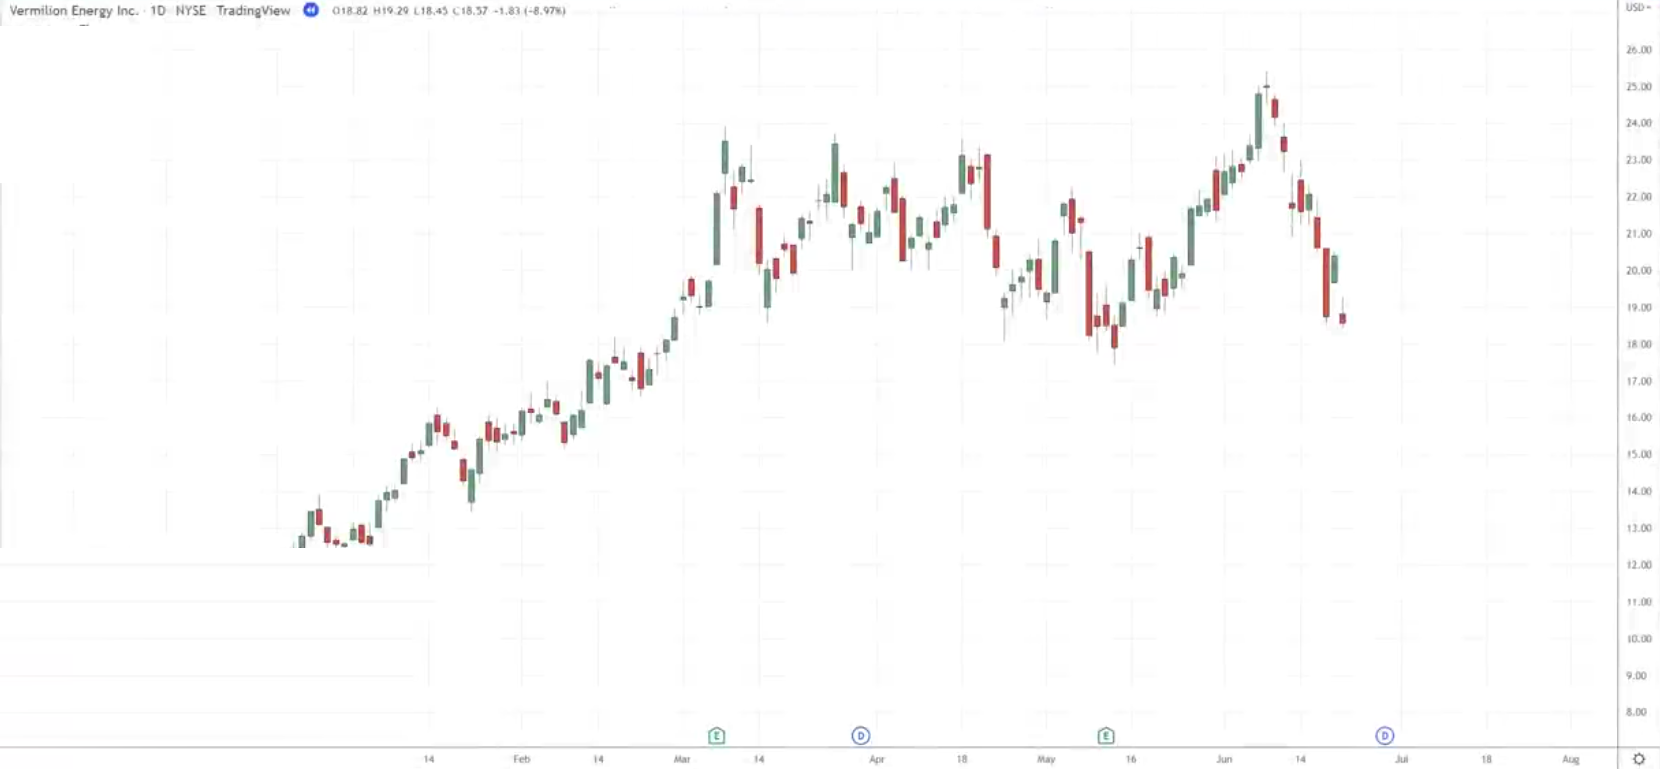
I just want to share with you that the strategies and techniques can also be applied to the stock market.
If you recall this strategy is pretty straightforward.
We are looking for the market to be in an uptrend and then retest an area of value.
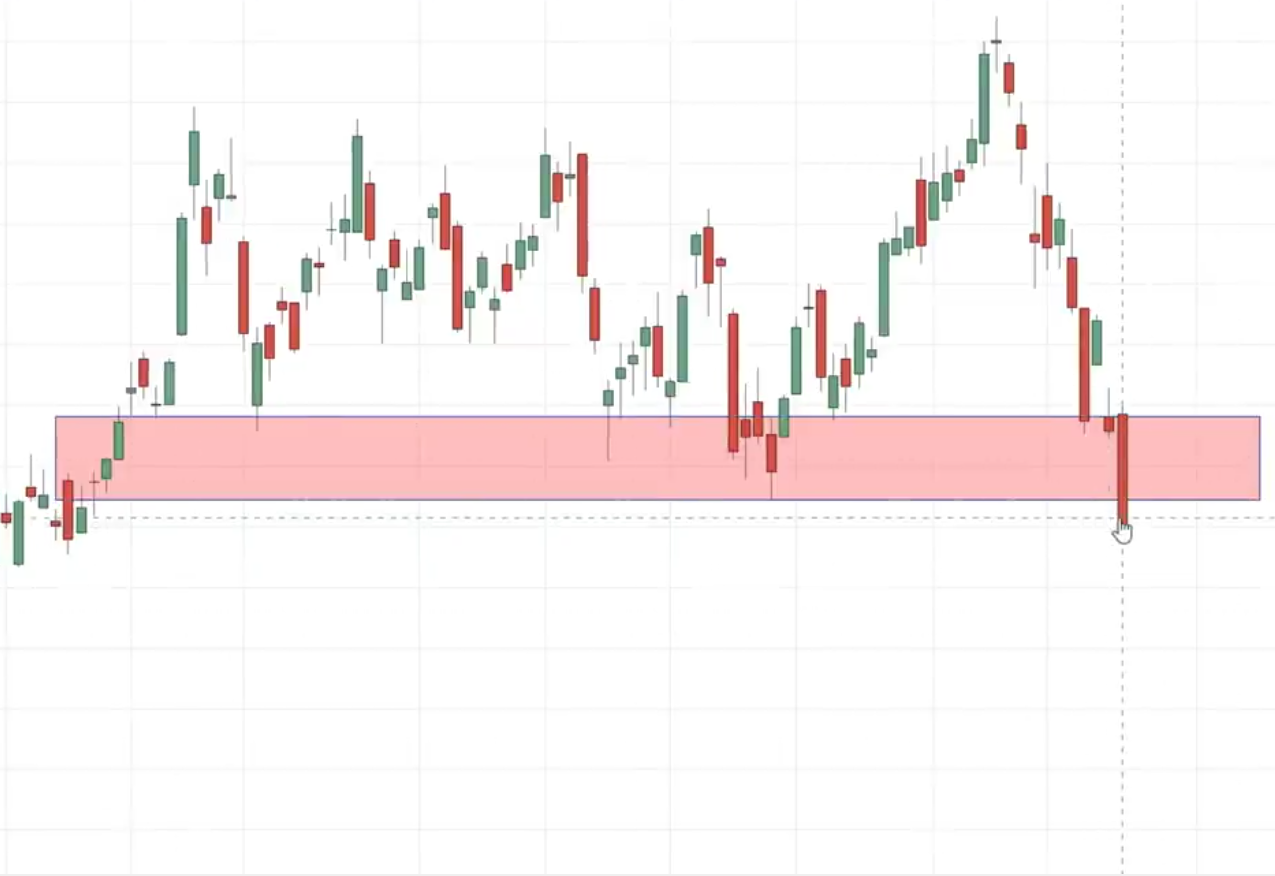
You can see the market is in an uptrend and retest this area of support.
As you can see, the market broke below support.
Many traders would think…
“Oh man, this is a breakdown time to short this market”
But I think by now you know if the market is in an uptrend and breaks below the lows, there’s a good possibility it could reverse up.
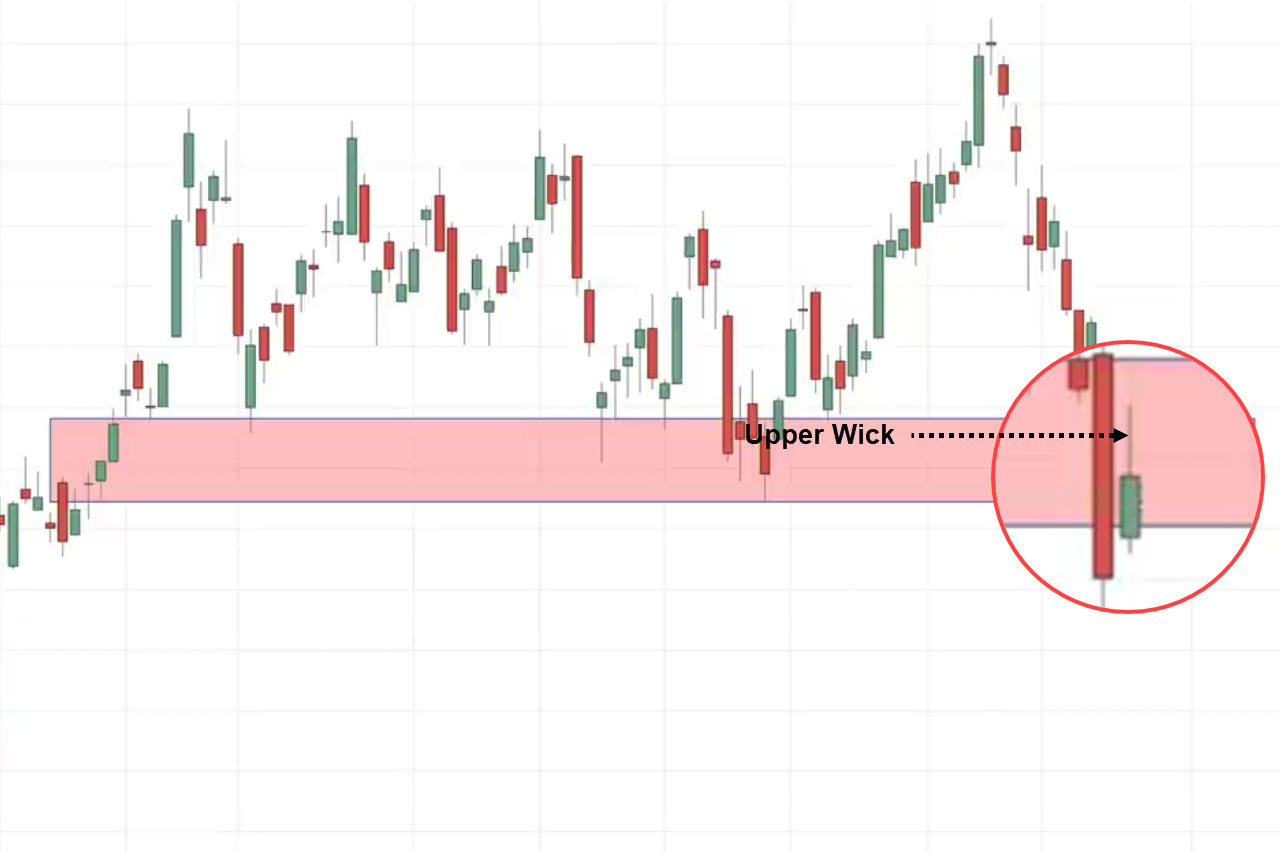
You can see that we have a green candle over here. But at this point, I wouldn’t be interested too long just yet.
Because there is a relatively long upper shadow or upper wick as you can see over here:
I rather hold my horses and see how the price behaves the next day price.
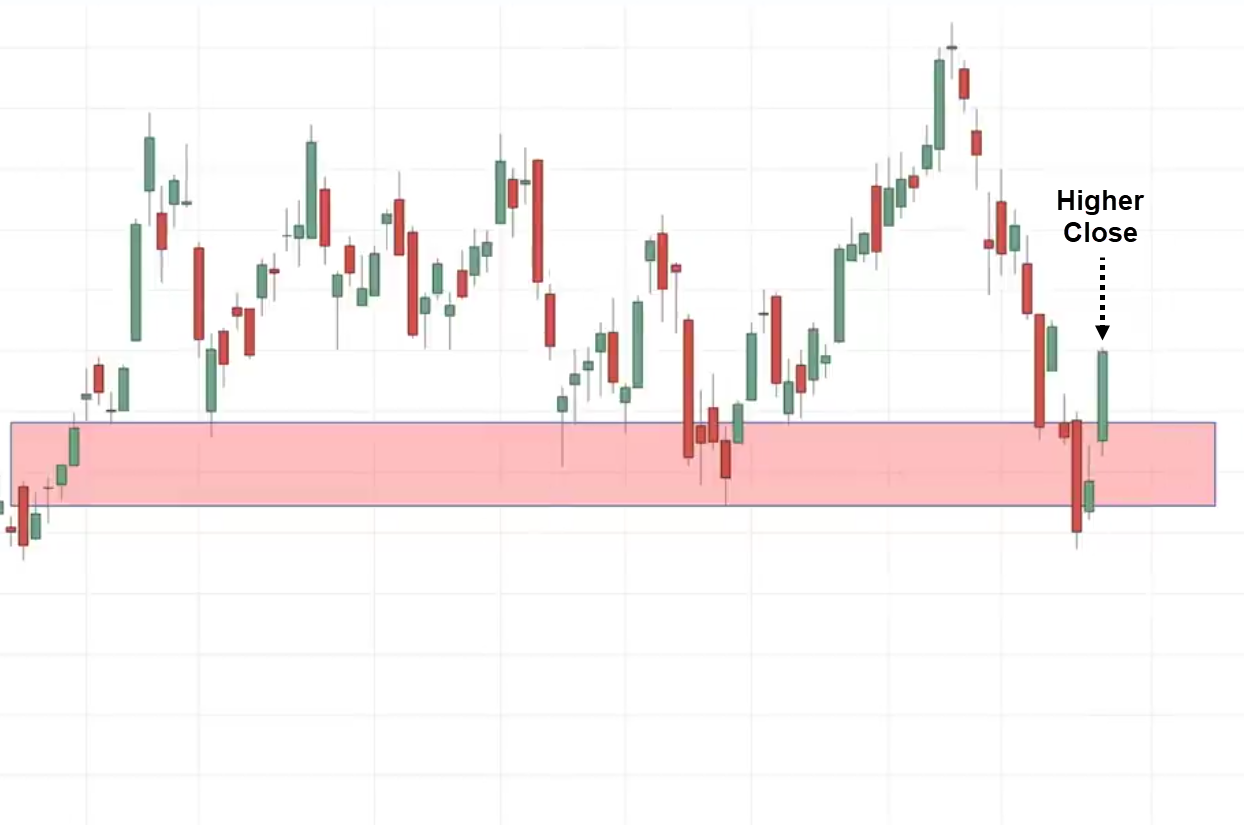
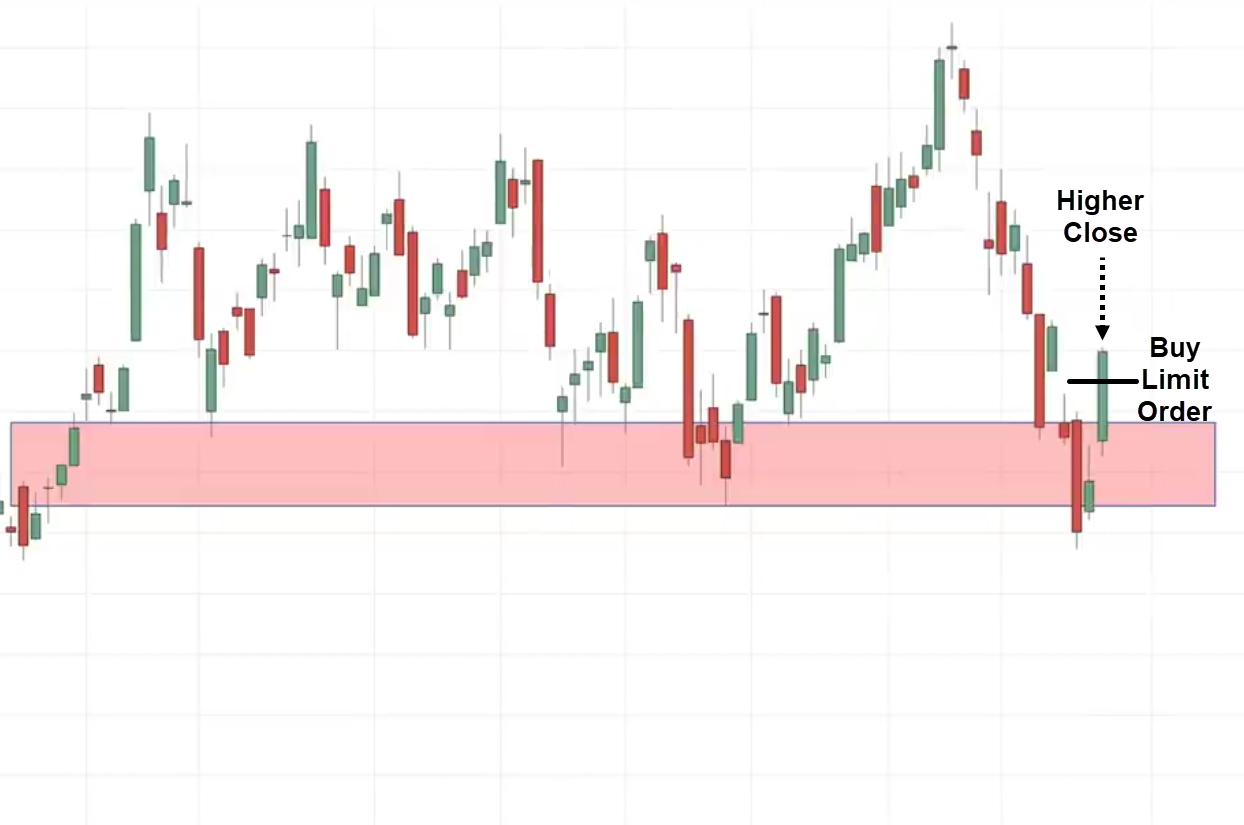
The next day, we have a higher close. So, we have a false break setup.
This false break is a little bit different from our previous false break. This one requires two candles.
But still, it is a false break because the price tried to break below this low only to close back up above support.
In this case, some of you might be thinking…
“Rayner, I don’t want to be buying these highs over here it’s a pretty high”
What you can do is one technique I can share with you.
If you are a cheapskate like me, I don’t like to buy at high prices you can place a buy limit order below the previous day’s closing price.
Here is what I mean:
Let’s say the previous day, the price closed at $20, you can set your order and $19.
This gives you a better entry price and would have improved your risk to reward on this trade.
In this case, let’s see what happened the next day…
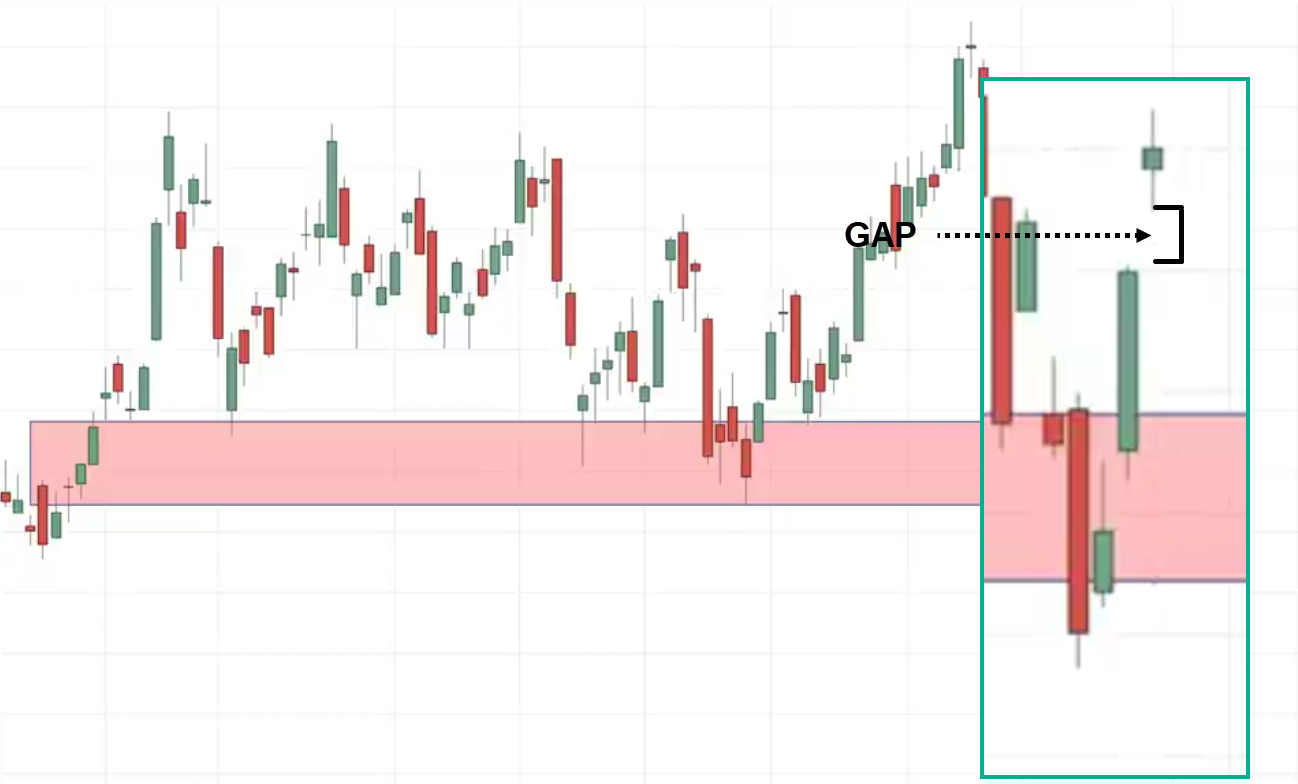
The market gapped up higher. Here’s what I mean:
If the market gapped up higher, you wouldn’t be filled on the trade.
What you can do is you can still leave your buyer limit order there until it reaches your target then you can remove your buy limit order.
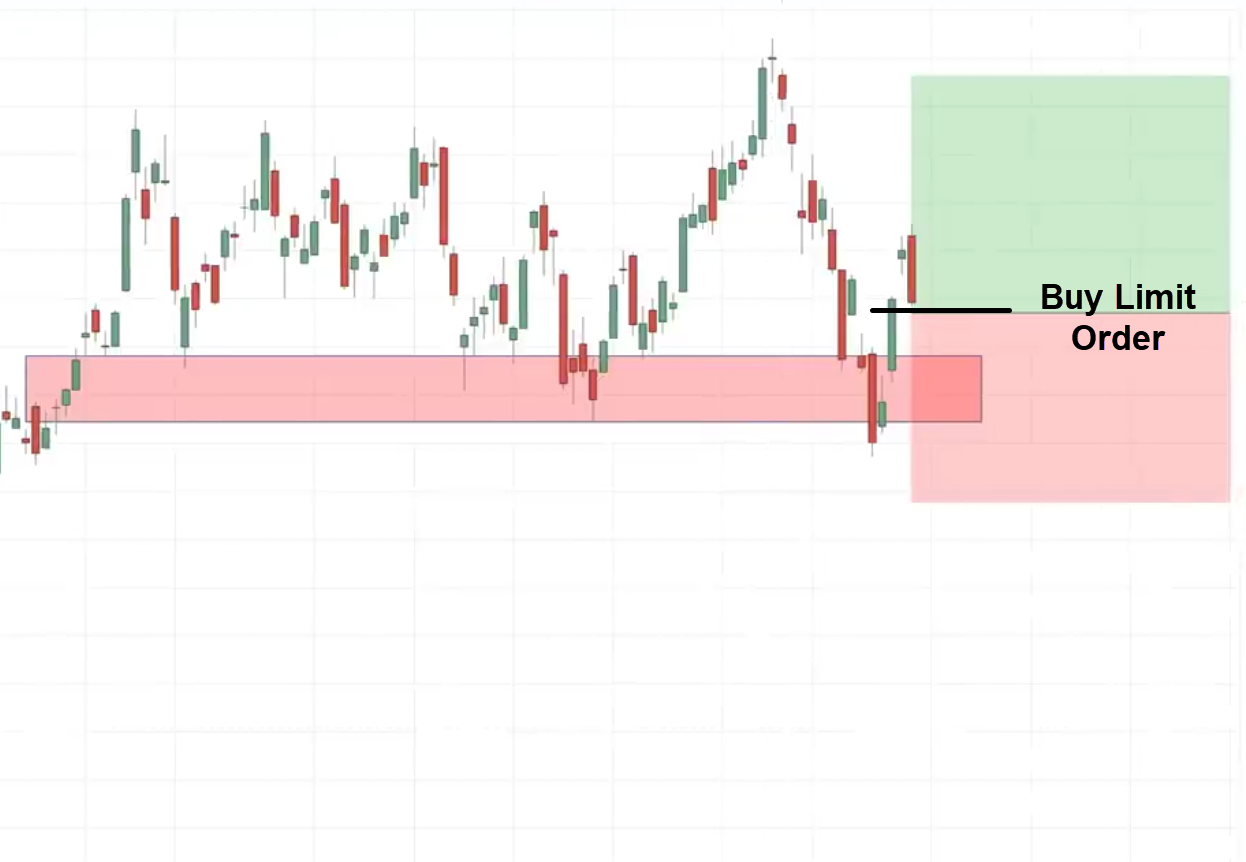
This is what it would look like.
This is a long position.
We placed a buy-limit order at $19.07. Stop loss a distance below the lows because we don’t want to get stopped prematurely.
Target a distance before the recent swing high.
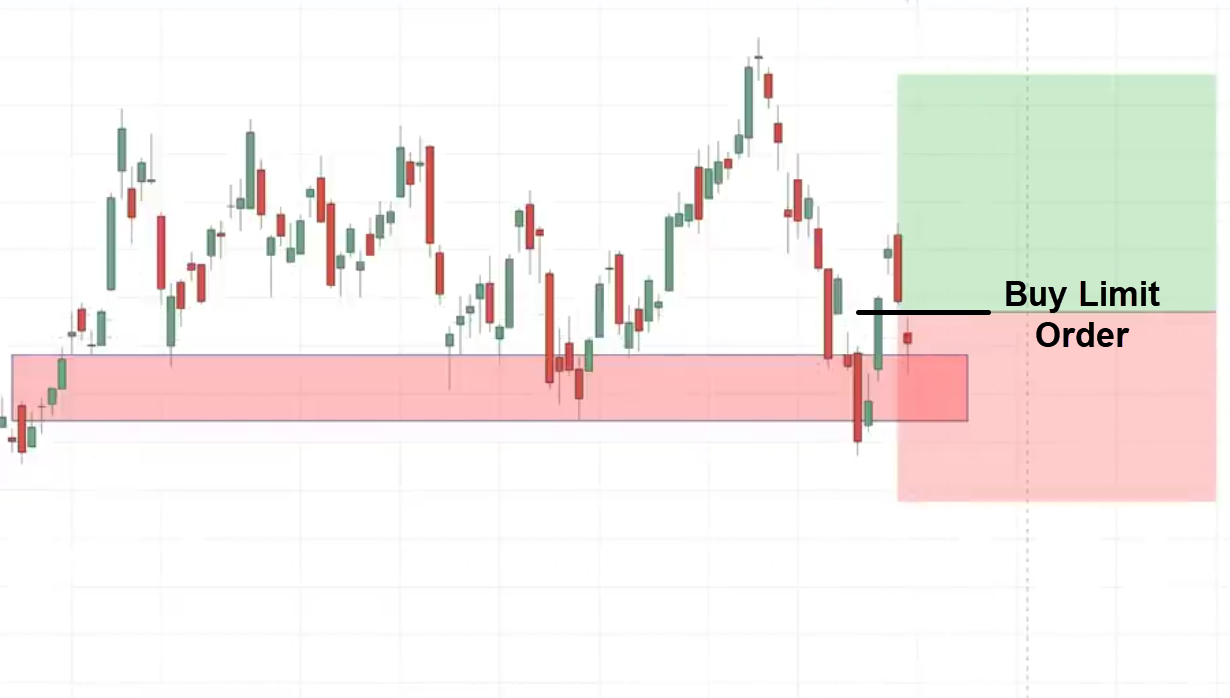
The market shows signs of reversal but we haven’t gotten filled on this trade because we have a buy limit order and right now the market seems to be against us.
But remember we are trading in the direction of the trend.
If the market were to hit our stop loss, it has to first break below this area of support which is like a barrier to hold up this higher price so the market has to work hard to reach our stop loss.
Let’s see what happens next…
We have gotten filled on the buy limit order and now the market seems to be against us but remember, we have a stoploss in place.
Let the market do what it needs to do remember we are trading in the direction of the trend.
If the market were to hit our stop loss, it has to first break below this area of support which is like a barrier to hold up this higher price and so the market has to work hard to reach our stop loss.
Let’s see what happens…
In this case, the market reverse-down took out these lows over here:
Now you understand why I always set my stop loss you know distance below the lows. Because if I set it at the lows I would have gotten stopped out on this candle over here.
But since my stop loss is here, I’m still safe for now in this trade whether it’s a winner or loser, right?
In this case, the market then slowly consolidates and then finally starts to show signs of reversal reaching our eventual target.
This is a very useful technique that I use.
The First Pullback Strategy
This is for traders who always buy the breakout, but the problem is you see the candle, the breakout is huge, you buy, and the market reverses and you get stopped out.
Why is that happening?
Well probably is because you’re chasing breakouts.
This strategy is to help you avoid chasing breakouts and avoid unnecessary losses. This is what I call the first pullback trading strategy.
It looks like this…
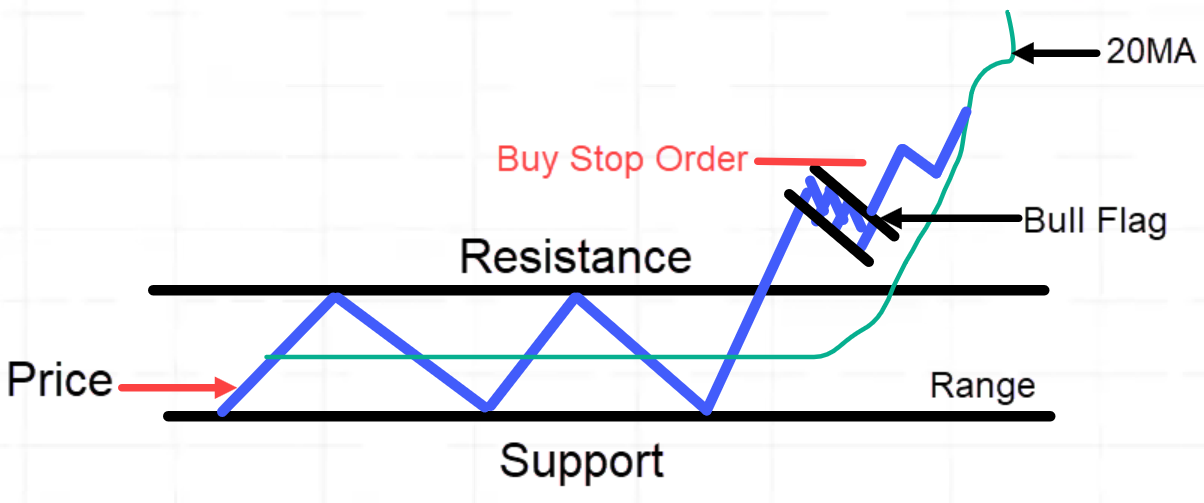
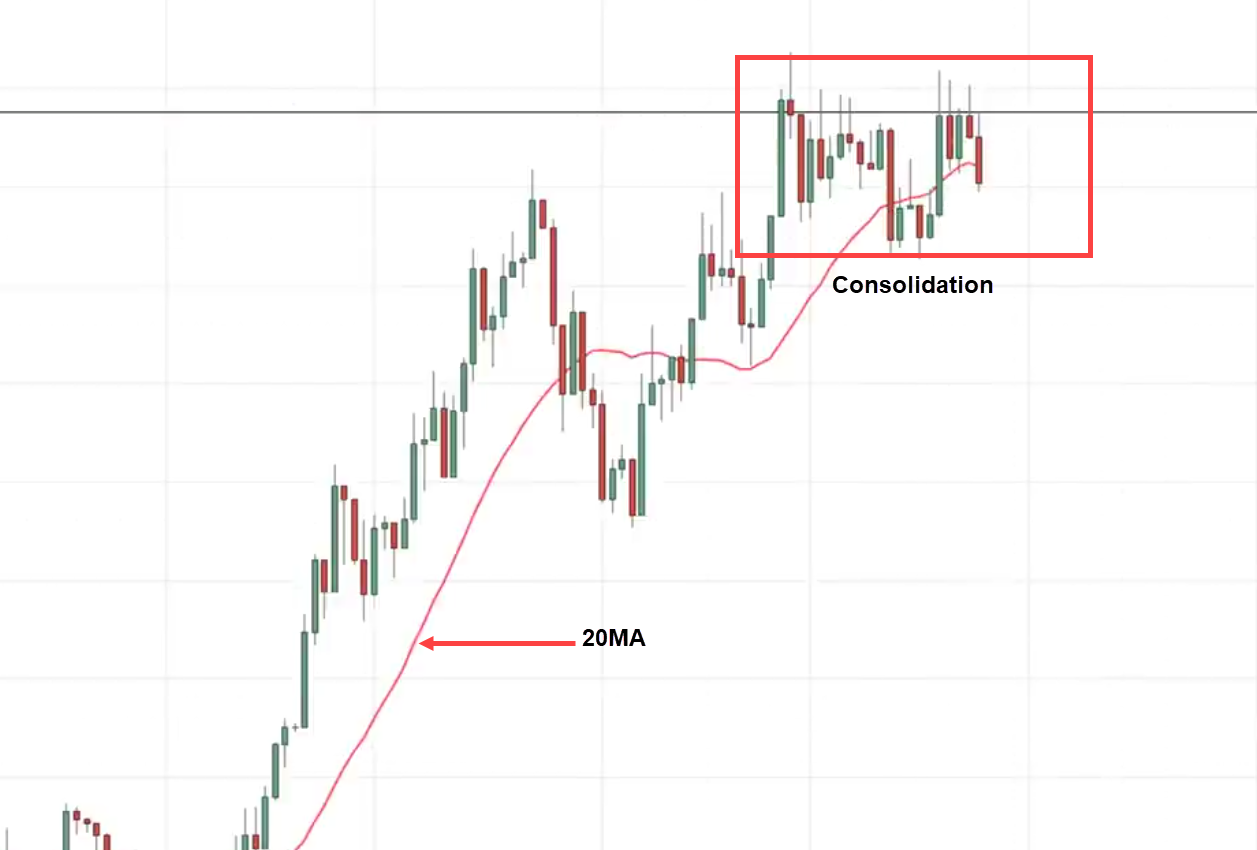
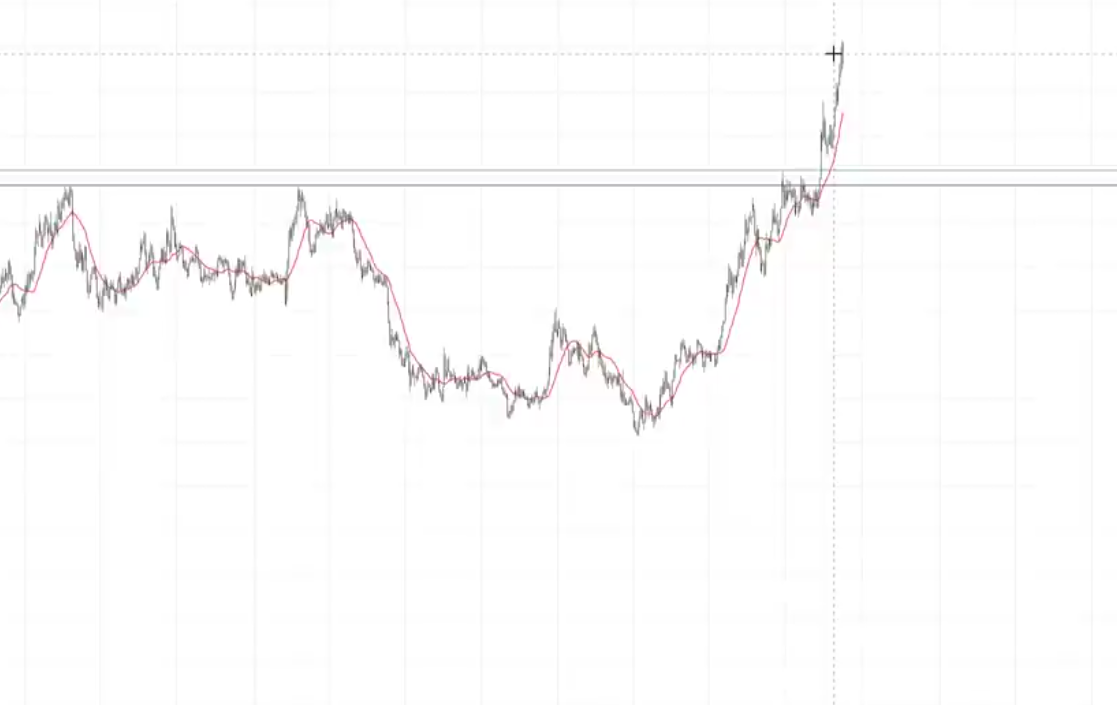
The market is in a range, it breaks out and then pullback forming something like a bull flag pattern.
If you overly the 20-period moving average, you’ll see the 20MA support the price.
You’re waiting for the low of this build-up to touch the 20MA.
Once it has done it then the price starts going up higher.
You can place a buy-stop order above these highs and if it breaks up, you go long and then you trail your stop loss to ride the trend higher.
Example
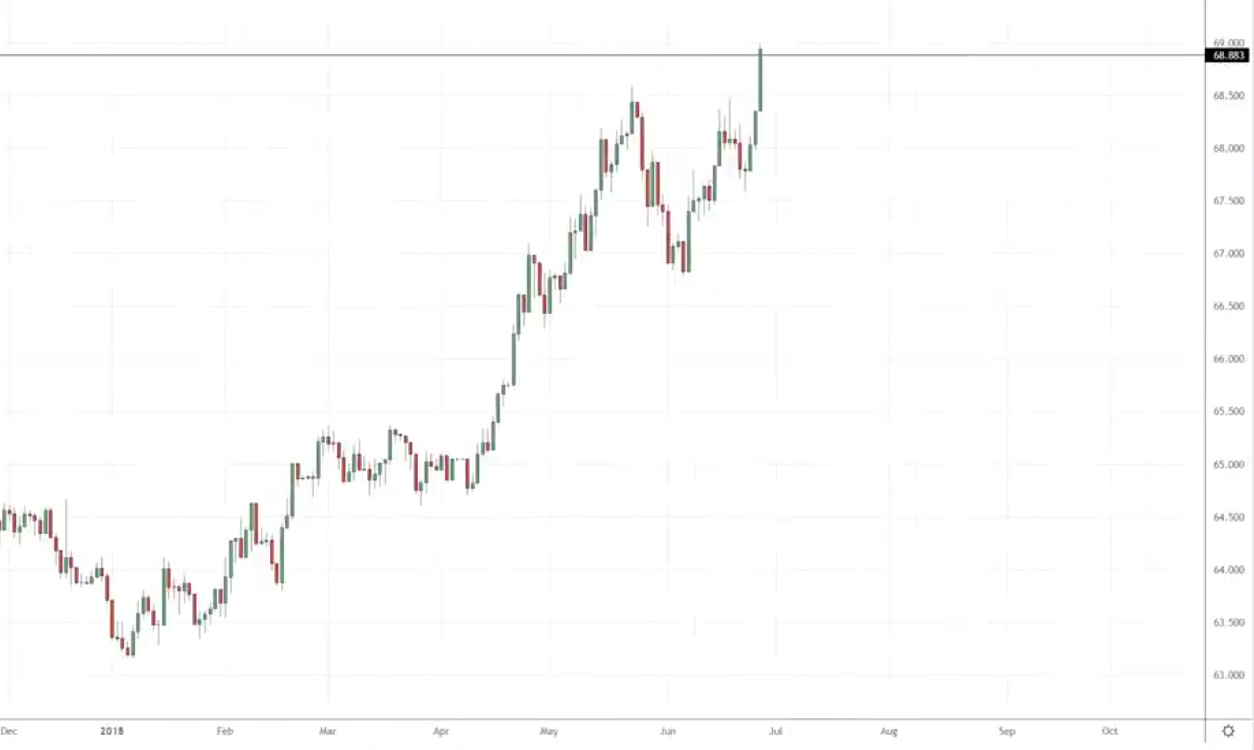
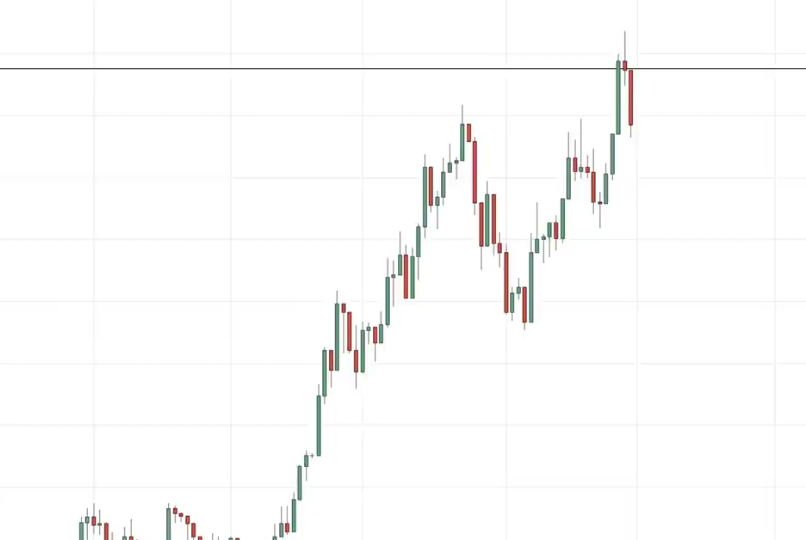
You can see that we had a breakout over here on this candle recently.
Many traders would say…
“Rayner, this is bullish is time to buy, it’s time to go long”
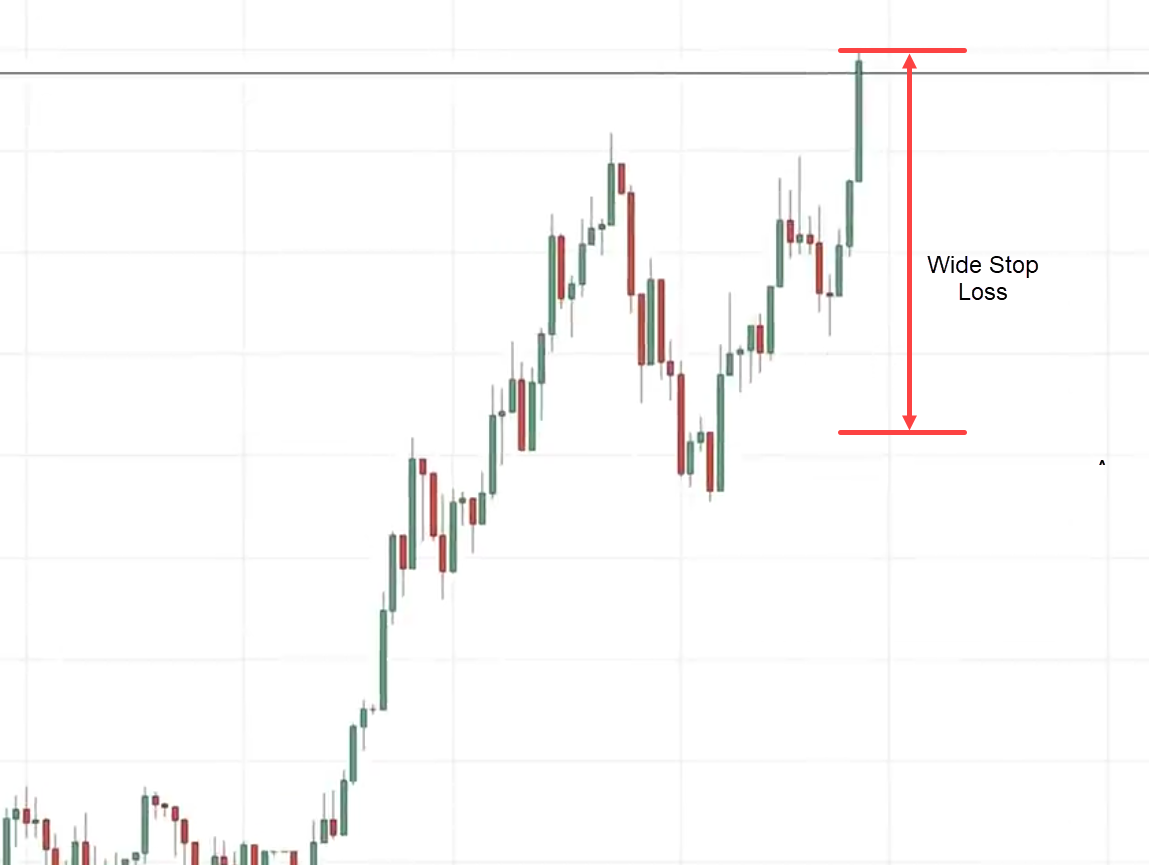
But the problem is where you can set your stop loss. You can reference the lows and this could be a very wide stop loss, this is what I mean:
Is there a better way to go about it?
Yes…
That’s what I call the first pullback strategy which I’ll share with you.
In this case, you can see the market starts to reverse so at this point, traders who buy the pullback are probably sweating out on me.
They have gotten stopped out, especially those who have a tighter stop loss.
You can see it starts to consolidate over here…
Remember at this point, we also use the 20-period moving average to overlay it.
You see the price has already retested 20MA, this tells you that the market has digested the recent breakout move and it has stored enough energy to stage the next breakout higher.
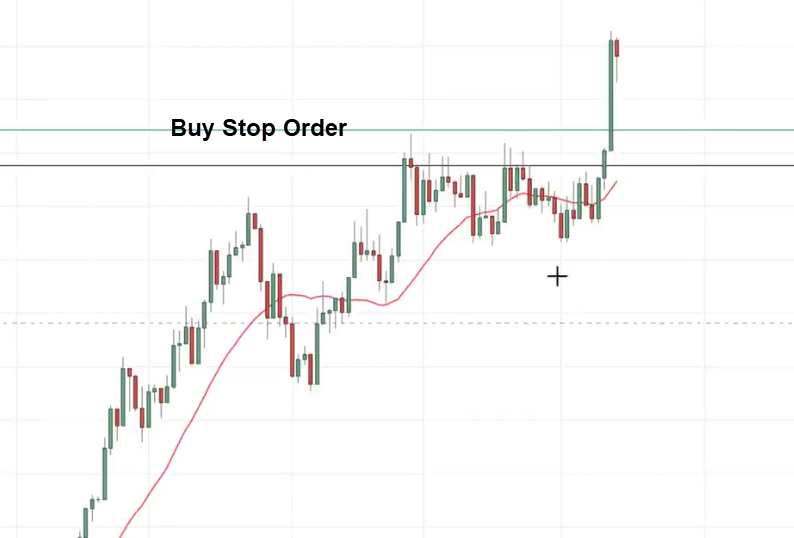
What you can do is place a buy-stop order above these highs for traders who prefer the candle to break and close above the highs, that is still fine.
The market did eventually break about these highs over here and continues higher.
I don’t have a fixed target over here because you can see the price is trading at a no man’s land.
There is no price structure and resistance nearby, you can trail a stop loss to ride the trend higher.
There’s a 20-period moving average that you can use to trail your stop loss.
If the price breaks below the 20MA you exit the trade.
Conclusion
Every strategy that I have shared with you today has helped me avoided big losses and captured great rewards throughout the years.
Giving me an edge in the market.
So…
As a recap, here’s what you’ve learned today:
- Waiting for a break of structure is the perfect key to timing trend reversals by waiting for a price to make two new lower lows (vice-versa on a downtrend)
- Mastering trade management allows you to mastermind all of your trading ideas giving you more flexibility such as having multiple take profit levels and trailing stop loss methods
- If you’re looking for the most versatile entry trigger, then the false break setup is for you by waiting for the price to reject from an area of value
- Waiting for a first pullback after the breakout gives you extra confirmation as it also helps you take trades with tighter stop loss
There you go!
Now, here’s what I want to know…
What strategies can you add to the list?
Let me know in the comments below!


