#2: The Ultimate Trading Indicators Webinar
Lesson 2
Hey hey, what’s up my friend!
Welcome to the Ultimate Trading Indicators Webinar.
This is a webinar that will share with you 4 powerful trading indicators that you can use to profit in the financial markets.
Whether you are trading Forex, Stocks, Futures, etc.
The concepts can be applied all the same.
Are you ready?
Then let’s begin!
What is the Moving Average indicator
The first Indicator that I want to share with you is a Moving Average indicator.
Moving Average is pretty much an indicator that summarizes past prices.
Sometimes when the price action in the market is choppy...
What the Moving Average does is that it smooths out past prices.
Let me share with you how the numbers of the indicator are derived.
For example, a 20-Moving Average.
What it does is that it adds up the value of the last 20 candles.
Let’s say the value of the last 20 candles is $200…
You divide it by 20 (the period of the Moving Average) and you’ll have a value of $10.
The value of $10 will be plotted in your chart as one dot.
Now let’s say the 21st candle is formed…
The Moving Average would recalculate and look back the average price of the last 20 candles.
So, let’s say the total of the last 20 candles this time is $240.
Divide it by 20, and you get $12.
Back on your chart, there should be another dot plotted higher than the last dot, which is $10.
That’s how the Moving Average is calculated.
There are different ways to calculate it such as:
- Simple
- Exponential
- Weighted
It doesn’t matter…
But this is the concept behind the Moving Average even if there are a lot of variations to it.
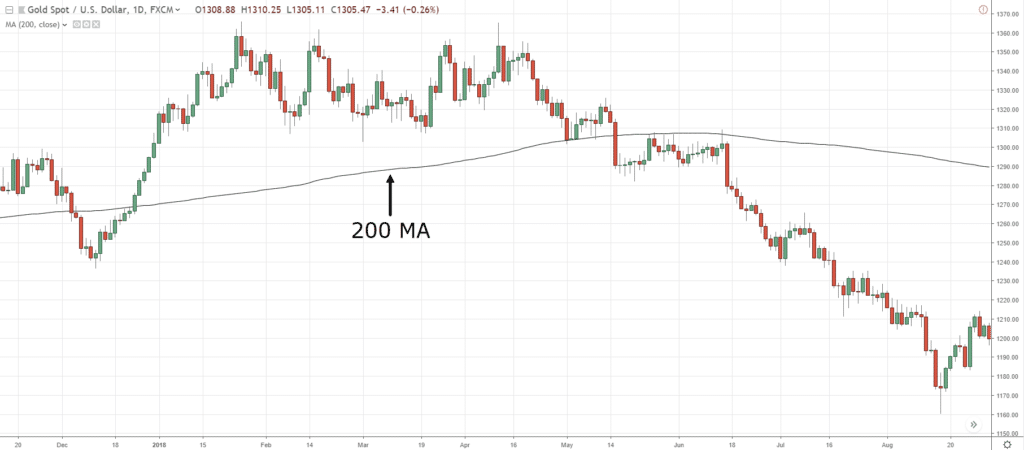
Moving on, you can see that the black line is the 200-period Moving Average:
How not to trade the Moving Average indicator
It’s important to know how to trade an indicator, and how not to trade it, or rather when not to trade it.
Traders would often say…
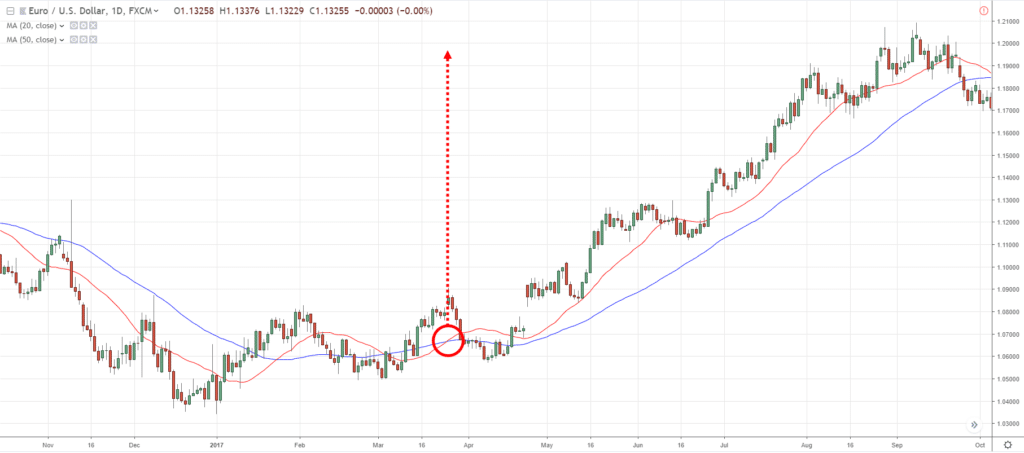
"Hey! The 20-period Moving Average crossed above the 50!"
"It’s a buy signal!
"Go long!"
"Look how profitable a Moving Average cross over is!"
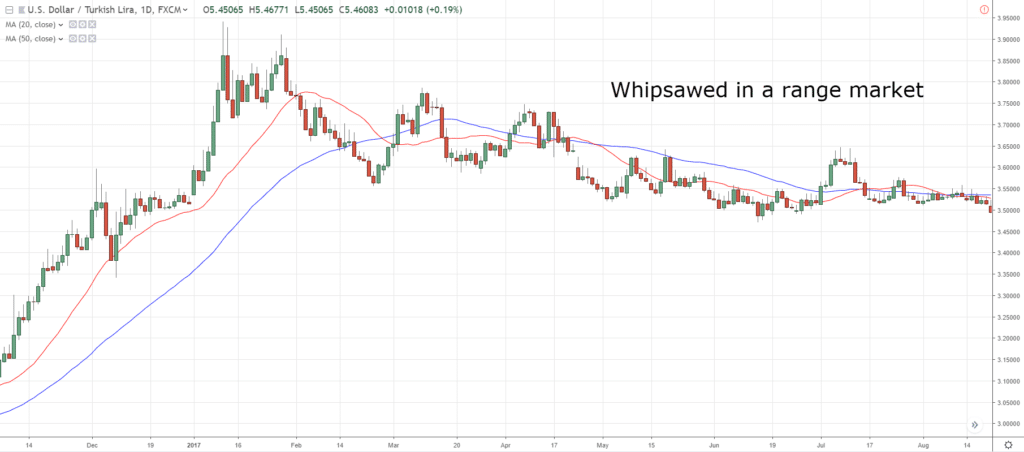
What they don’t show you is that when the market ranges, you’re going to get whipsawed:
And as you know, the market tends to be in a range more than it trends.
However, if you are trading a Moving Average cross over strategy as a discretionary trader…
I don’t suggest it.
Because you’ll tend to lose money in the long run.
However, if you are a systematic trader applying a trend-following approach, then this can work.
But for most of you reading this post, you’re probably a discretionary trader, and this is an approach I won’t suggest.
Moving on...
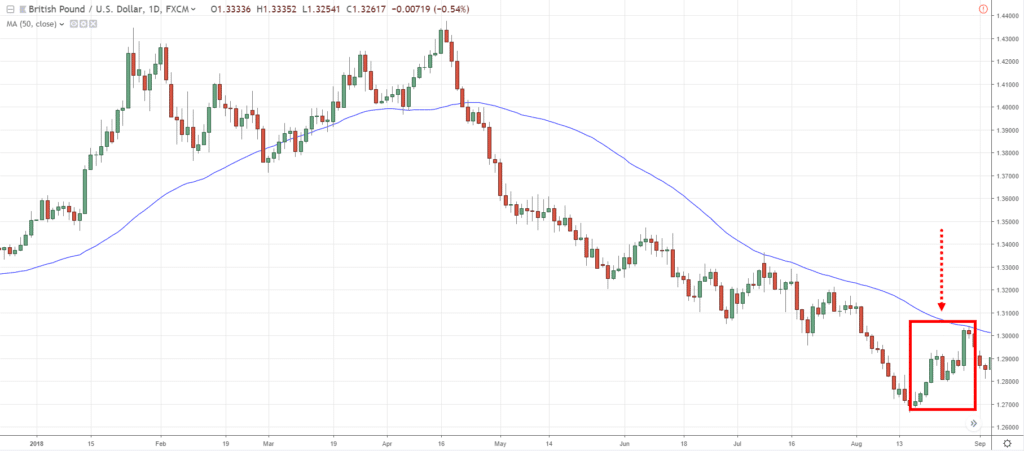
How to trade the Moving Average as a Trend Filter
Often, I get traders asking me…
“Hey Rayner, should I be buying, or selling?”
What you can do is to use the Moving Average as a trend filter!
It tells you whether you should be buying or selling.
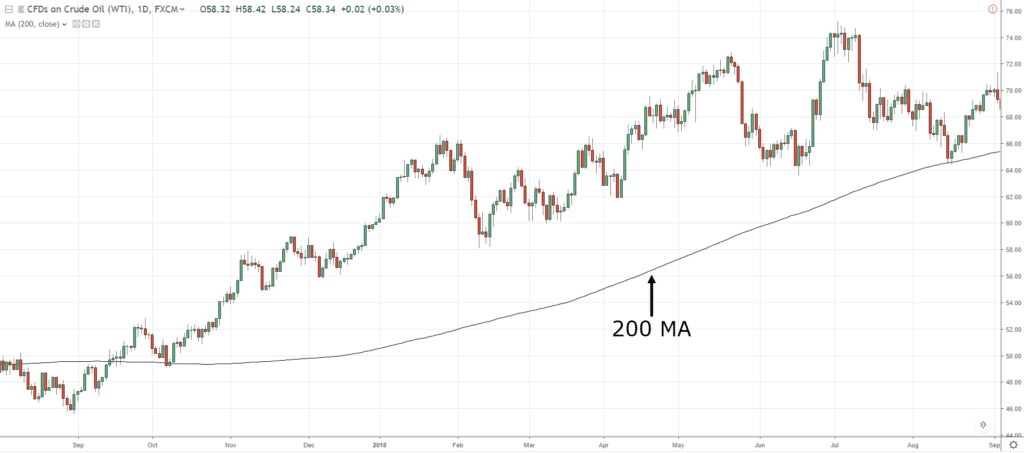
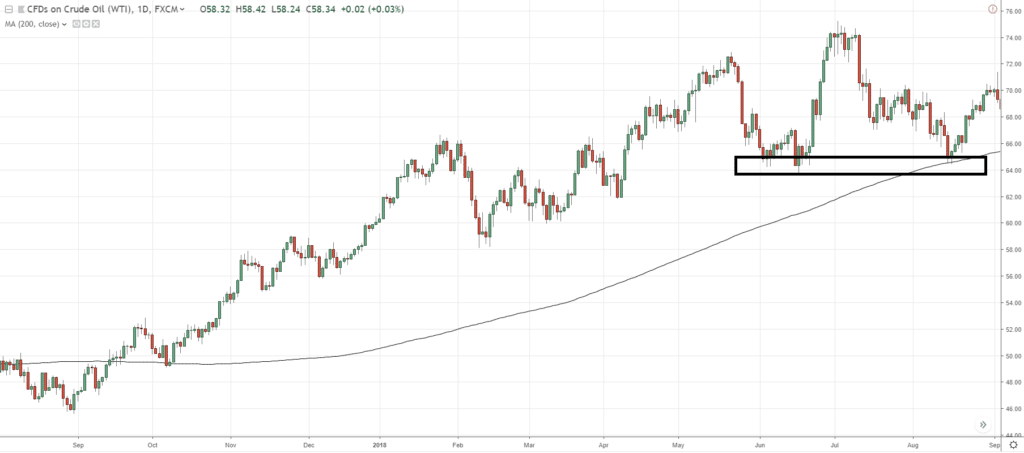
You can see that the black line over here is the 200-day Moving Average:
It doesn’t matter whether you are using exponential, simple, weighted – It doesn’t matter, the concept is what matters.
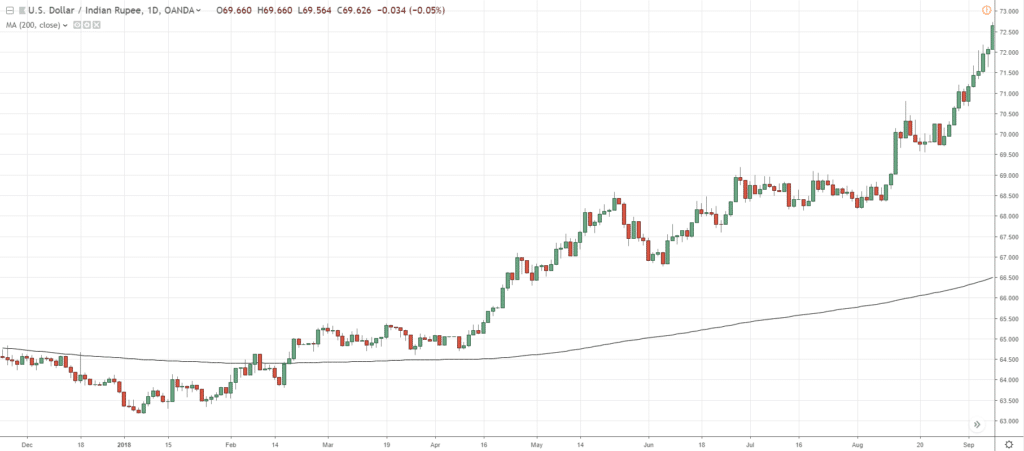
Right now, the price is above the 200-period Moving Average!
One general guideline is that…
When the price is above the 200-period Moving Average, stay in a long bias.
This means that the market is in a long-term uptrend and you want to be buying in this market condition.
Over here, I can identify a possible area of support where you can look to buy in this market condition:
You can see over here that the price is above the 200 MA:
What should you do?
You should only be looking for buying opportunities in this market condition.
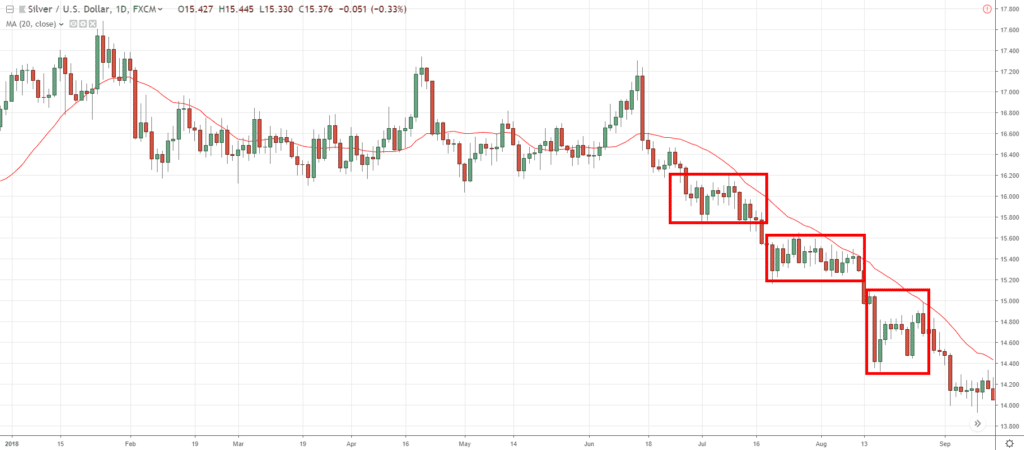
Another way you can use a Moving Average is to trail your stop loss...
How to use the Moving Average as a trailing stop loss
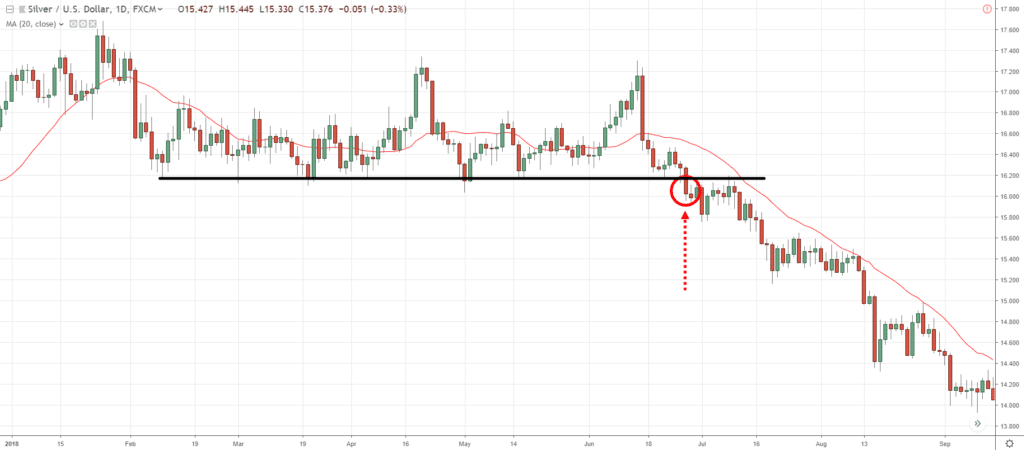
For example, the price has broken and closed below support and you short the break down here:
The price is in your favor and now you want to ride the trend.
How do you do it?
What you do is to use a 20-period Moving Average to ride the short-term trend lower!
There is nothing magical about the 20-period Moving Average.
Often, I get questions from traders, “Hey Rayner, which is the best Moving Average, should I use the 20? 50? 100? 200?”
Look!
There is no best.
It really depends on your goal or what you are trying to achieve!
I’ve shared with you the 20-period Moving Average for traders who want to capture a short-term trend.
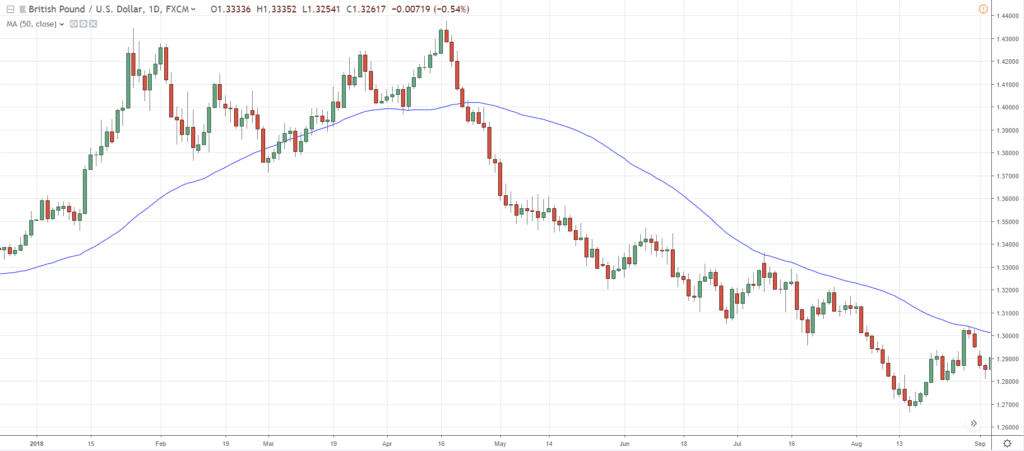
If you want something that gives your trade room to breathe, you can even use a 50-period Moving Average:
What should strike out to you is that using a 50-period Moving Average gives you more room for your trade to breathe!
You can see that the trade can withstand a deeper pullback:
Whereas the 20-period Moving Average cannot withstand deeper pullbacks:
So, it all boils down to your goal whether you want to capture short, medium, or long-term trends!
And you can use the appropriate Moving Averages to meet your goals.
Now…
Another way you can use the Moving Average is to look for Areas of value on your chart.
How to use a Moving Average to look for an area of value
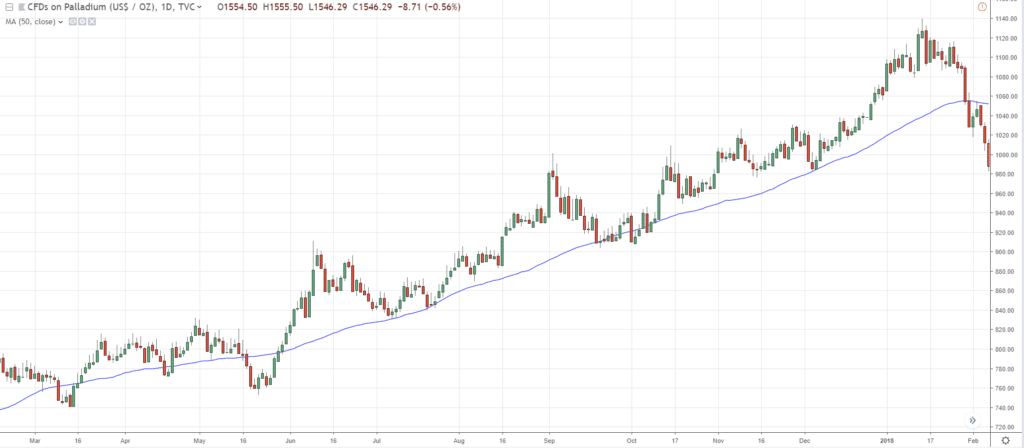
For example, the market is in an uptrend:
And you are wondering, “where is the good time to buy?”
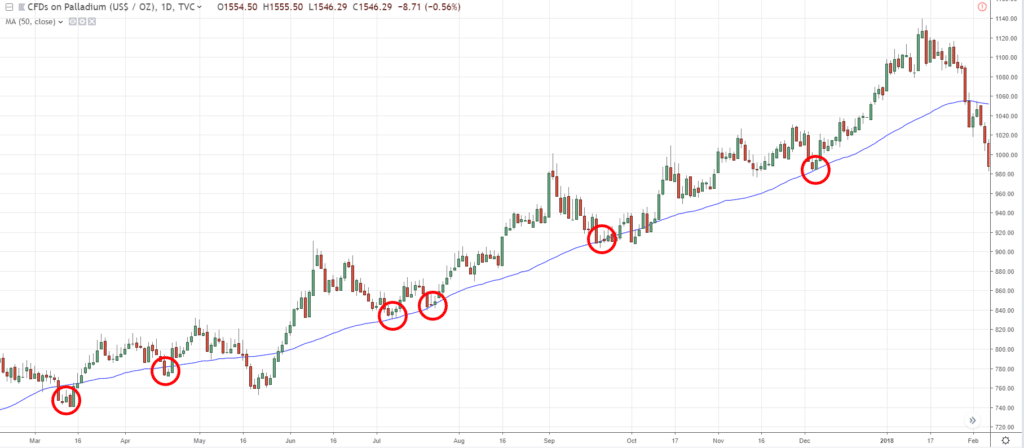
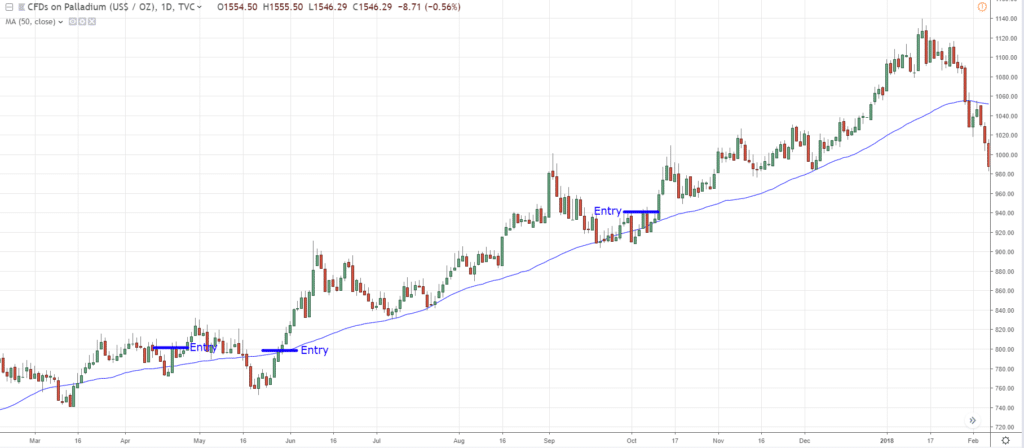
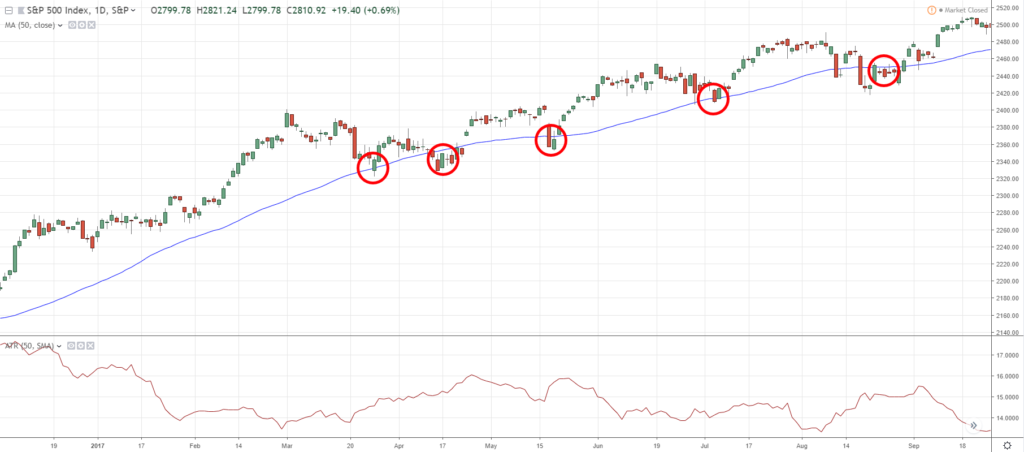
What you can do is to put on the 50-period Moving Average and see if the market tends to respect the Moving Average:
As you can see, the market clearly respects the 50-period Moving Average!
In the future, if the price comes back towards the 50-period Moving Average…
What you can do is you can look to buy!
Because the price is in the area of value.
One simple way to enter the trade is that you can wait for the price closes back above the 50-period Moving Average.
Here are some previous entry triggers:
This is a very simple entry trigger to get on-board the trend if the Moving Average serves as an area of value.
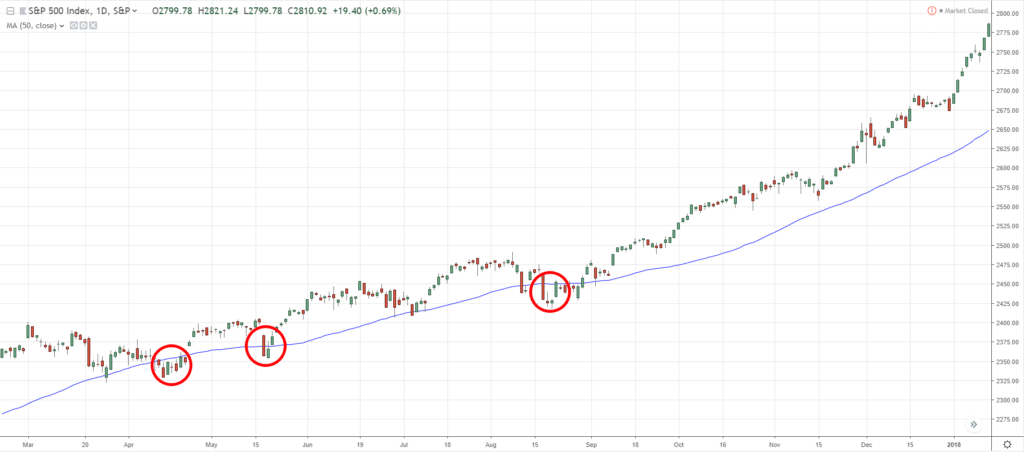
Another example, the price tends to exceed the Moving Average and closes back above it:
The reason why I shared this is that there isn’t the best Moving Average out there.
You should expect that the price would come very close to it and reverse in your direction without you.
So, you have to handle the different situations that come along.
Let’s do a quick recap on how we can use the Moving Average indicator.
Quick Recap
- It is an indicator that “summarizes” past prices
- Avoid trading the Moving Average Crossover
- You can use the Moving Average as a trend filter
- You can use the Moving Average as a trailing stop loss
- The Moving Average indicator can act as an area of value
Moving on…
Let’s talk about the Average True Range indicator...
What is the Average True Range indicator
The Average True Range Indicator is an indicator that measures the volatility in the market.
I’m not going to go in-depth with the indicator’s calculation.
Because it can be a little bit complex.
But the core concept behind this Indicator and how the values go up and down is that it looks at the range of the candles on your chart.
You can see that over here:
The range of the candles is pretty small.
This is why the ATR value is dipping slightly.
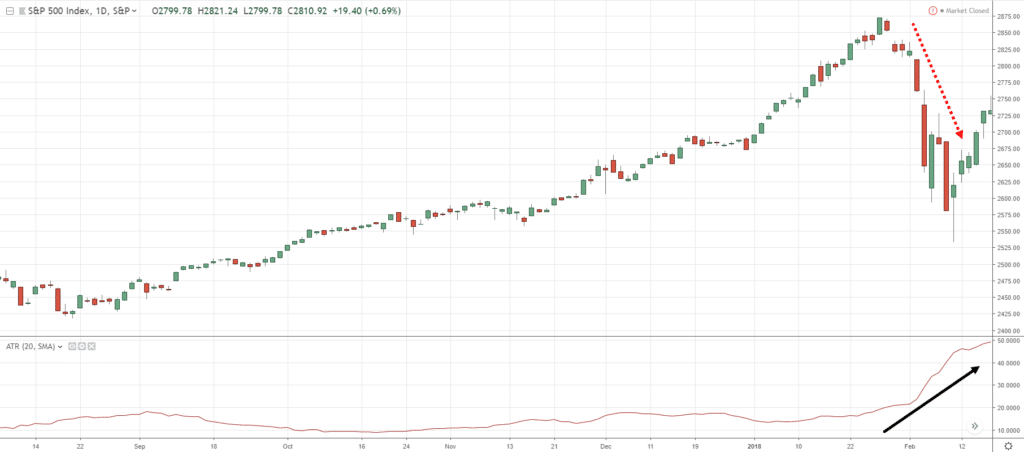
If the range of the candles is getting larger, the ATR value will increase!
As you can see over here:
You can see that the ATR value expands as the candles expand.
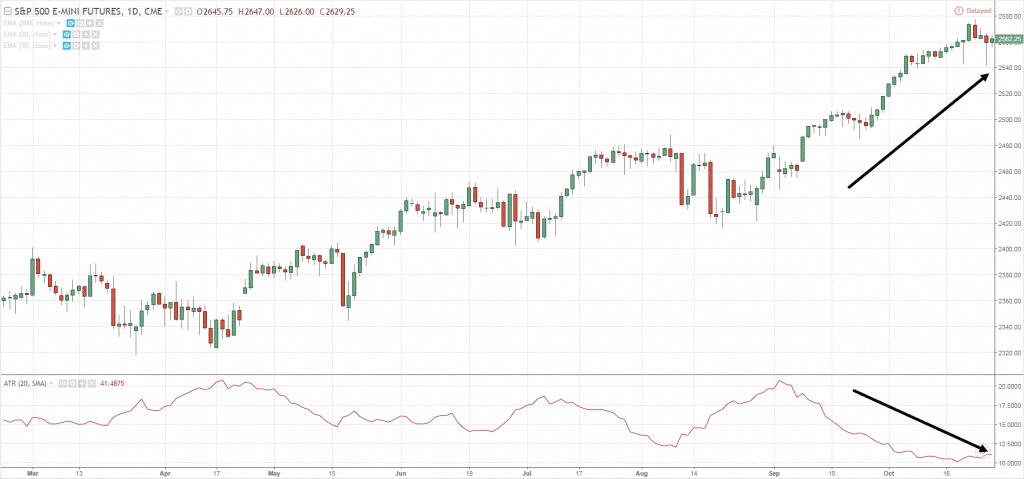
The ATR value does not measure the trend but measured the volatility in the markets.
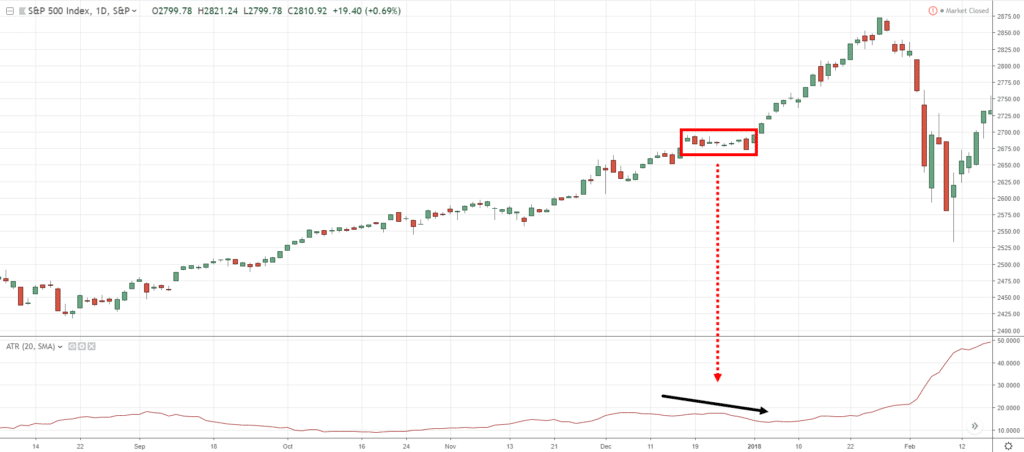
Another example:
The market is in an uptrend while the ATR value is decreasing.
Why is that?
It’s because the range of the candles is getting smaller and smaller, and that’s why your ATR value is decreasing.
Now that you understand the ATR indicator…
How can you use this to trade the markets?
Let me show you how...
How to use the Average True Range indicator as a stop loss
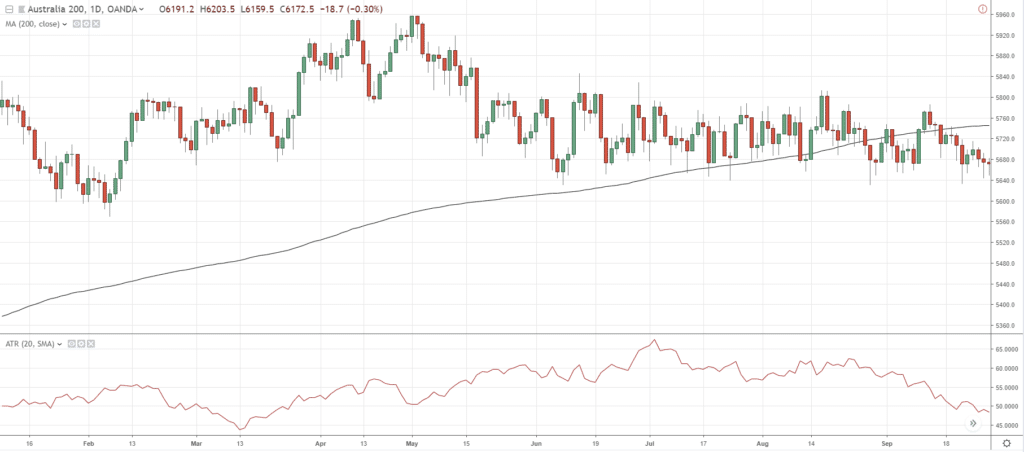
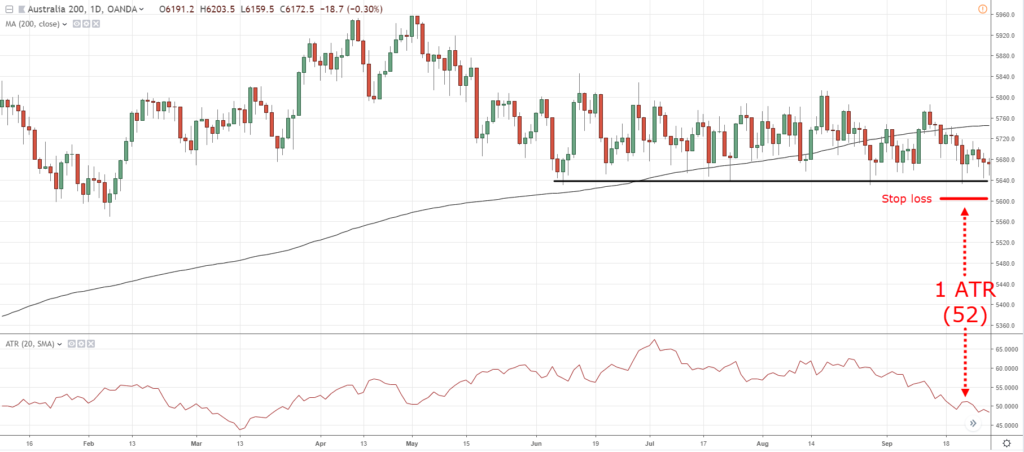
If you look at this chart:
Traders would look at this and say, “Hey Rayner, it’s a range market!”
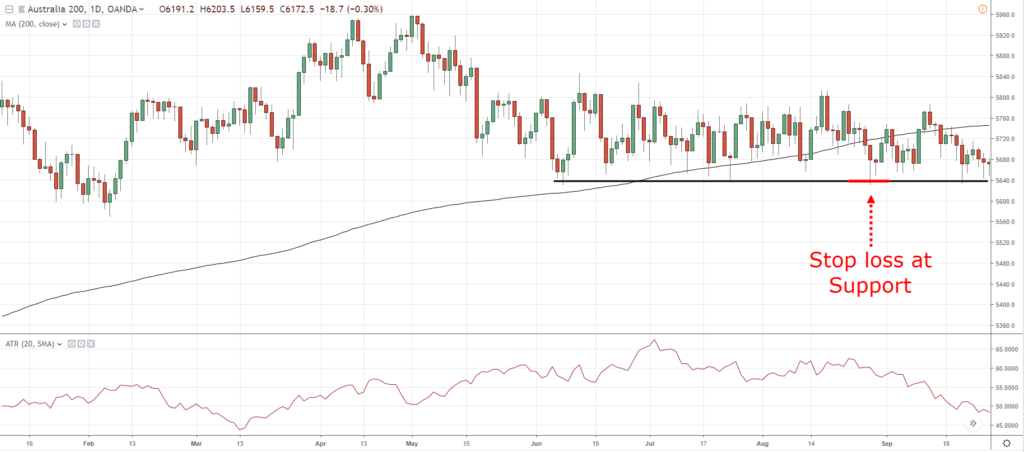
So, what they would do is that when the price is at Support…
They would go long and put their stop loss just below Support just like what the textbook says:
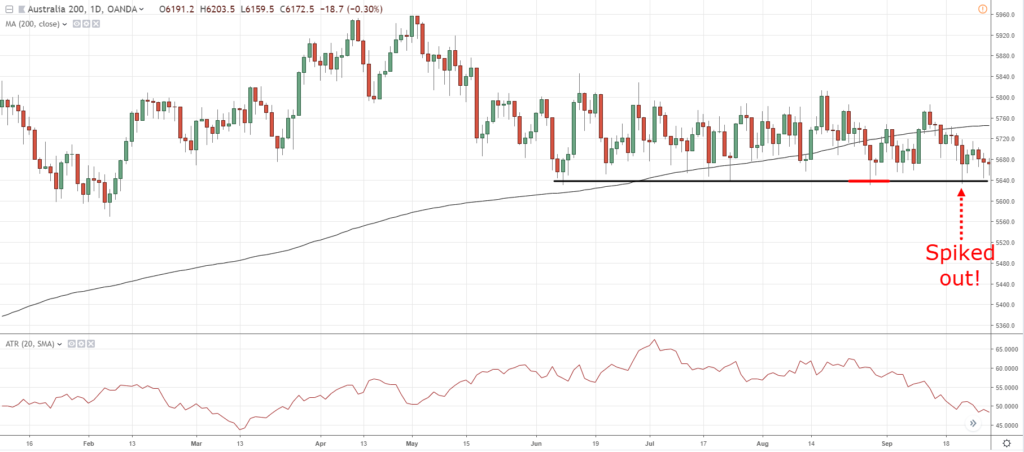
What happens is that the price retests support and get spiked out of the trade:
This makes it easy for the markets to trigger your stop loss and reverse back to your intended direction.
This is why you’ll always hear me say “Don’t set your stop loss just below support or just above resistance.”
Give it some buffer, some room to breathe!
How can you give it some room to breathe?
What you can do is use the Average True Range Indicator.
As you can see the value of the ATR is 52.
What you’re going to do is to set your stop loss 52 points below Support so that you don’t get stopped out of your trade:
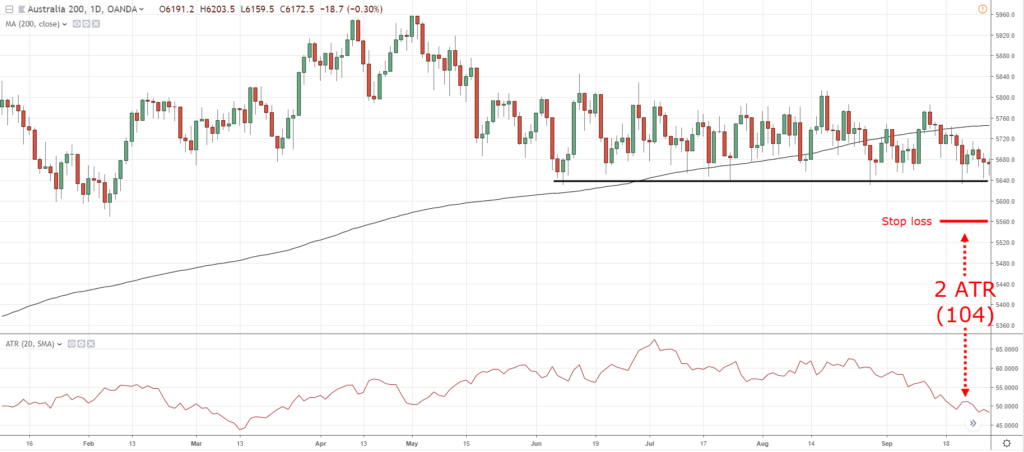
If you want to be more conservative, you can use 2ATR, meaning you would multiply 57 to 2 and your stop loss would be wider:
Next…
How to use the Average True Range indicator to trail your stop loss
Now, you can actually trail your stop loss using volatility!
You won’t just get stopped out of the trade due to the noise of the market, but when the market only shows potential signs of reversal.
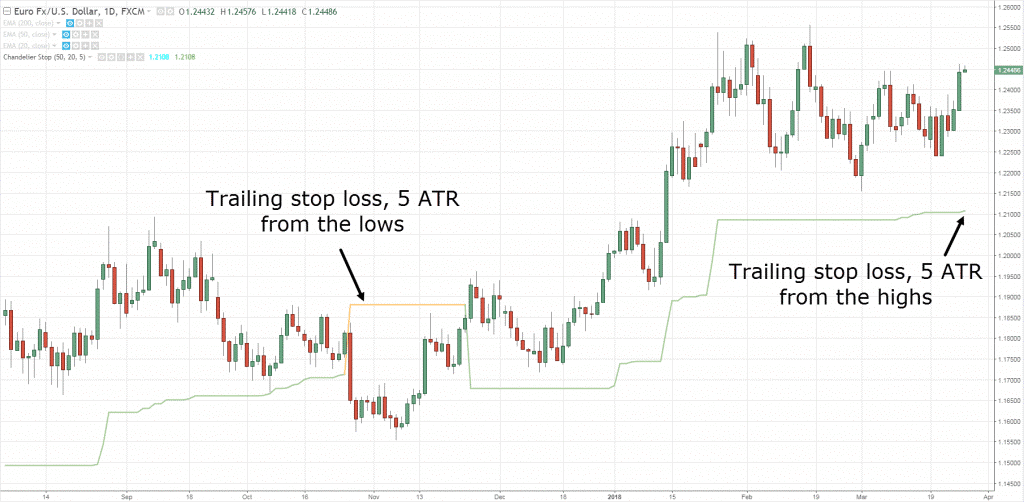
How this works is that you can use a variation of the ATR indicator which is a Chandelier Stop:
As you can see, the green line is 5 ATR away from the highs.
The only difference is that this indicator plots it on your chart.
As the price breaks higher, your ATR value will move up accordingly!
If volatility expands, your trailing stop loss will have more room to breathe.
And if volatility decreases, your ATR will automatically tighten itself.
So, this is how you can trail your stop loss according to the volatility of the market with ATR or Chandelier Stop.
If you want to find this Indicator, you can search it in the indicator section of tradingview.
Now…
What else can the ATR do for you?
Read on...
How to use the Average True Range to identify Volatility cycles
Volatility in the markets is always changing.
The market moves from a period of low volatility to a period of high volatility.
Here’s an example:
You can see that EUR/USD made a multi-year low back in 2014.
When volatility is low, it’s a sign to you that something is brewing or something is coming your way.
True enough in this cherry-picked example, volatility has expanded.
In other words, if you see that volatility has shrunk in your chart…
It’s a huge clue to you that the market is ready to breakout either higher or lower, we have no idea.
Let’s do a quick recap with the Average True Range indicator…
Quick Recap
- ATR is an indicator that measures volatility
- You can use it to set a stop loss away from support/resistance
- You can use the ATR/Chandelier stop as a trailing stop loss
- The ATR can help you identify the different volatility cycles in the market.
Moving on…
Let’s talk about the Stochastic indicator...
What is the Stochastic indicator
The Stochastic indicator is an oscillator developed by George Lane.
It tells you about the momentum in the markets or how strong the momentum is.
This is a very popular indicator and most of you have already heard of it.
But I’m pretty sure that 99% of you reading this do not know how the numbers go up and down.
So, I’m going to break this down for you on how the Stochastic values are derived:
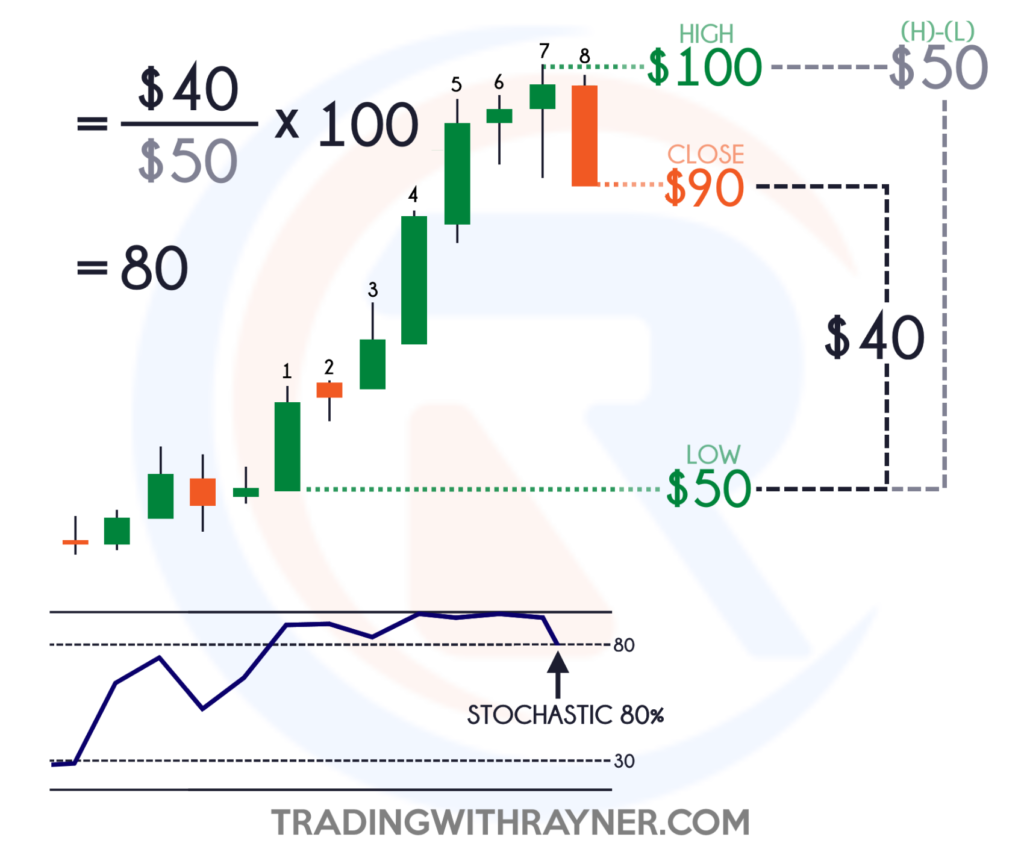
As you can see…
The 8-period Stochastic gets the lowest price, highest price, and the closing price over the last 8 candles.
With this information, you can already derive the Stochastic value.
What you would do is subtract the close from the low, you get $40.
Then, subtract the highs from the low, you get $50.
Then, what you should do is divide $40 to $50, and then multiply it by 100.
There fore, you have a Stochastic value of 80% (0.8).
Next...
How not to trade the Stochastic indicator
This is important…
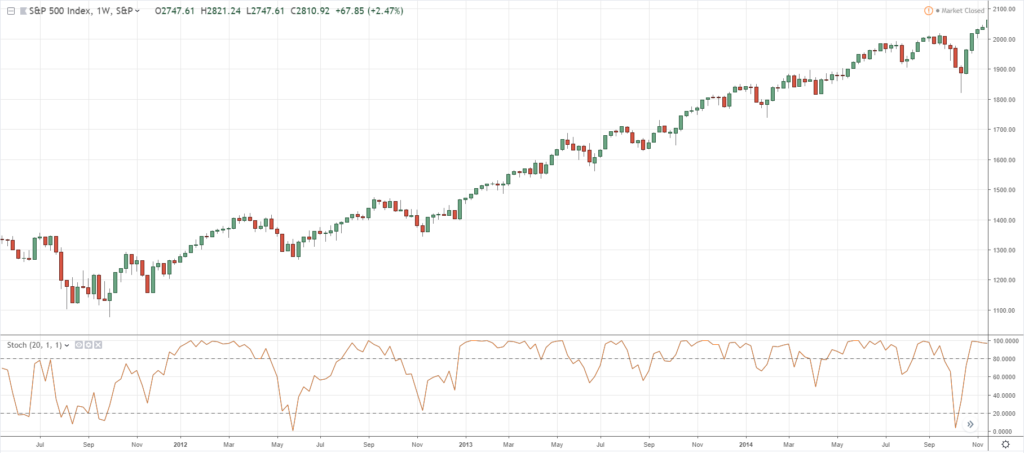
Often when traders put on their chart:
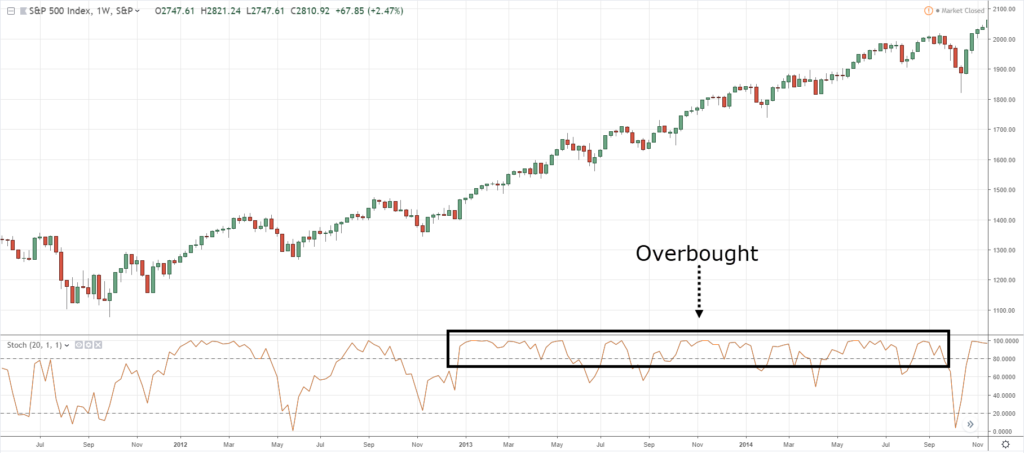
They say, “Hey the Stochastic is overbought!”
You can see that if the Stochastic indicator is overbought, you go short.
What happens?
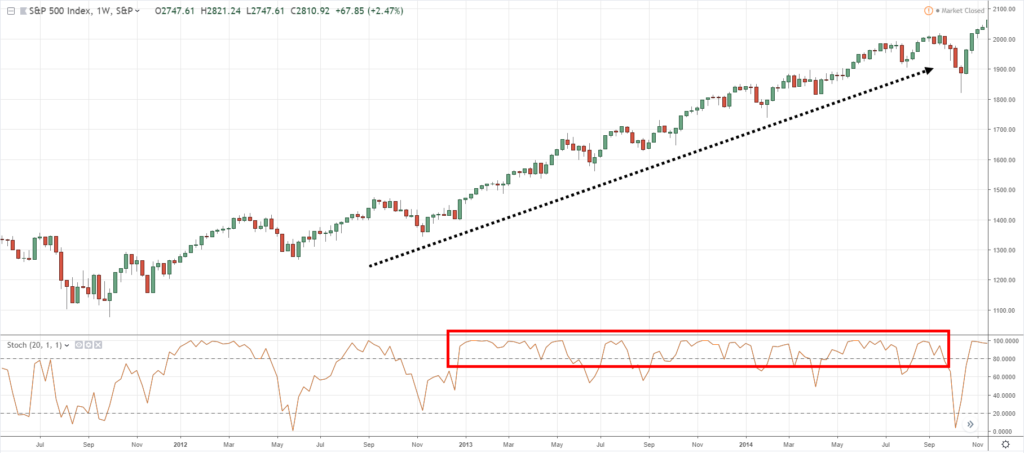
You get stopped out multiple times as a trend continues higher.
The takeaway is this…
Although the market is overbought, you have to take into consideration the context of the market.
Just because the Stochastic is overbought or oversold, doesn’t mean you just blindly trade it!
Remember, this indicator measures momentum.
If you think about this, what the market is telling you is that the market has a strong momentum behind it!
This is really against the teachings of the Stochastic indicator.
This is why it’s so important for you to understand how your indicator works first for you to use it correctly.
Again…
Just because it’s overbought, it doesn’t mean you go short.
Just because it’s oversold, it doesn’t mean you go long.
Don’t worry, I’ll explain how you can go about trading the Stochastic indicator.
Onward...
How to trade with the Stochastic indicator by finding the area of value
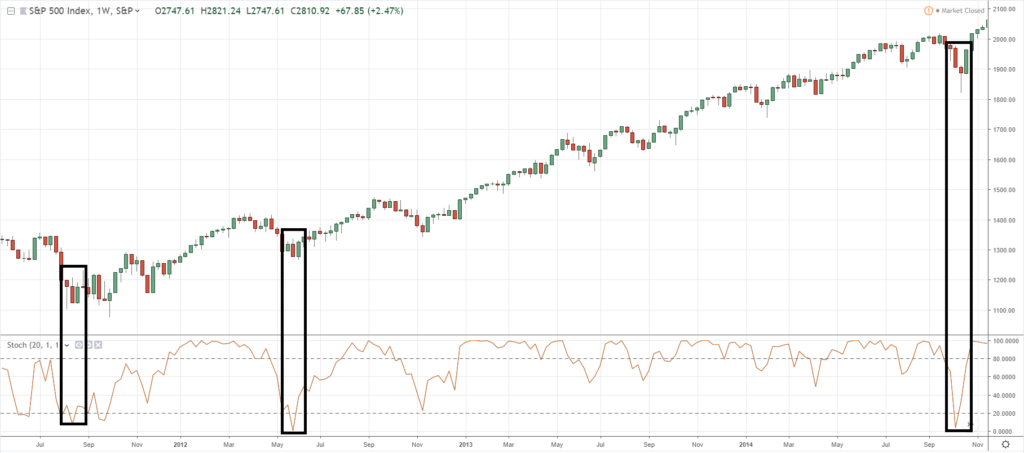
First and foremost, you can use the Stochastic as an area of value on your chart.
This would be used in conjunction with the trend.
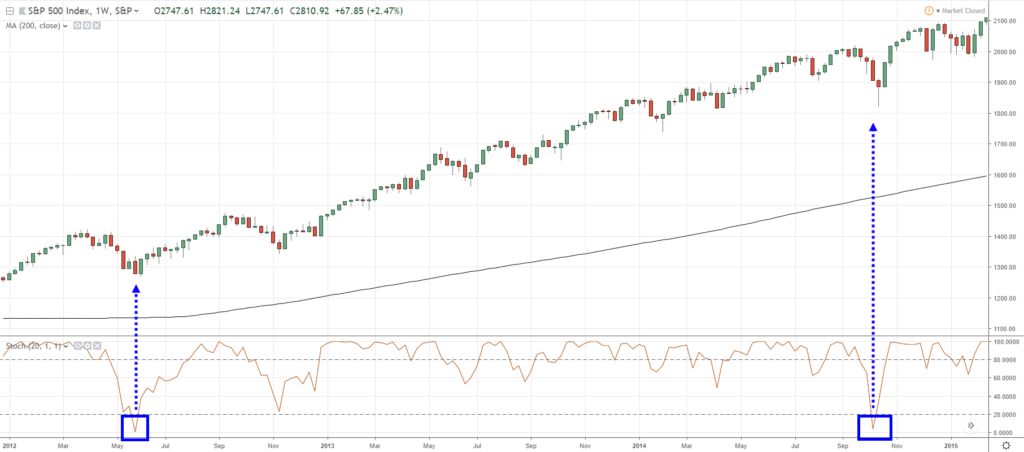
If the price is above the 200-period Moving Average, it’s in a long-term uptrend!
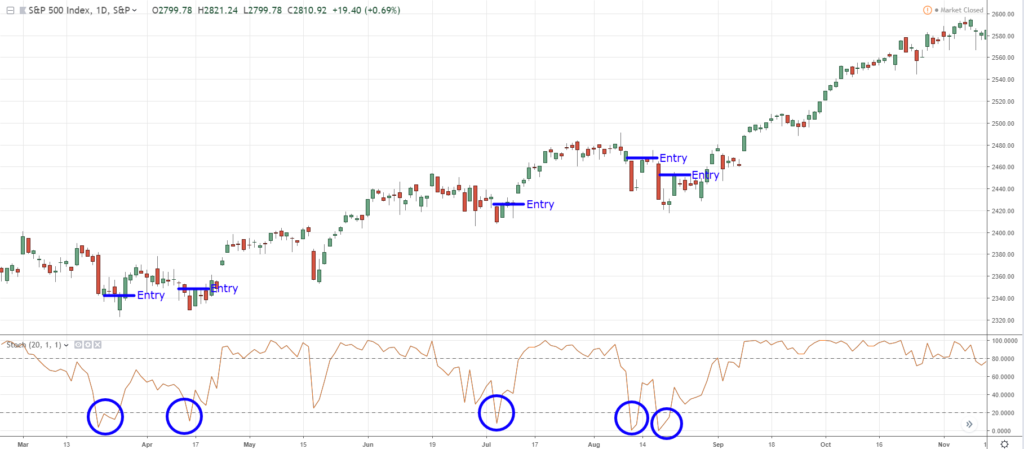
If the market is in an uptrend, you want to pay attention and look for buying signals on oversold conditions:
After all, if the market is in an uptrend, there’s a good chance that the trend will continue.
Moving on...
How to use the Stochastic indicator to time your entries
First of all, what is an entry trigger?
Entry triggers are specific signals for you to enter the trade.
In the previous examples, I have used the Stochastic setting of (20, 1, 1).
So, how you can use the Stochastic as an entry trigger is when the Stochastic cross and closes below 20, and cross and closes above it:
Just a quick recap…
Quick Recap
- The Stochastic is an indicator that measures momentum in the market
- You can use the Stochastic indicator to identify an area of value
- You can use the Stochastic indicator as an entry trigger
Let’s move on and talk about the Donchian Channel indicator…
What is the Donchian Channel indicator
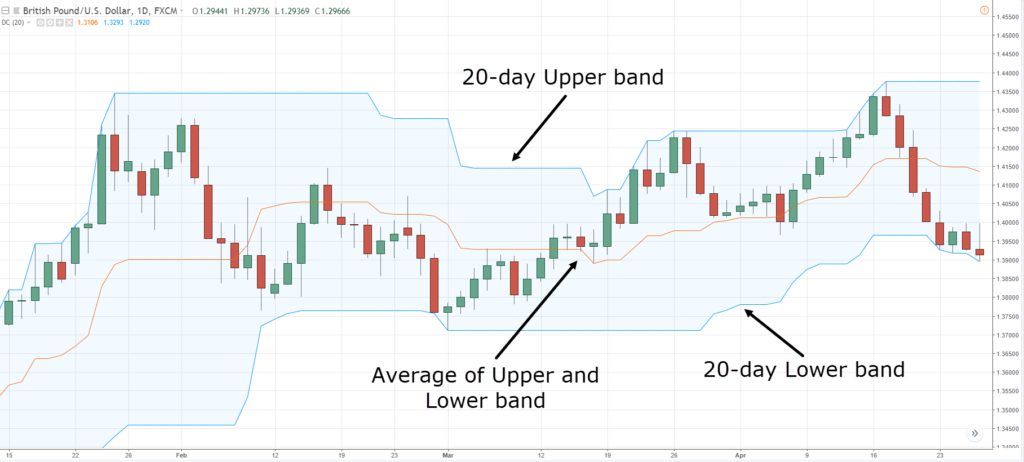
The Donchian Channel indicator is a trend-following indicator:
As you can see, it has three bands:
- Upper band
- Middle band
- Lower band
What you see is pretty much the 20-day high and low, and the middle band represents the average of the upper and lower band.
How not to trade the Donchian Channel
You should notice by now that I’m always sharing how not to trade a particular indicator first before we talk about how to trade it.
Now…
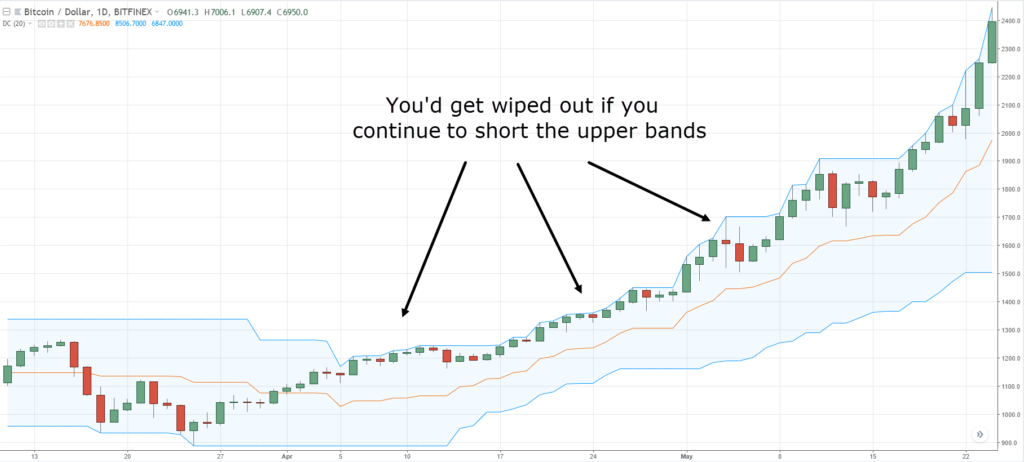
Don’t mistake the bands as Support and Resistance levels.
Because in an uptrend, the upper band will get touched very frequently:
If you are shorting just because the price is in an upper band, it’s going to be very painful for you.
So, how do you then trade with the Donchian Channel?
Let me show you...
How to time your entries with the Donchian Channel indicator
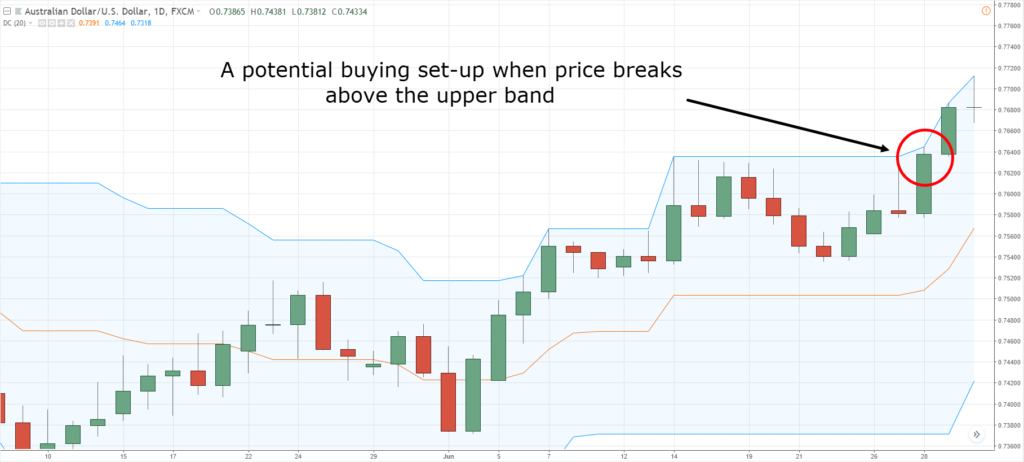
What you’re looking for is the price to hit the upper or lower band:
If the price hits the upper or lower band, it’s telling you that it has broken above/below the 20-day high/low.
And that could serve as an entry trigger to go long/short.
Also, you also have an option to change the 20-period Donchian Channel to 50, 100, or 200.
It really depends on you.
Next...
How to use the Donchian Channel indicator as a trend filter
Recall, the Moving Average can be used as a trend filter.
Now, the Donchian Channel can perform something similar as well.
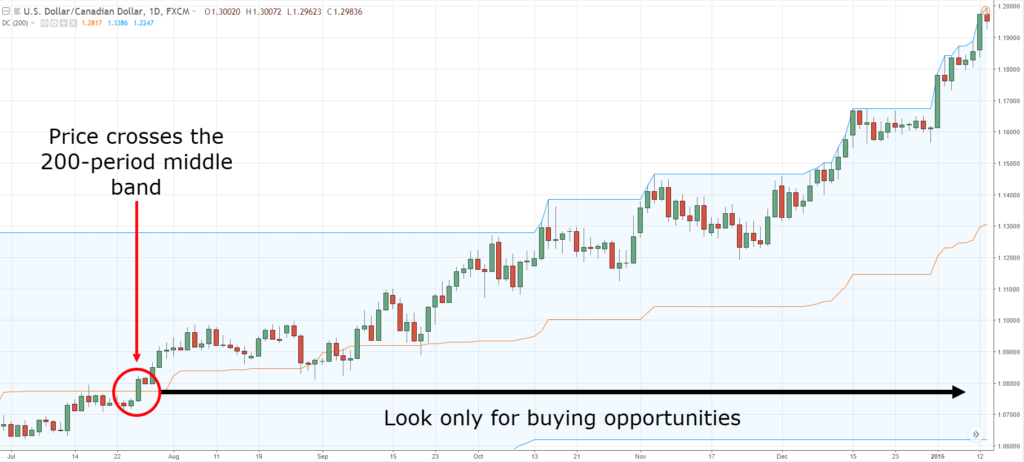
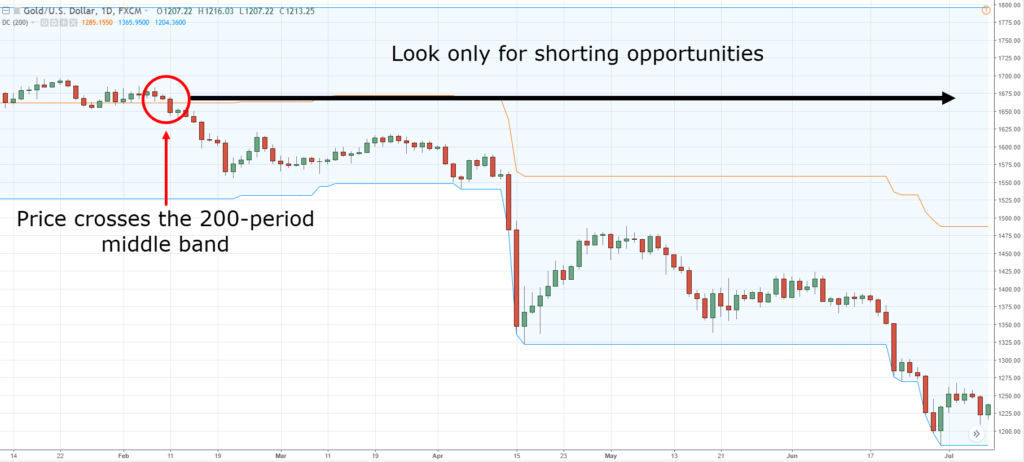
Looking at the 200-period Donchian Channel:
You want to reference the middle band if you want to be long or short.
In this case, if the price is above the middle band, you want to stay long.
This will put you on the side of the trend more often than not.
Likewise, if the price is below the middle band, you want to look for shorting opportunities only:
Moving on...
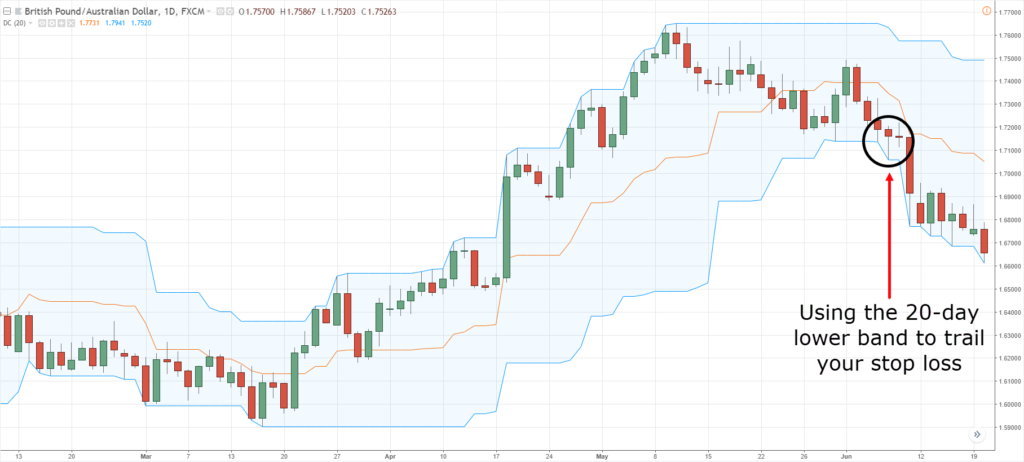
How to use the Donchian Channel indicator to trail your stop loss
Let me explain…
Let’s say you went long on the breakout over here:
How can you trail your stop loss?
If the price touches the 20-day lower band, you exit the trade.
Vice versa if you are short on a trade.
Likewise, just like the Moving Average, you can adjust the settings as well depending on goal whether you want to capture the short, medium, or long-term trend.
A quick recap…
Quick Recap
- The Donchian Channel is a trend following indicator
- Beware of shorting the upper bands or buying the lower bands with the Donchian Channel
- You can use the Donchian Channel as an entry trigger to buy breakouts or to short break downs.
- The Donchian Channel can serve as a trend filter
- You can use the Donchian Channel to trail your stop loss
At this point-in-time, you have already learned 4 trading indicators.
I’ve shared with you what is it, how it works, how not to trade it, and how to trade it.
Some of you might be thinking, “Okay, that’s all well and good, but how can you actually combine trading indicators and take our trading to the next level?”
That’s what we’ll cover right now…
How to combine trading indicators
I just have two very simple rules.
1. Each indicator must have a purpose
If you look at your chart right now there’s an indicator, and you have no idea why it’s down there just because someone on the forum used it as well.
Then hey…
Something is wrong!
Every indicator on your chart must have a purpose.
What is the purpose?
Hey, it all depends on you.
I have already shared with you the 4 indicators so far, what are their purposes and what are they used for!
If you do not know what the purpose is, just remove it from your chart.
2. Indicators must not be from the same category
For example, the Stochastic indicator is an oscillator.
So, it does not make sense to have the Stochastic indicator, RSI indicator, and the CCI indicator on your chart at the same time.
Because they have the same purpose.
You don’t want to put indicators from the same category together. One indicator per category is enough.
Let’s say you have a Bollinger band, it would not make sense if you would add Keltner Channels and Donchian Channels because they all have bands.
Here are some useful combinations that you can use in your trading…
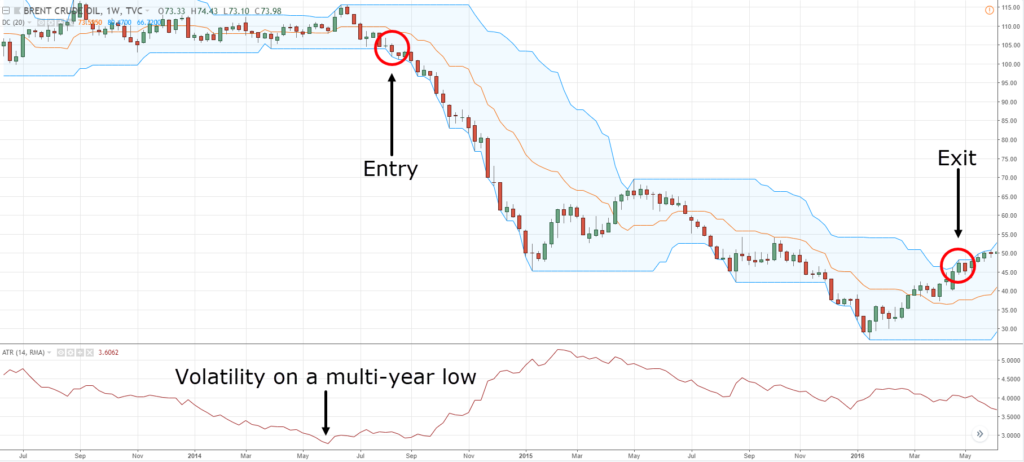
Combining the Donchian Channel and Average True Range indicator
Recall, the Donchian Channel can serve as an entry trigger to buy breakouts and short break downs.
What about ATR?
If you recall, the ATR can help you identify the volatility cycles in the market.
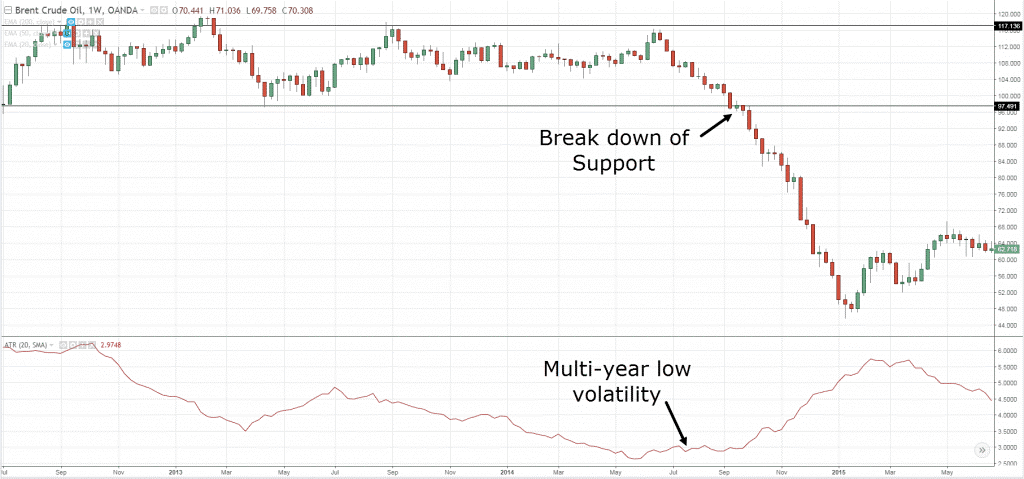
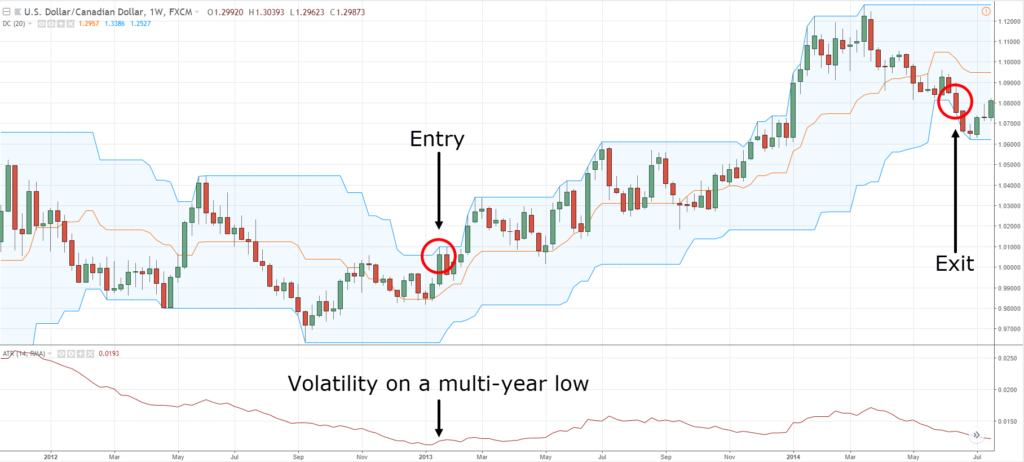
For example, volatility over here is on a multi-year low:
In the back of your mind, you should expect that volatility would pick-up and the market would break out higher or lower.
How you would enter a breakout or break down is by using the Donchian Channel as an entry trigger.
As you can see in the example, the price has hit the 20-week high.
And if you want to ride the trend, the Donchian Channel can help you trail your stop loss when it hits the lower band.
You can see how the Donchian Channel and the ATR indicator complement one another.
Additionally, you can use the ATR indicator to set your stop loss by subtracting the ATR value from the lows of the candle.
Another example…
You can see that the ATR value is already showing a multi-year low:
Again, you can go short and time your entries with the Donchian Channel and trail your stop loss with it as well.
What else?
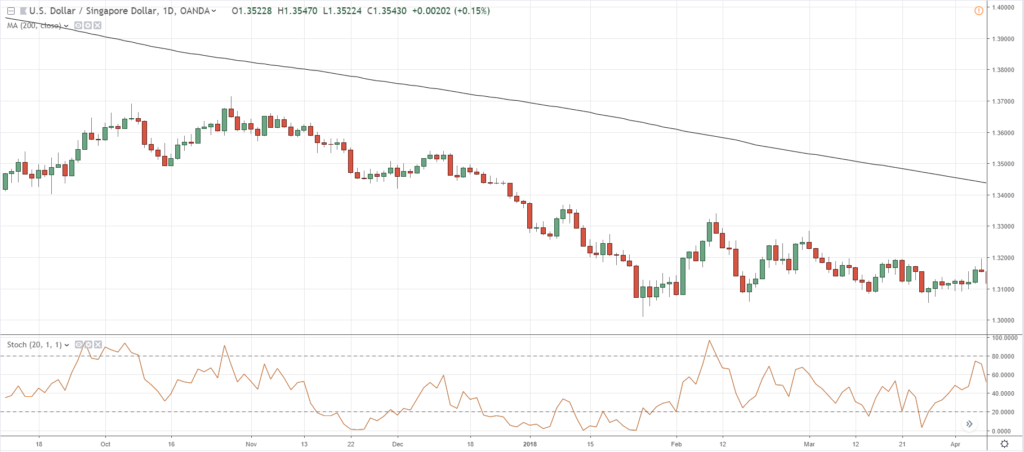
Combining the Moving Average and Stochastic indicator
Again, the Moving Average indicator can serve as a trend filter.
As you can see:
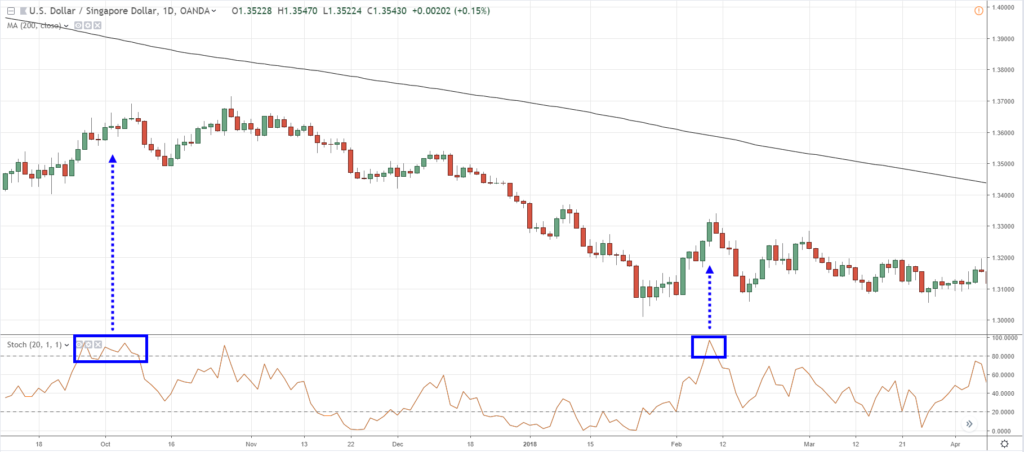
The price is below the 200-period Moving Average so you want to stay short.
Your question now is “where do you short?”
The Stochastic indicator gives you the area of value to go short.
Recall, if you are looking to stay short, look at overbought (area of value) levels to go short:
Again, you can see how these indicators can complement one another.
One acts as a trend filter, and one acts as an area of value.
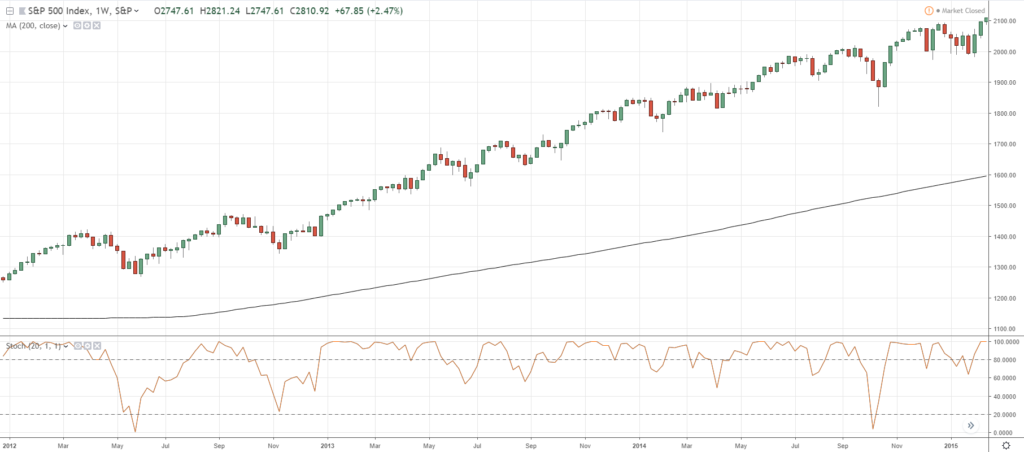
Another example, the price is above the 200-period Moving Average:
The price is above the 200-period Moving Average, so you should only look to go long.
Now, at which part do you want to buy?
At the area of value!
One thing to note that all of the examples you see here are cherry-picked.
In the real world, there will be variations of it.
The reason why I cherry pick this because it’s so much easier to explain the concepts I am teaching you right now.
But in the real world of trading…
There will be losses for sure.
I guarantee it.
If you are asking for more combinations, then how about…
Combining the Moving Average and the Average True Range Indicator
Earlier, I mentioned that the Moving Average can also serve as an area of value on your chart.
As you can see over here:
You can see that the price is respecting the 50-period Moving Average.
If you notice, there are also times where the price has exceeded the 50 MA.
To prevent being stopped out prematurely, you can use the ATR to give your stop loss a buffer.
Quick Recap
- Each indicator on your chart must have a purpose
- Donchian Channel + Average True Range
- Moving Average + Stochastic
- Moving Average + Average True Range
Now…
Before I end this course, I want to talk about the framework to what you’ve learned so far.
The Framework
If you think about this, what I’ve done throughout the course is:
- I shared with you what the indicator is and how it works
- I shared with you when NOT to use the indicator
- Then, I shared with you when to use the indicator
Although I didn’t cover a lot of indicators, you can apply this framework to any indicators out there!
May it be Bollinger Bands, Keltner Channels, Fibonacci, MACD, RSI, whatever!
The framework can be applied.
I would rather teach you the framework than blindly telling you to buy and sell.
Because that will not make you a better trader.
So, with this framework in mind, I know you can use this knowledge to make better trading decisions.
With that said, let's do a summary of what you've learned today...
Summary
- A Moving Average can be calculated in three ways: Simple, Exponential Weighted
- You can use the Moving Average as a trend filter, trailing stop, and to determine an area of value
- The Average True Range indicator measures the volatility of the market
- You can use the Average True Range indicator to trail your stop loss and identify low volatility markets about to breakout
- The Stochastic indicator tells you about the momentum in the markets
- You can use the Stochastic indicator to time entries and trade it during oversold in uptrends, and overbought levels on downtrends
- The Donchian Channel indicator is a trend-following indicator that visualizes the highs/lows for an X period of time
- You can use the Donchian Channel to time entries, filter trends, and to trail your stop loss
- You can combine the Donchian Channel with ATR, Moving Average with Stochastic, and Moving Average with ATR

