
Hey, hey! What’s up, my friend?
If you’ve been following me for a while, you’ll know I’ve been trading for over a decade now. I’ve tried it all… patterns, indicators, price action setups, chart formations, strategies, systems… You name it, I’ve probably tested it!
And I’ll be the first to admit, not everything works. In fact, most strategies break down once market conditions change.
But after 10+ years of ups and downs, trial and error, backtesting, and refining, I’ve come to a simple conclusion:
Three types of trading strategies have truly stood the test of time.
They’re the same three strategies I personally use today to manage my 7-figure trading account.
Yes, with live capital—not a demo account. This isn’t ‘trust me, bro’ theory; it’s proven practice.
I’m talking about strategies backed by solid data, tested over decades, and actually implemented in the real world.
So, if you’re sick of chasing gimmick strategies that blow up your account and are looking for a reliable, robust approach that works in the long run, then you’re in the right place.
In this article, you’ll learn:
- The 3 trading strategies that still work today, and likely will continue to work for years to come
- The exact concepts and logic behind each one
- Step-by-step rules you can use, including entries, exits, and risk management
- Performance stats based on 10–25+ years of backtesting
- When each strategy shines… and when it struggles
- How combining strategies can improve your consistency and reduce drawdowns
- And answers to common questions like:
- “How much capital do I need?”
- “Which strategy suits my personality best?”
- “Can I use these systems in forex or crypto?”
Now, before diving in, I want to address something important…
“Rayner, aren’t these just backtested results? Does this stuff actually work live?”
I get it, and it’s a fair question.
It’s easy to be skeptical when someone shows you a system that returned thousands of percent in a backtest. But here’s the deal:
- I trade these systems myself.
- I’ve shown live results on my channel.
- I’ve used these approaches to consistently grow my own account, even through tough markets.
So the bottom line? These aren’t textbook concepts. They’re strategies I’ve refined and implemented with real money through all market conditions.
If that sounds good, then settle in, and let’s break down these three trading strategies that work, backed by data, logic, and real-world application.
Trading Strategies #1: Mean Reversion
Let’s start with a strategy that many traders overlook, but once you understand how it works, you’ll see why it’s so powerful: mean reversion.
Here’s the idea.
Markets don’t move in straight lines. Even in a strong uptrend, price moves in waves; it rallies, pulls back, rallies again. And during those pullbacks, the price can become stretched far away from its average level, almost like a rubber band.
When that happens, there’s often a snapback, a quick bounce back toward the mean. That’s the core concept of mean reversion.
As a trader, your job is to identify strong uptrending stocks, wait for a deep pullback, and buy when most people are fearful.
Then, once the bounce comes, you get out with a quick profit.
You’re not trying to ride the entire trend. You’re not waiting for confirmation.
In fact, you’re often stepping in when the market still looks bearish.
It’s like catching a falling knife, but in a structured, risk-managed way.
This strategy thrives in markets that are choppy or range-bound. When stocks are bouncing around rather than trending smoothly, that’s when mean reversion setups appear most often.
I know what you are thinking.
The concept sounds great, but how do you trade it in practice?
Don’t worry, I’ll walk you through the exact rules.
Mean Reversion Trading System Rules
This mean reversion system is designed to trade US stocks, specifically from the Russell 1000 index.
These are large, liquid companies, which means easier entries and exits with minimal slippage.
Now, this system trades the Russell 1000 on the daily timeframe.
You will use up to 20 percent of your capital per trade, with a maximum of five open positions. So, for example, if you’re trading a $10,000 account, you would allocate $2,000 per position, fully invested when you hold five trades.
Let’s list these to make it easier to reference.
Markets traded:
Russell 1000 stocks
Timeframe:
Daily
Risk management:
20% of capital for each stock and a maximum of 5 positions.
All makes sense?
Good, let’s move on to the actual rules to initiate a trade.
Trading rules:
- The stock must be above its 200-day simple moving average. This is your trend filter. It ensures you’re only trading stocks that are in a longer-term uptrend.
- The stock must close below the lower Bollinger Band, set to 2.5 standard deviations. This helps identify when the stock is deeply oversold relative to its recent price action.
- Place a buy limit order 3 percent below the closing price of the candle that triggered the setup. This increases your chances of getting a better entry price and avoids chasing a fast-moving stock.
- Exit the trade at the next market open if the previous day’s close saw the 2-day RSI cross above 50. Alternatively, exit after 10 trading days, whichever comes first. This is your exit signal and time-based stop to avoid holding onto trades that fail to bounce.
- If multiple stocks meet the criteria on the same day, prioritize buying the ones that have gained the most over the last 150 days. You are not just buying any oversold stock; you are buying a temporary dip in a market leader. These are often the stocks that ‘snap back’ the hardest and fastest.
Note: Bollinger band settings are a 20-day moving average and a 2.5 standard deviation
These rules are simple, but powerful. And because they are clearly defined, you can backtest the system and accurately assess its performance over time.
Let’s look at an example to give you an idea of what this might look like on the chart…
Daily Chart Corebridge Financial Inc Trade Setup
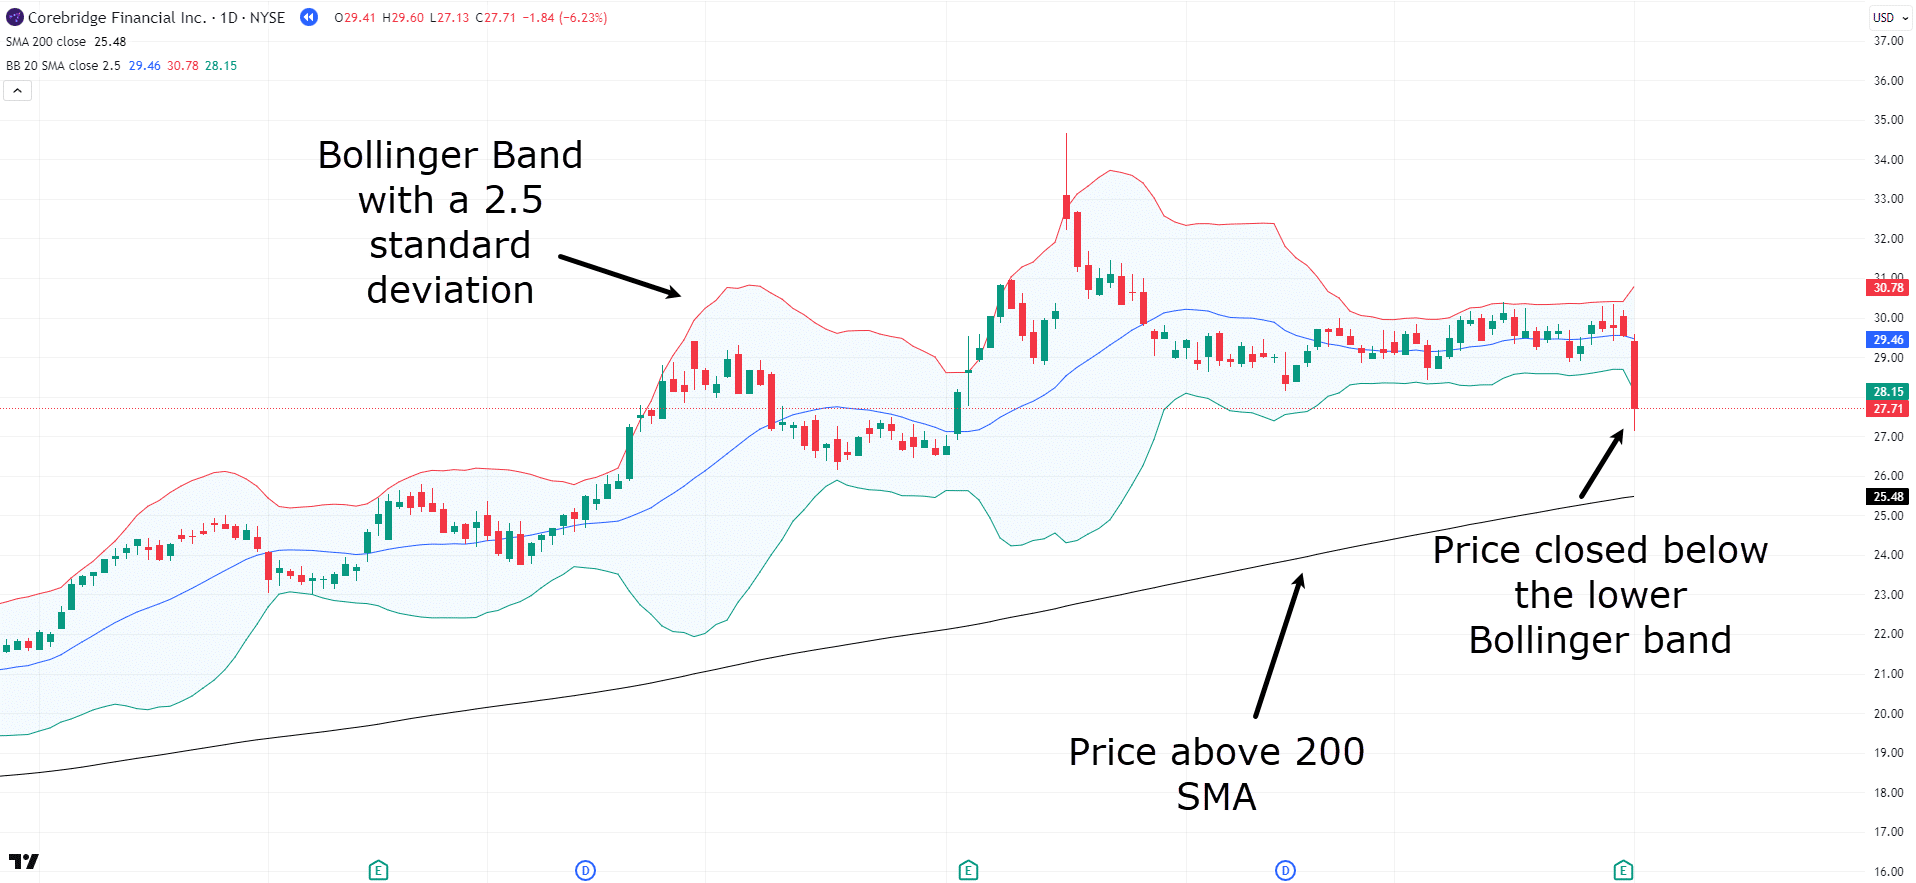
As you can see price closed below the lower Bollinger band with the adjusted settings of 2.5 standard deviations.
Price is still above the 200 SMA, so this ticks the first two requirements for a trade…
Corebridge Financial Inc. Entry Order
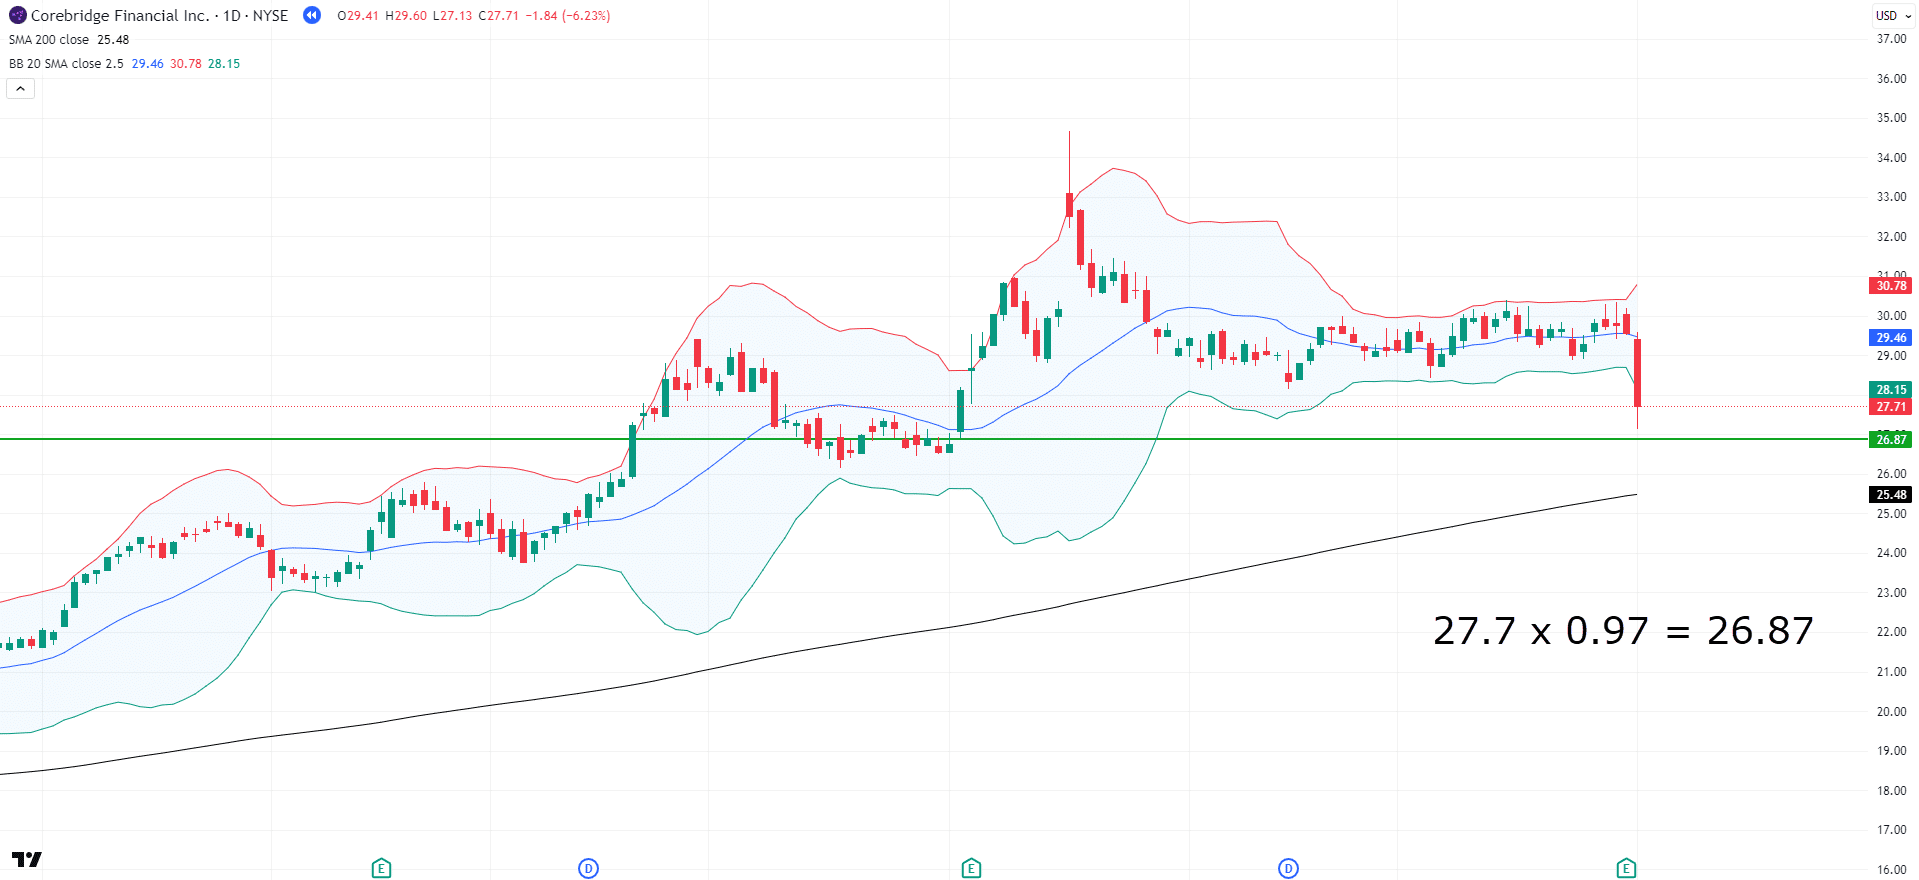
Our next step is to place an order 3% below the closing price. A simple way to work this out is to multiply the current price by 0.97, as that will show a 3% decrease in value.
Let’s see if it gets filled…
Corebridge Financial Inc. Buy Order confirmed
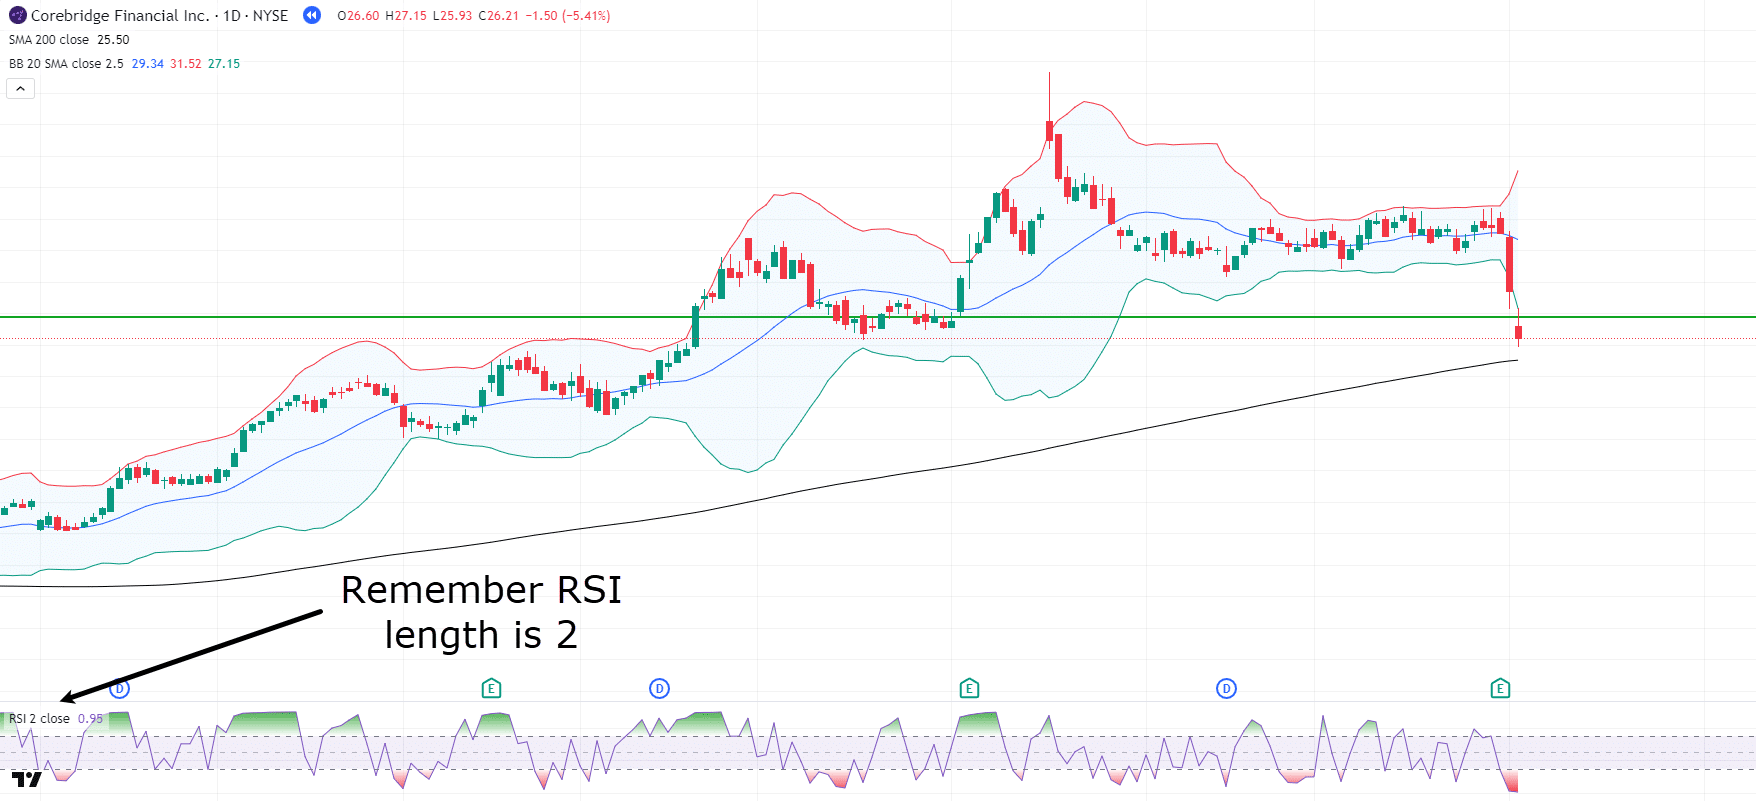
The order fills, meaning the trade is now active. Now, if you follow the trade exit rules, you must wait for a crossover of 50 on the RSI with the RSI length being 2, or wait for 10 trading days.
Let’s see what happens…
Corebridge Financial Inc. Exit
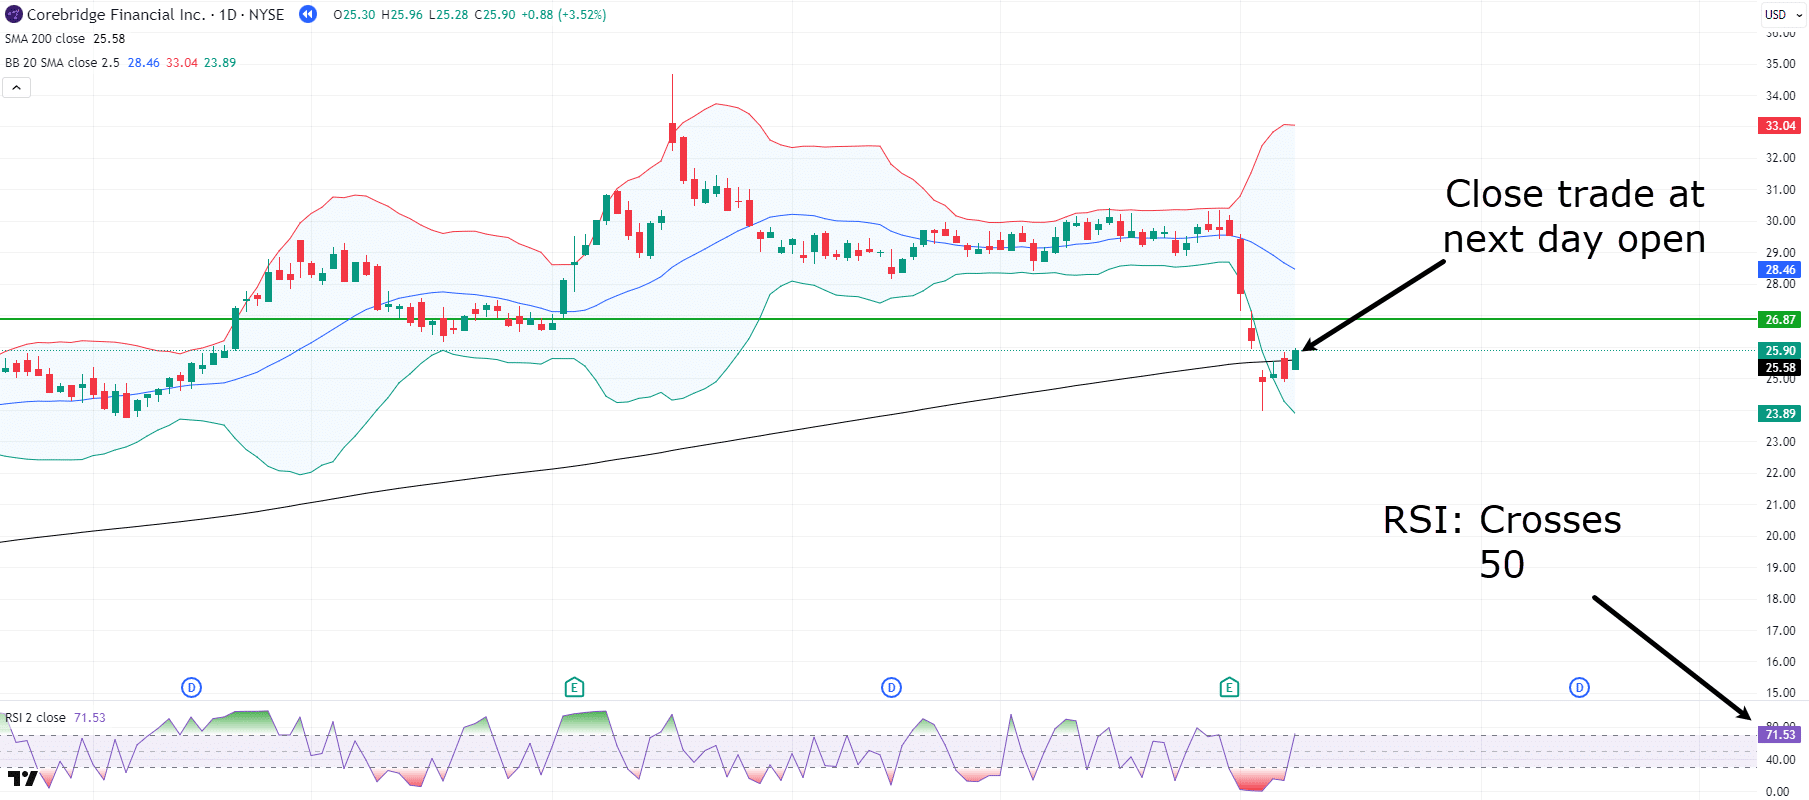
So price then crosses above the 50 RSI, and the trade is closed the next market open for a small, manageable loss. That’s a great outcome, though, as the system’s rules got you out quickly without any serious damage.
Now that you know how to execute the process, let’s look at the performance over the years.
Mean Reversion Trading System Performance
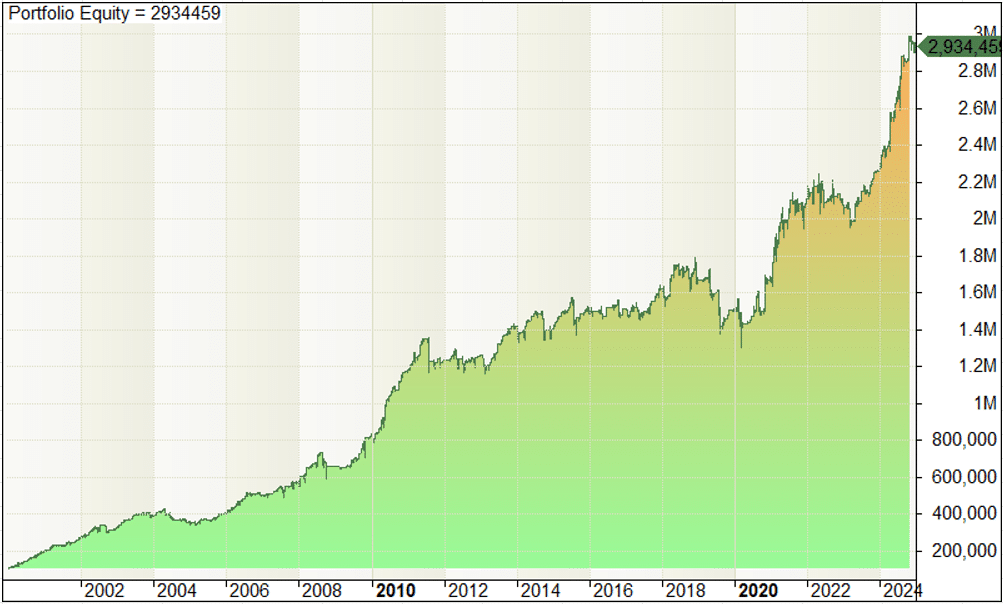
This strategy has been tested using more than 25 years of historical stock data. The results below reflect the performance of this exact system applied consistently without any guesswork…
Mean Reversion Trading Strategy Equity Curve
Mean Reversion Trading Strategy Results
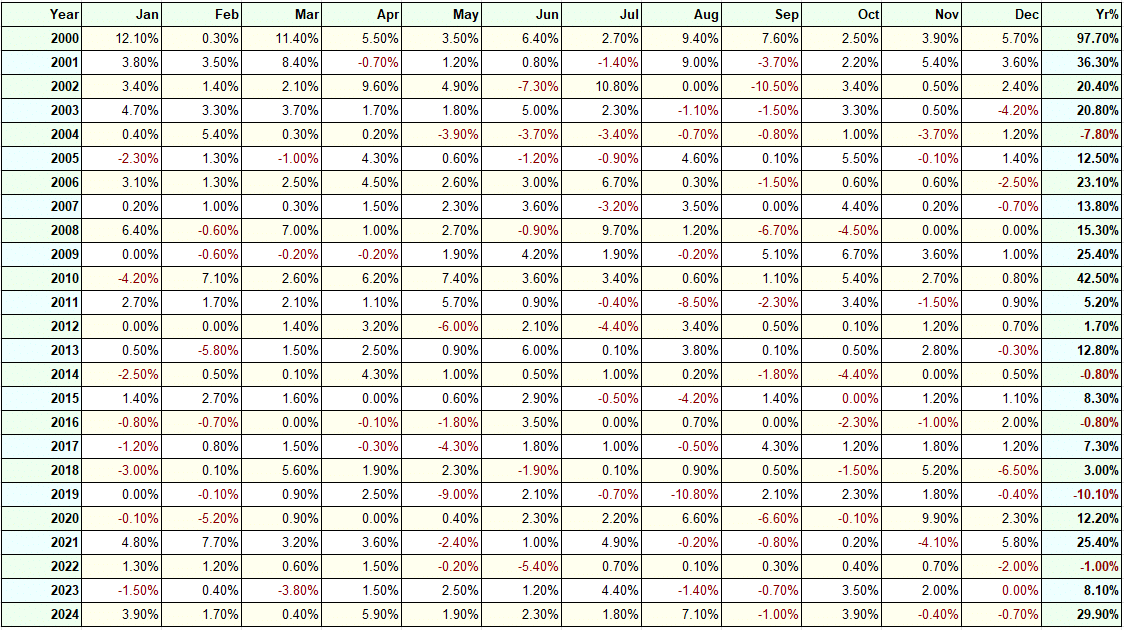
Let’s look at the total numbers:
Total return: 2,834 % (Since 2000)
Annual return: 14.47%
Winning rate: 66.1%
Payoff ratio: 0.77 (average profit/ average loss)
Maximum drawdown: 27.43 %
The system boasts a high win rate, winning roughly two-thirds of its trades. This consistency comes with a trade-off, as the average winning trade is slightly smaller than the average losing trade, resulting in a payoff ratio below one.
For many traders, a payoff ratio under one is an immediate red flag. However, it’s a common trade-off for high win rate strategies.
With proper position sizing and consistent execution, this system remains profitable over the long term because the frequency of winners outweighs the size of the occasional losses.
Pros and Cons of Mean Reversion Trading
Every trading strategy has strengths and weaknesses.
Mean reversion is no exception. Understanding these characteristics helps you know when to use the strategy and what to expect along the way.
Pros
This strategy has a relatively high win rate, often above 60 percent. That can help boost confidence and reduce the emotional toll of frequent losing trades.
It also performs well in sideways or choppy market conditions where trending systems tend to struggle. Mean reversion setups are common, so you’ll usually have regular trading opportunities.
Now, let’s look at the other side – the weaknesses.
Cons
The reward-to-risk ratio is lower than one, meaning that losses are often larger than wins.
This can be hard to accept for traders who are focused only on individual trade outcomes. The strategy also tends to underperform in strong bear markets, especially when there’s broad fear or sudden market-wide selloffs.
In those situations, multiple positions can get hit at once, leading to drawdowns.
However, because this system only trades stocks that are above the 200-day moving average, it will naturally filter out most bear markets over time. When conditions are truly negative, you’ll likely be in cash, waiting for things to stabilize before new trades appear.
Now you know what the mean reversion trading strategy is all about.
So let’s move on to the next trading strategy to add to your list, the momentum trading strategy.
Trading Strategies #2: Momentum
The second strategy we’ll look at is momentum trading, and this one is ideal if you want a system that’s simple, low maintenance, and still backed by solid performance.
So what exactly is momentum trading?
The basic idea is this: markets that have been moving strongly in one direction tend to keep moving in that direction, at least for a while. Strength attracts more strength.
As a momentum trader, your job is to identify markets in a healthy uptrend and ride them while the momentum lasts. You don’t need to predict reversals or time pullbacks. You’re simply jumping on board when something is moving up, and staying with it until the move starts to fade.
This type of strategy is especially effective when applied to ETFs, because they represent broad segments of the market and tend to show cleaner trends over time.
And here’s the best part: this system only requires a few minutes of your time each month.
That’s right. Once a month, you check a few conditions, adjust your positions if needed, and you’re done.
No sitting in front of the screen all day, no chasing signals across multiple timeframes.
It’s straightforward, efficient, and great for anyone with limited time.
Let’s take a closer look at how it works.
Momentum Trading System Rules
This momentum system trades four popular ETFs, each representing a different part of the financial markets:
- GLD: Gold
- SPY: S&P 500 (US stocks)
- TLT: (Treasury Bonds)
- DBC: (Commodities)
By using ETFs from different asset classes, the strategy naturally adds diversification and reduces reliance on the stock market alone.
This is about looking at a monthly timeframe with a risk management style a bit different from the previous strategy.
Allocate 50 percent of your capital to each position, with a maximum of two positions at any time.
So if you’re trading a $10,000 account, you’d place $5,000 into each ETF.
You’ll never be holding more than two ETFs at once.
Markets traded:
GLD, SPY, TLT, DBC
Timeframe:
Monthly
Risk management:
50% of the account
Trading rules:
- On the first trading day of each month, check which ETFs are above their 200-day moving average. This acts as your trend filter and helps avoid downtrending or weak markets.
- Among those that qualify, rank the ETFs by their 12-month rate of change (ROC). This measures how much the price has increased over the past year.
- Go long the top two ETFs from that list, the ones with the strongest momentum.
- Hold those ETFs until the next monthly evaluation. If they still qualify, continue holding. If they drop out of the top two or fall below the 200-day moving average, sell and replace with the next strongest.
The logic is simple: you’re only buying markets that are both in an uptrend and leading in performance. It’s a clean, rules-based way to stay on the right side of the market without needing to overthink anything.
Let me show you an example on the chart so you can get a feel for the settings and what to look for…
Momentum Strategy Filter
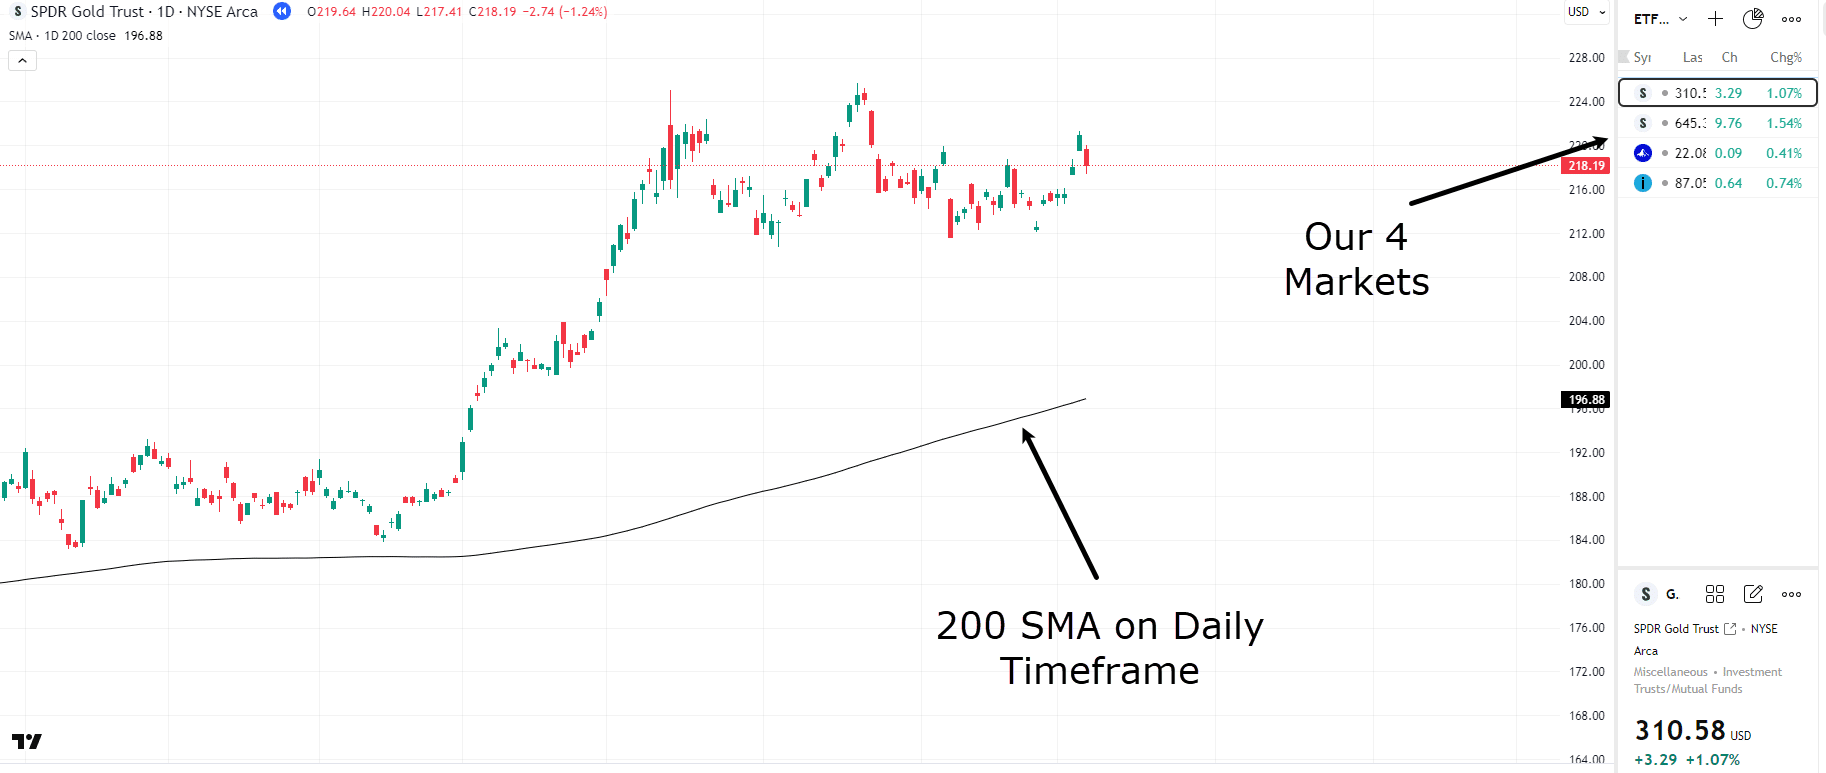
As you can see, the watchlist contains the four markets this system trades. Go through each market on the daily timeframe using the 200 moving average…
Example of price below 200 Moving Average
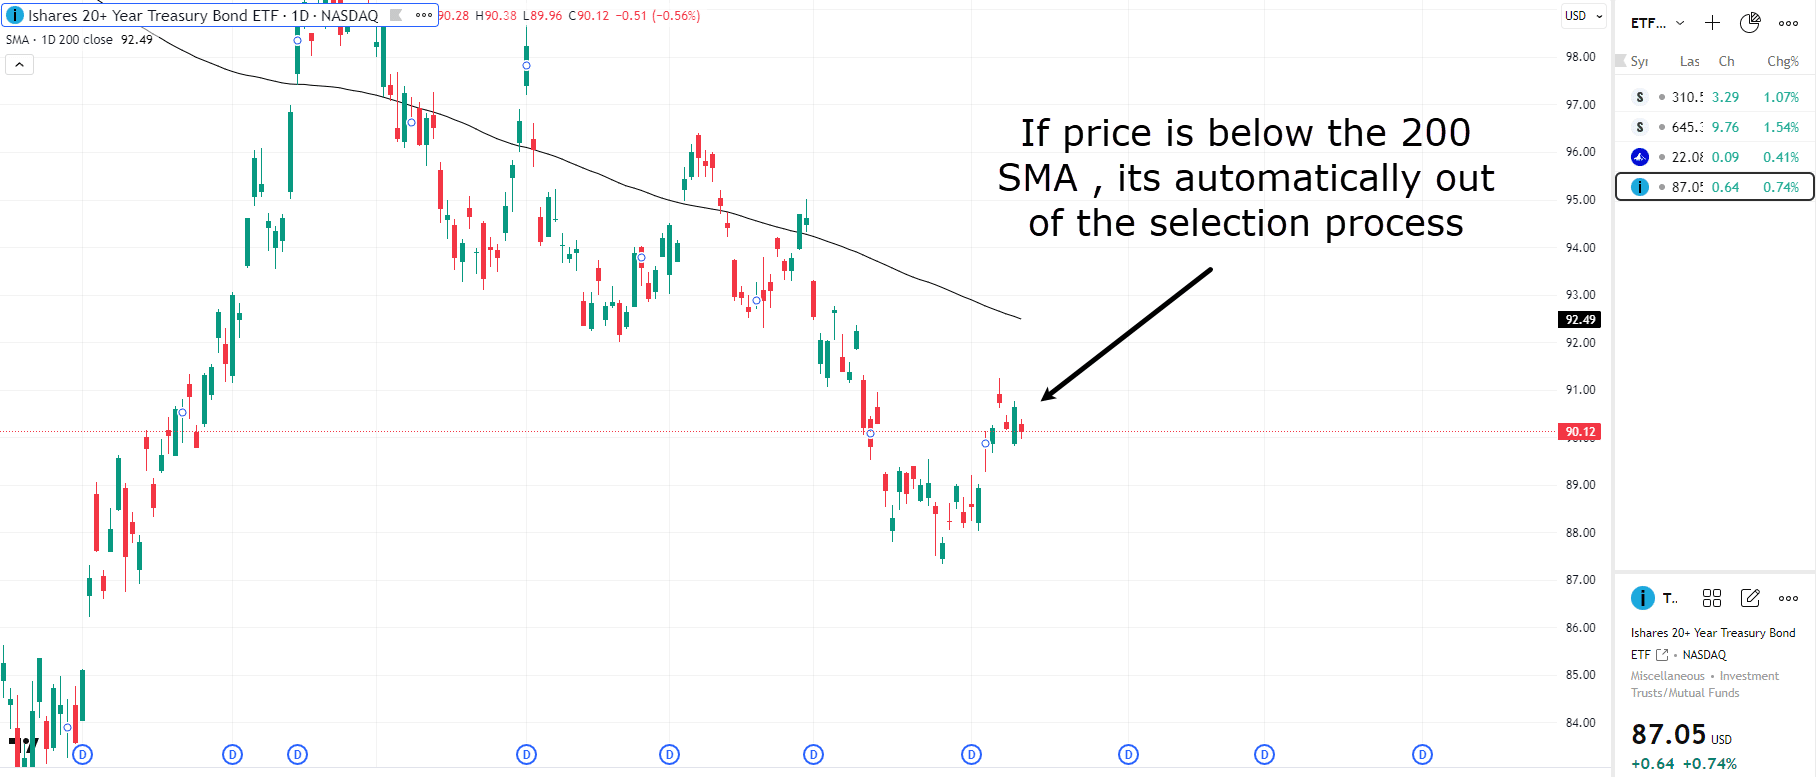
If the price is above the moving average, it qualifies for the next step. If not, then exclude it from the ROC filter.
So for this example, you would exclude the Treasury Bond ETF from the next step…
ROC Monthly Timeframe Chart
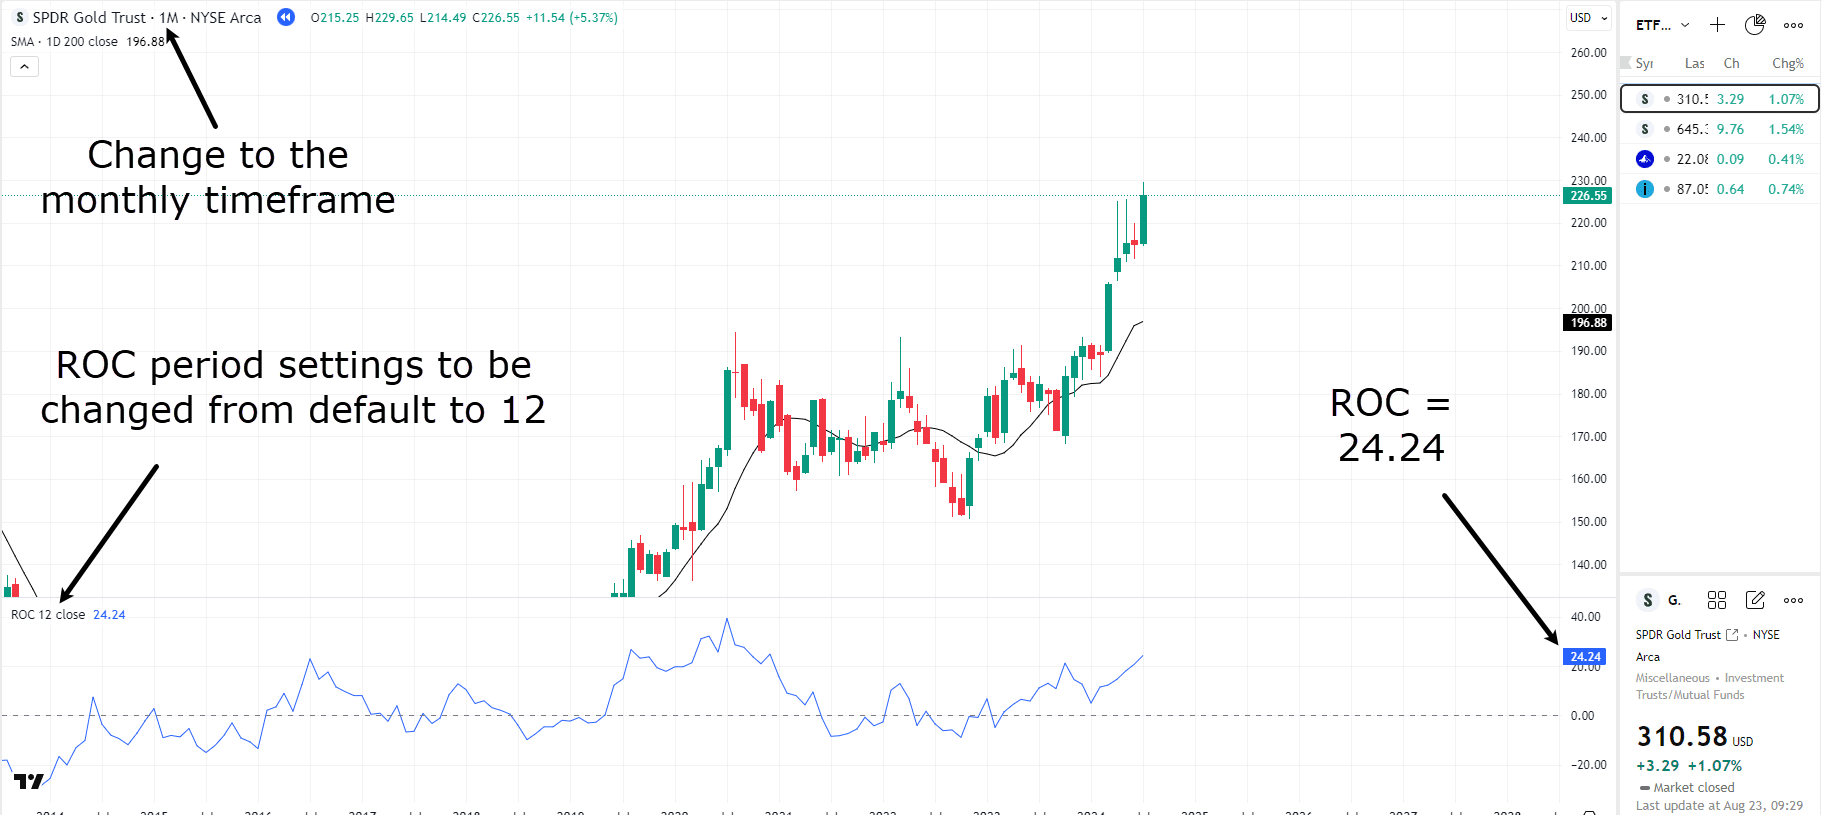
Using the chart above, you can see that the timeframe has been changed to monthly, the ROC period setting has been changed from its default of 9 to 12 to match the trading rules, and the ROC value sits at 24.24.
In this case, the bond ETF is below its 200 SMA and is disqualified. The other three ETFs are above their 200 SMA, so you would compare their ROC and select the top 2.
Your only routine is to repeat this process on the first trading day of each month, rebalancing your positions based on the results. That’s it.
Make sense?
Good, let’s take a look at how it’s performed over the years.
Momentum Trading System Performance
Despite how little time this system takes to manage, the results have been surprisingly strong, especially considering its defensive nature and low drawdowns.
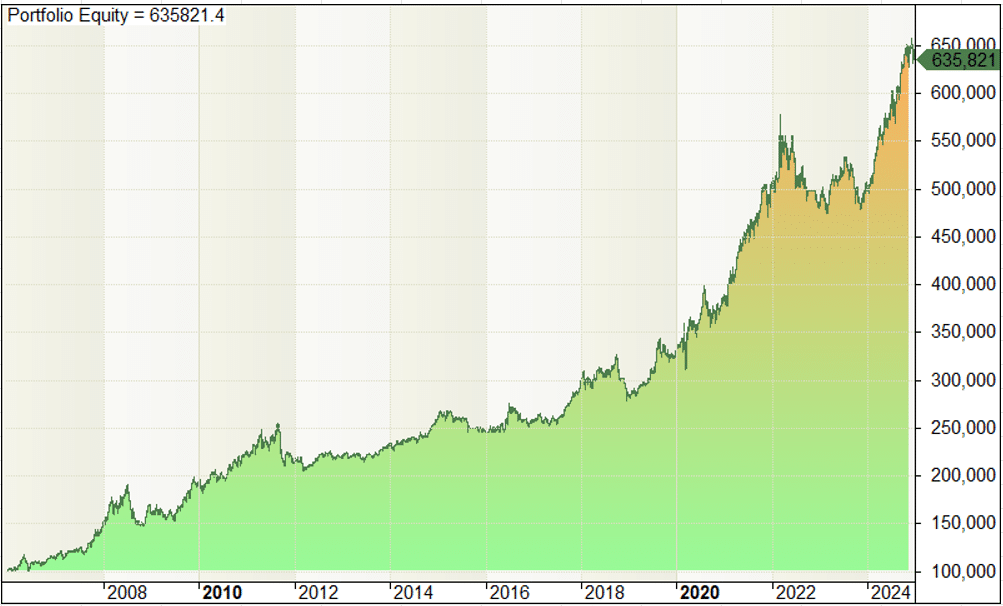
Portfolio Equity Momentum Strategy
Momentum Trading Strategy Results
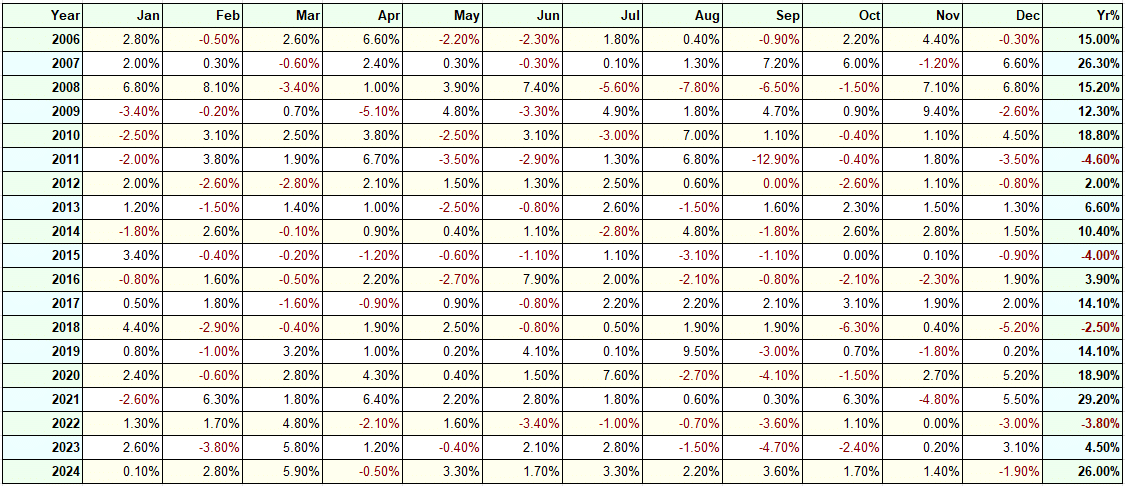
Here’s how it performed from 2006 onward:
Total return: 535 % (Since 2006)
Annual return: 10.22 %
Winning rate: 59.71 %
Payoff ratio: 1.13 (average profit/ average loss)
Maximum drawdown: 22.74 %
So, as you can see, the system wins a little more than half the time, and its average win is slightly larger than its average loss.
With only four ETFs and monthly rebalancing, the trade frequency is low, but the performance is consistent.
Because it can rotate into safe-haven assets like gold or bonds, it also tends to hold up well during market downturns. For example, it stayed positive during several major events, including the 2008 financial crisis and the COVID-19 crash in 2020.
It’s not going to blow the roof off with huge returns, but it gives you stability, diversification, and peace of mind, all while taking just a few minutes of effort each month. That’s a pretty good trade-off in my opinion.
With that in mind, let’s take a look at the pros and cons.
Pros and Cons of Momentum Trading
Let’s break down the key strengths and weaknesses of this momentum strategy.
Pros:
This system requires minimal time commitment. You only need to check and adjust your positions once a month, which makes it ideal for part-time traders or those with a busy schedule.
The returns are steady, and the system naturally diversifies across different market segments.
It also tends to perform well during periods of uncertainty or volatility, since it can rotate into safer assets when needed.
Cons:
The main drawback is that the returns are modest compared to more aggressive strategies.
You’re not going to see explosive growth here. This is a steady compounding system, not a get-rich-quick model.
Also, because you’re trading only four ETFs, there will be months where you take no action at all, which might feel too passive for traders who enjoy more activity.
However, that simplicity is also what makes it sustainable. You don’t need to guess, overanalyze, or time the market. Just follow the rules and let the system do the work.
Finally, let’s look at the final trading strategy, the Trend Following Strategy.
Trading Strategies #3: Futures Trend Following
The third and final strategy is something most retail traders rarely explore, but it’s one of the most powerful approaches used by hedge funds, professional money managers, and legendary traders like the Turtle Traders and Market Wizards.
It’s called trend following, and in this case, we’re applying it to futures markets.
Here’s how it works.
Rather than focusing only on stocks or ETFs, futures trend following allows you to trade a wide range of asset classes, currencies, commodities, metals, bonds, and profit from major price moves in either direction.
The goal is simple: ride big trends for as long as they last, whether the market is going up or down. You’re not looking to predict when a trend will start. You’re not trying to time the bottom or the top. You’re simply jumping on board once a clear trend is underway and staying in the trade until the market kicks you out.
This strategy is designed for those who want to be exposed to global markets and who understand that big money is made by capturing big moves, even if it means sitting through some volatility and holding trades for weeks or even months.
Let’s break down how it works.
Futures Trend Following System Rules
This trend following strategy trades a diversified group of global futures markets, including currencies, metals, agricultural commodities, and bonds.
Markets traded:
- Currencies: GBP/USD, USD/JPY, AUD/USD, EUR/USD, USD/CNH
- Metals: Gold, Copper, Silver, Palladium, Platinum
- Commodities: Coffee, Corn, Soybeans, Wheat, Euro-OAT
- Bonds: US T-Bond, 5-Year Note, German Bund, Long Gilt, Bobl
These markets provide a wide variety of opportunities across different asset classes and economic cycles.
Timeframe:
Daily
Risk management:
Each trade risks approximately 2 percent of the account size. The actual loss may vary slightly depending on slippage and how quickly the price moves when the stop is hit, but this serves as the general guideline.
Trading rules:
- Go long when the price closes at the highest level over the past 200 days.
This breakout signals the start of an uptrend. - Go short when the price closes at the lowest level over the past 200 days.
This breakout signals the start of a downtrend. - Use a 6 ATR trailing stop to manage the trade.
This allows you to stay in the position as long as the trend continues, and exit when volatility increases or the trend reverses.
That’s it. The rules are simple, but the strength of this system comes from its wide variety of markets and its ability to profit in both bull and bear environments.
By scanning many markets at once, you increase your odds of catching a big trend. And because you’re using a trailing stop, you’re giving your winners room to breathe, while cutting off losers automatically.
Let’s take a look at an example so you get the idea.
For this example, let’s use the Coffee CFD.
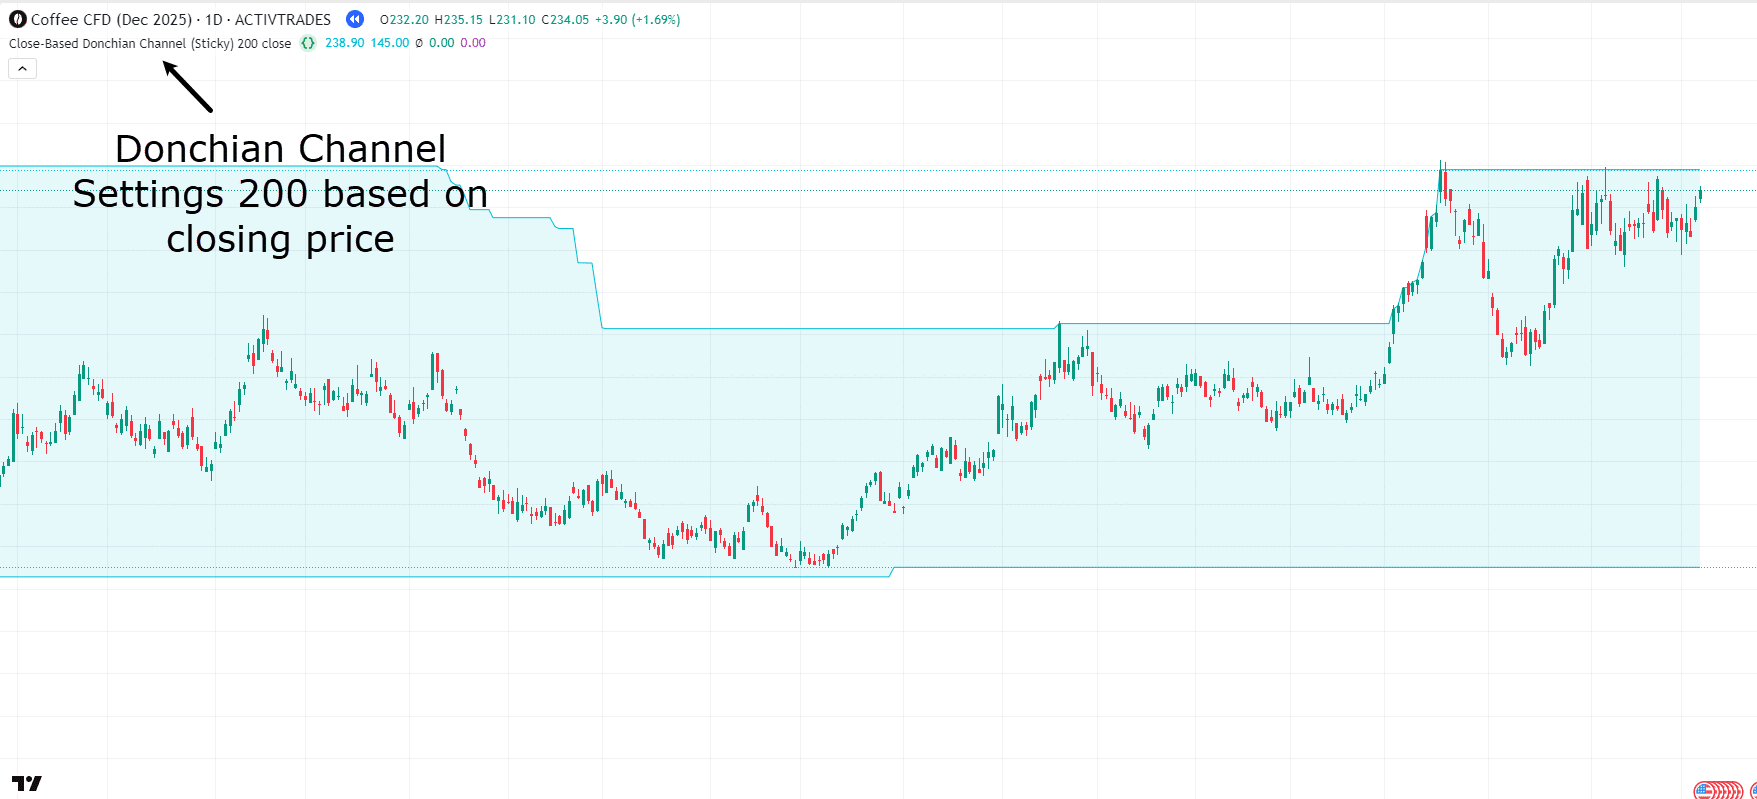
The first indicator you want to add to your chart on the daily timeframe is a Donchian Channel indicator that is based on the closing price of candles rather than the highs and lows of candles.
Simply search for any Donchian channel indicator that uses the closing price for its calculations, not the candle’s high and low…
Donchian Channel Indicator
Next, you want to wait till the price closes above the Donchian Channel…
Price formed a new high close
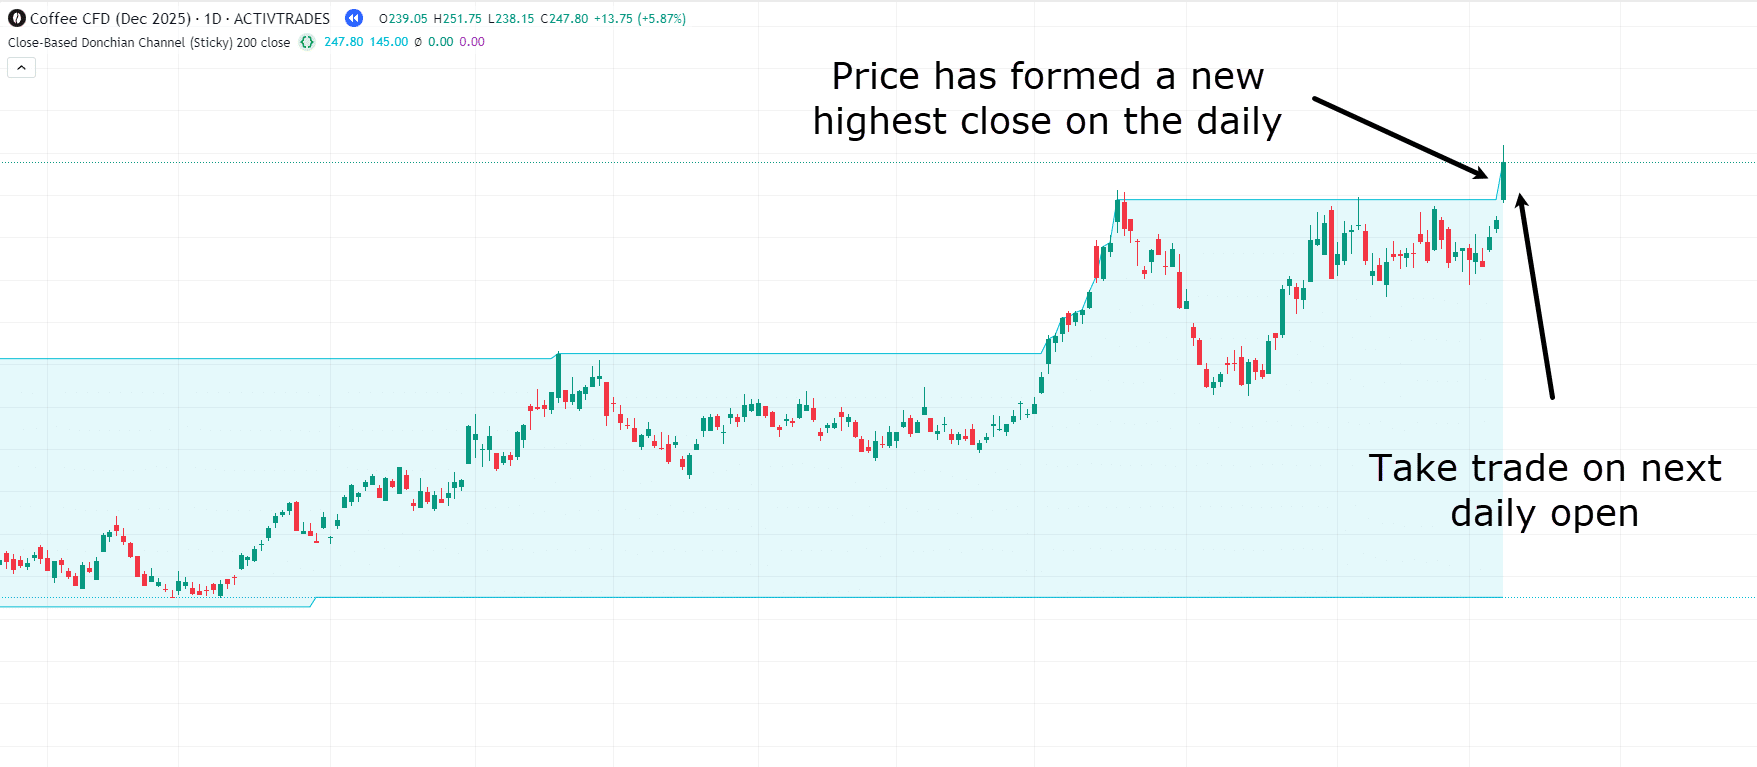
The next day, on the opening of the market, take a long position.
Great, so once you take the long position, you need a way of trailing your stop.
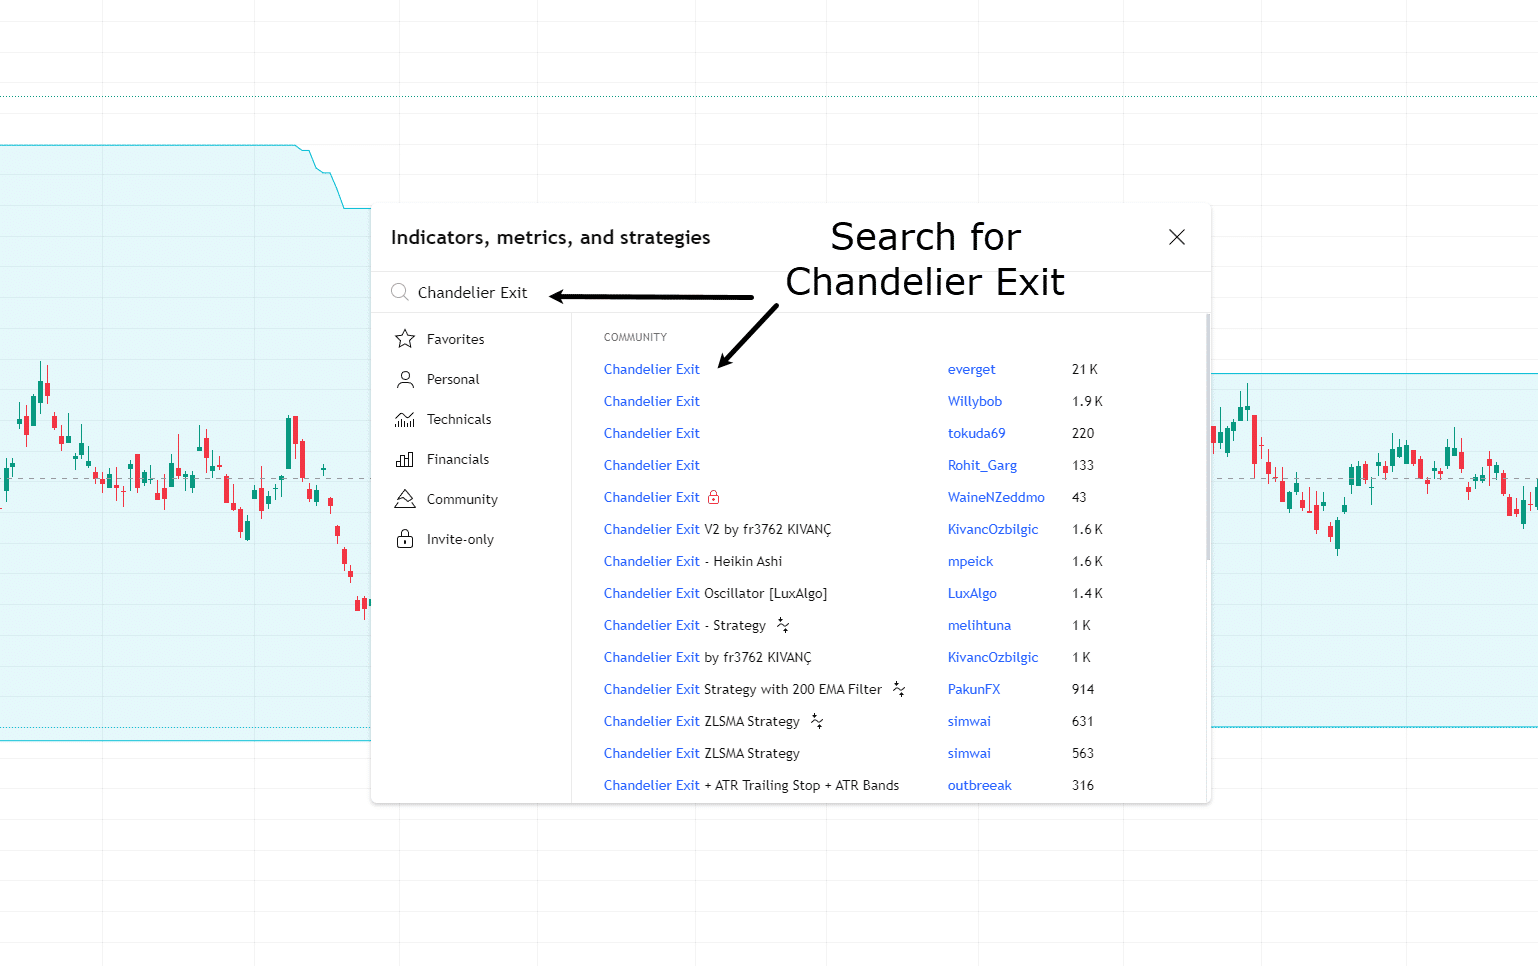
This is where I would recommend using the Chandelier Exit indicator…
Chandelier Exit Indicator
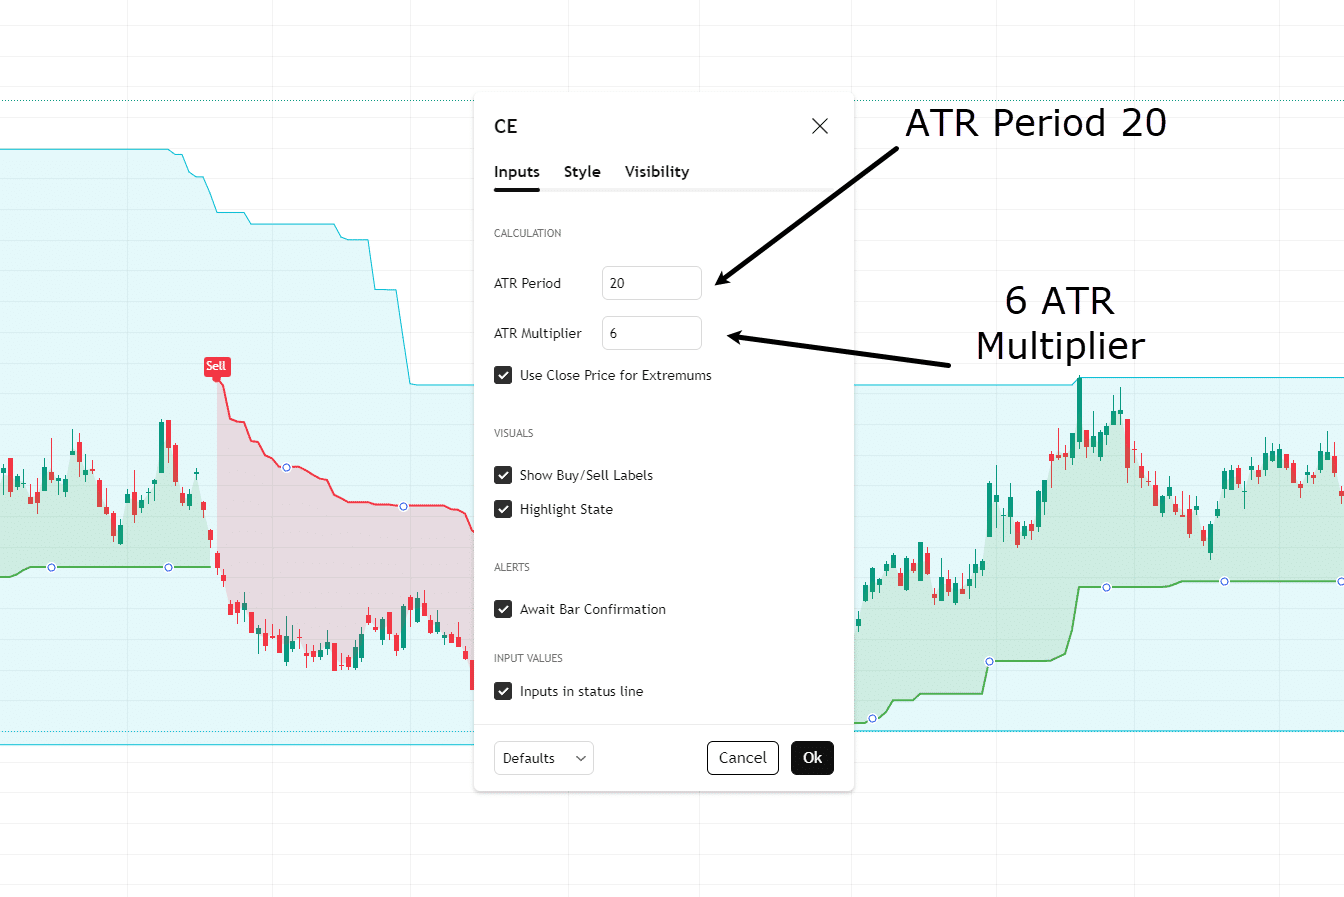
You’ll also need to change the default settings to the following:
ATR Period 20 and 6x ATR Multiplier…
Chandelier Exit Settings
Then simply continue to hold the trade through the trend until the ATR trailing stop is crossed.
Let’s take a look at what happened with the coffee trade…
Coffee Exit Trade
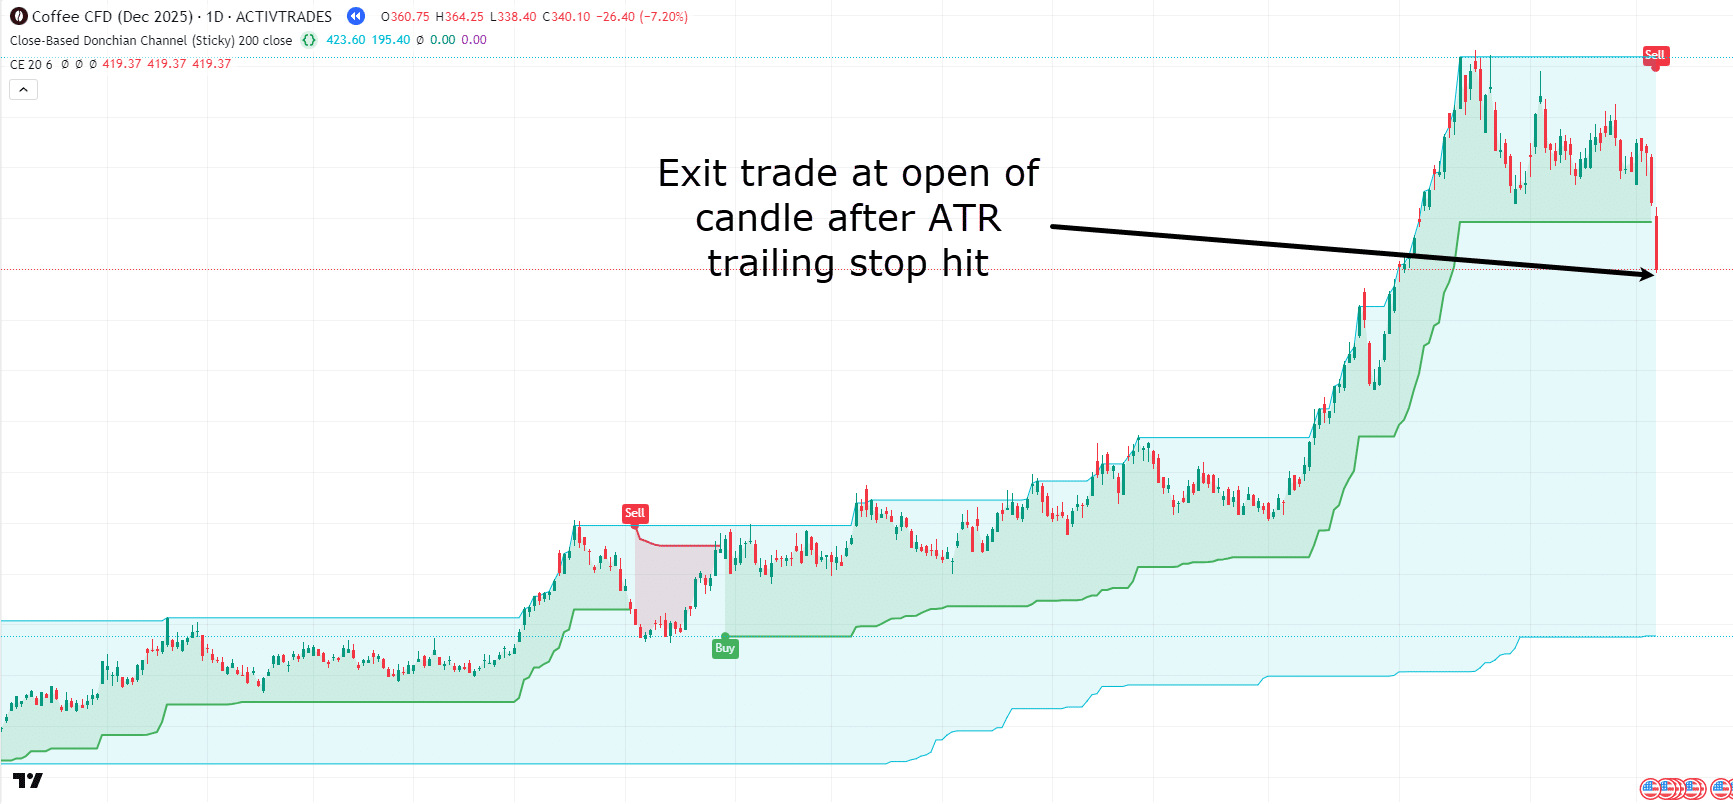
As you can see, price went on quite a run, although not without some pullbacks.
The power of this system is that it trails a safe enough distance to allow day-to-day noise within the market to occur without stopping you out.
After the price crosses below the trailing ATR, wait until the next daily open and close the trade.
Pretty simple, right?
So let’s look at its performance.
Futures Trend Following Performance
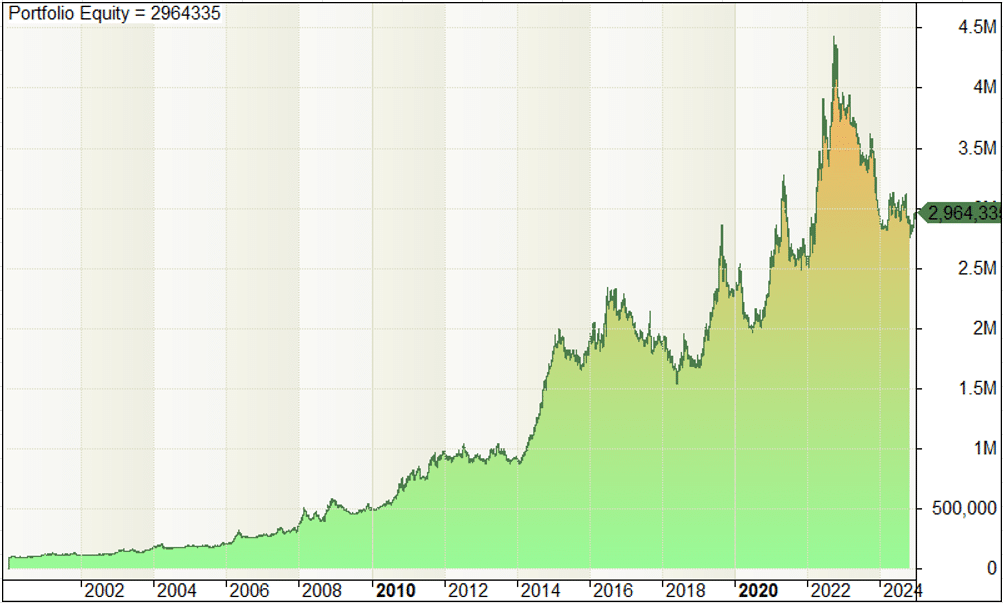
This trend following system has been tested using more than 25 years of historical data, covering multiple financial crises, market crashes, and bull markets.
Trend following Equity
Trend Following Trade Results
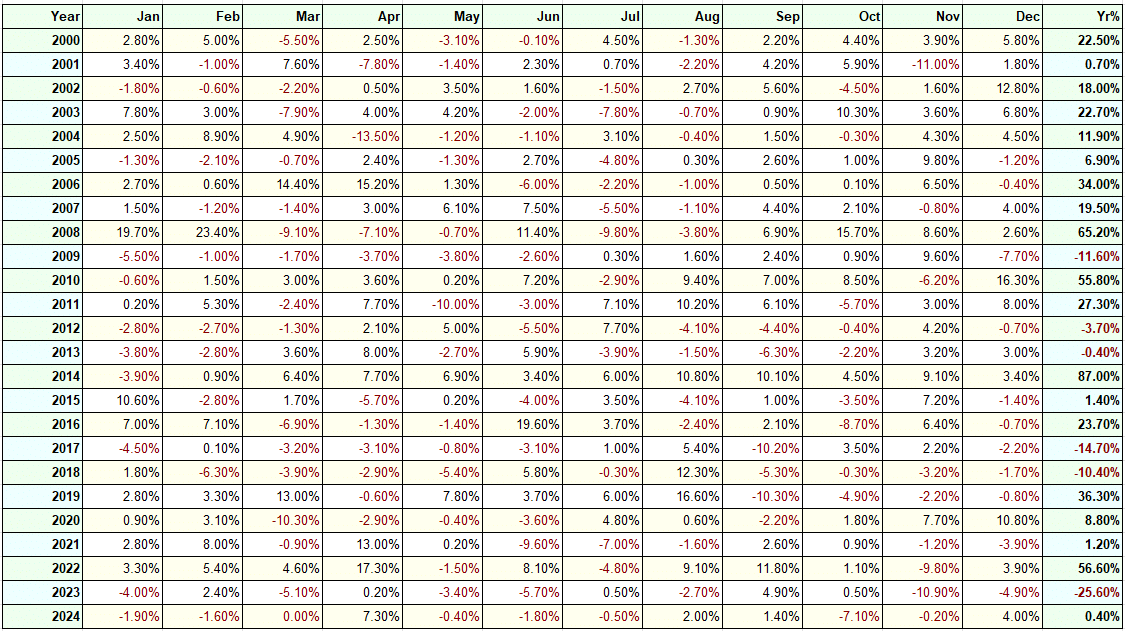
Here are the performance stats:
Total return: 2,864 %
Annual return: 14.51 %
Winning rate: 45.77 %
Payoff ratio: 1.74 (average profit/ average loss)
Maximum drawdown: 37.7 %
Unlike mean reversion or momentum, this strategy has a lower win rate, but a much higher reward-to-risk ratio.
When it wins, it often wins big, capturing long trends that can continue for weeks or even months.
It’s important to note that this strategy can experience long periods without much profit.
That’s normal. But when trends do appear, especially during market shocks or recessions, they tend to shine.
Some of its best years include 2008 (during the global financial crisis), 2020 (during the COVID crash), and 2022 (during the Russia-Ukraine conflict and inflation spike).
Pros and Cons
Let’s take a closer look at what makes trend following so powerful, and what makes it difficult for many traders to stick with it.
Strengths:
This strategy is not tied to the stock market. It performs independently of whether equities are going up or down. That makes it an excellent diversifier, especially during bear markets or recessions when traditional portfolios suffer.
Trend following also gives you exposure to a wide range of global assets, helping you benefit from major macroeconomic trends. And when it works, it can deliver large gains from just a handful of big trades.
Weaknesses:
The low win rate can be tough to handle emotionally. More than half of your trades will be losses, sometimes many in a row. That means you need patience, discipline, and trust in the system.
The drawdowns can also be deep and long-lasting. A 30 to 40 percent drawdown is not unusual in this style of trading, and that can be difficult for newer traders to sit through.
Finally, futures trading typically requires a larger account size and more advanced execution compared to stock or ETF systems.
That said, for traders who can stay the course, trend following offers the rare ability to profit during extreme market conditions when other strategies break down.
The Holy Grail: Combining Strategies
By now, you’ve learned three powerful trading strategies: mean reversion, momentum, and futures trend following.
Each of them is backed by data, tested across decades, and proven to work in the real world.
But here’s something most traders don’t realise.
While each of these strategies performs well on its own, the real power comes when you combine them.
This is what I like to call the “Holy Grail” of trading, not because it’s flashy or perfect, but because it solves one of the biggest problems every trader faces: inconsistency.
Let me explain.
Why combining strategies works
Every strategy has strengths and weaknesses. Mean reversion works great in choppy markets but struggles during strong trends. Momentum is easy to manage, but it doesn’t always capture explosive moves.
Trend following shines during market crashes but can experience long dry spells.
On their own, each system has gaps. But when you combine them, those gaps start to close.
Think of it like building a balanced team.
- When mean reversion is having a tough year, momentum or trend following might be thriving.
- When trend following is going through a long drawdown, mean reversion could be producing consistent winners.
- When momentum is stuck in sideways markets, the other systems can step in and carry the load.
The result?
More stable returns, fewer losing years, and a smoother equity curve.
What the data shows
Let’s look at an example.
Earlier, I covered the performance of the mean reversion and momentum systems. Both are solid on their own, but each has had a few losing years.
Combined Strategy Example
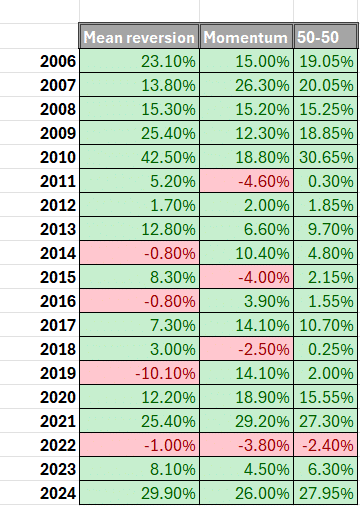
Now imagine splitting your capital 50/50 between those two strategies. Half of your account trades mean reversion setups. The other half runs the monthly momentum system.
When you combine them like this, the results improve dramatically.
In backtesting, this combined approach produced profits in nearly every year, with just one small losing year of 2.4 percent.
That’s a massive improvement over trading either system in isolation, giving you a much more consistent result.
And the reason is simple.
The two strategies operate on different timeframes, different instruments, and different logic. One buys weakness in individual stocks. The other ride strength in ETFs. Their signals rarely overlap, which makes them the perfect complement.
If you layer in trend following on top of that, you gain exposure to global macro trends and the ability to profit during recessions or stock market crashes, times when both stock and ETF strategies might struggle.
Now, instead of relying on one strategy to carry your portfolio, you’re spreading the load across multiple edges, each designed for different market conditions.
See how this technique can actively support each system in any market?
This is how professional traders think. They don’t bet everything on a single edge, they stack multiple edges together. This approach leads to some common questions, so let’s get them answered.
Frequently Asked Questions (FAQs)
How much capital do I need to get started?
This depends on which strategy you want to trade.
For the mean reversion and momentum systems, you can get started with a relatively small account, around $3,000 to $4,000. These strategies don’t require leverage and are designed to work with stocks and ETFs, which makes them accessible to most traders.
However, the trend following system trades futures contracts. These typically require a larger account to manage position sizes and handle volatility.
To run this system comfortably, you’ll want at least $20,000, especially if you’re trading multiple markets. That said, it’s possible to replicate similar logic using CFDs or ETFs with smaller capital, just be aware of the differences in cost, margin, and execution.
Bottom line:
Start where you are. If you’re new, begin with mean reversion or momentum. As your capital grows, you can look at layering in trend following to diversify your edge.
Can these strategies be used in other markets?
Yes, but with caution.
All the strategies I shared in this article were built and tested on specific markets.
For example, the mean reversion system is designed for large-cap US stocks in the Russell 1000 index. The momentum system is based on ETFs. The trend following system is built around global futures.
If you want to apply these same strategies to forex, crypto, or international stocks, you’ll need to retest and validate the system in that new environment.
Different markets have different behaviors. What works in US equities may not translate directly to forex or crypto, which are more volatile and less mean-reverting. Likewise, emerging market stocks or illiquid instruments may not follow the same patterns.
That’s why backtesting is so important.
Take the concept, apply it to your chosen market, and run the data. That’s the only way to know if a strategy is robust across multiple environments.
What’s the difference between momentum and trend following?
They may sound similar, but there are some key differences, especially in how they operate and how trades are managed.
Momentum: Looks for strength in markets and enters based on relative performance. It’s long-only and rotates monthly based on which ETFs are performing best. Trades are exited when momentum stalls or the ranking changes.
Trend following: Enters breakouts in price, either to the upside or downside, and uses a trailing stop to stay in the trade as long as the trend continues. It goes both long and short, and exits only when the price closes against the trend far enough to trigger the trailing stop.
In simple terms:
Momentum = Buy strong markets, exit when they slow down, even if the trend is intact
Trend following = Buy breakouts, ride the wave until it ends.
Isn’t it risky to trade mean reversion without a stop loss?
This is one of the most common concerns, and it’s a valid question. On the surface, it might seem risky to buy a falling stock without using a hard stop, but let’s look deeper.
First, it’s important to understand that the mean reversion system does not use leverage. Each trade is a fixed-dollar amount, and there’s no margin involved. So you’re never risking more than your capital allows.
Second, the system only trades stocks that are in a long-term uptrend, defined by the 200-day moving average. That alone filters out most weak or crashing stocks. You’re not buying penny stocks or failing companies, you’re buying temporary pullbacks in strong names.
Third, there actually is a stop loss in the system, it’s just not a price-based stop. Instead, it uses a time-based exit. If the trade doesn’t bounce within 10 trading days, it’s closed regardless of price. In practice, this prevents you from holding onto losers indefinitely.
And lastly, let’s be honest, the idea that a large-cap stock in the Russell 1000 will suddenly go to zero within 10 days while in an uptrend is extremely rare. In over 25 years of backtesting, that scenario never occurred in the system’s results.
So no, this is not reckless trading. It’s a system that balances risk through filters, position sizing, and time-based exits, rather than relying on tight stop losses that often get triggered unnecessarily.
Conclusion
By now, you’ve seen what goes into a trading strategy that actually works.
Not some magic indicator. Not a one-time setup you saw on a forum. But real systems, backed by data, tested across decades, and used in live trading.
I covered three key approaches:
- Mean reversion, where you profit from snapbacks in strong uptrending stocks
- Momentum, where you ride the strongest-performing ETFs with just a few minutes of effort each month
- Trend following, where you capture major moves across global markets and profit in bull and bear cycles
Each strategy has its own strengths and weaknesses, but when you put them together, that’s where the real edge forms.
You don’t need to be right all the time.
You don’t need to predict the next crash or the next rally.
You just need a set of rules, proper risk management, and the consistency to follow through, even when the market tests your patience.
That’s what separates those who dabble from those who actually succeed in the long run.
If you’re serious about trading, these three strategies are a great place to start or reset your approach.
Whether you adopt one or all of them, what matters most is that you stick to your process, measure your results, and always stay focused on the long game.
There’s no holy grail setup.
But a structured system, tested over time, and applied with discipline?
That’s as close as it gets.
So, now that you’ve reached the end of this guide…
What are your thoughts?
Do you plan to use some of the trading strategies I shared with you today?
If so, how do you plan to modify it?
Let me know your thoughts in the comments below!