This is a currency pair that many traders neglect. But as a Trend Follower, we trade all markets because we never know when a trend may be emerging.
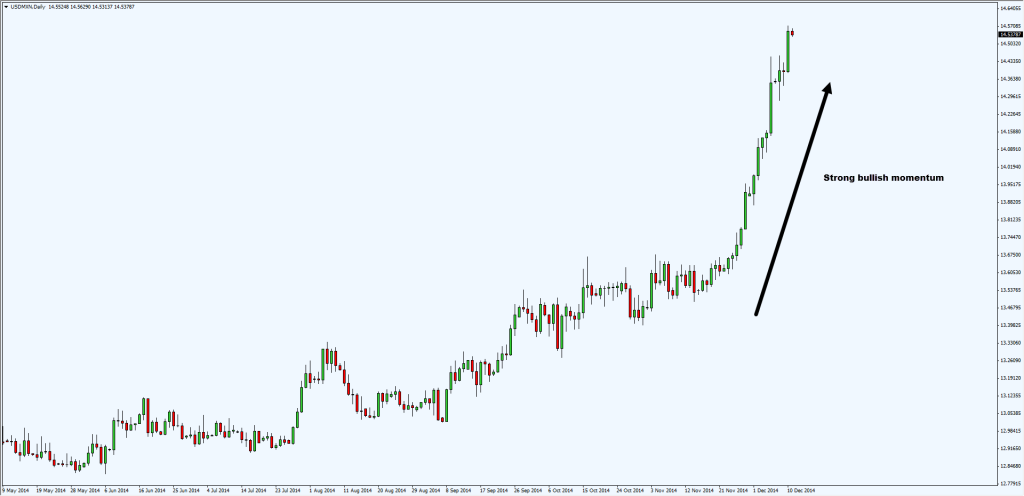
Daily USDMXN Chart:
On Daily, we see strong bullish momentum towards the upside that started in November.
However, it’s hard to identify historical patterns to exploit as the price is compressed into daily candles.
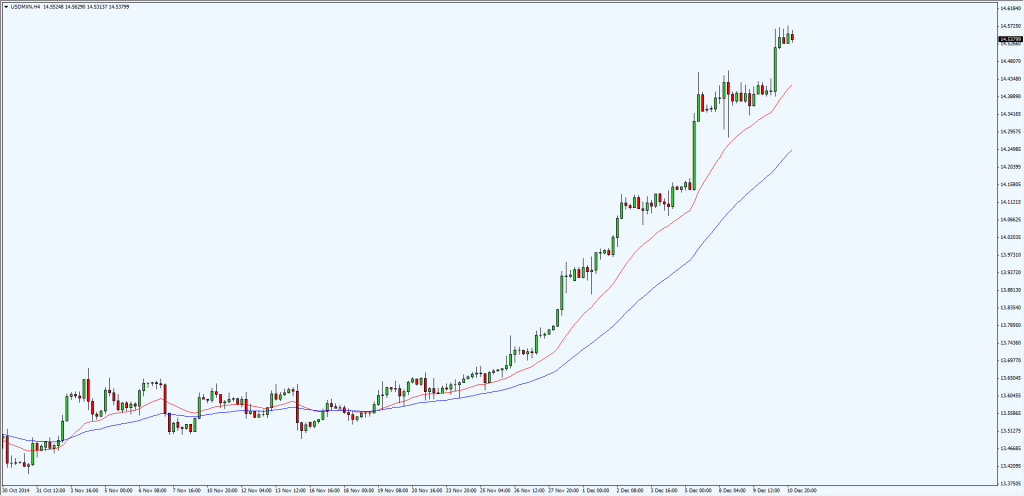
4 Hours USDMXN Chart:
On 4 hours we see price tend to have shallow pullbacks towards the 20 EMA before rallying higher.
Traders can look too long on pullback or trade breakout towards the upside.
Good Trading!


Hi Rayner. The price has broken out from the 20EMA. Is this trend now invalid? Thanks
Hi Benjamin,
I wouldn’t conclude the trend is invalid, but rather showing signs of weakness.
Rayner
Hi Rayer,
Does that mean you will ignore support and resistance levels in your trading strategy ?
Hi Rayer,
Does that mean you will ignore support and resistance levels in your trading strategy ? Or am I wrong ?
Hi Bob,
I will ignore resistance in uptrend and support in downtrend.
Other than that, i will pay attention to them.
Rayner
Hi Rayner,
Do you mean you will pay attention to them in a sideway movement, to buy from support and sell from resistance. But ignore them when market is trending strongly ?
I don’t trade range markets.
When market is in uptrend, i will pay attention to support and ignore resistance.
Hope that helps!
Hi Rayer,
Are you saying that if prices revert to support after uptrend, it may mean the uptrend momentum is weakening and we must be prepared for a reversal where price breakthrough downwards later ?
If price is in an uptrend, support are areas whereby i will look to get long.
Hi Rayer,
Thanks for your swift response. What I know is you mentioned using ATR to calculate stop loss, may I know the rationale behind it ?
You may want to check this video out if you haven’t.
I use ATR because it’s a volatility measure for my stops.
Rayner
Hi Rayer,
I always have issue with multiple time-frame analysis e.g must Monthly, Weekly and Daily time-frames be in uptrend for me to execute a buy setup and vice-versa for download ? What is your approach for that ?