Hey hey, what’s up, my friend!
In today’s training, I’ll share a trading strategy with an 88.89% winning rate.
A simple Trading Strategy with a Winning rate of 88.89%
I’ll give you the following:
- Exact trading rules
- The performance matrix of this strategy
- Examples
- And much more
Are you excited?
Then let’s get started.
So first…
What is the strategy with a winning rate of 88.89%, and how does it work?
The core idea behind this trading strategy is that it’s a pullback stock trading strategy.
Why not a breakout, you may ask?
Because in the long run, the stock market is in a long-term uptrend as it tracks what the economy is doing.
The US Stock Market has been in a long-term uptrend since the 1900s because the US economy back in the 1900s compared to today has improved!
It’s the same thing for other stock markets in other parts of the world.
But here’s the thing…
Just because a market is in a long-term uptrend doesn’t mean it goes up in one straight line.
What do I mean?
In the short run, prices could go below their valuation because of panic selling and profit-taking.
These are often called “corrections.”
As pullback traders, we can take advantage of it.
Makes sense?
Let’s now go to the meat of this training guide…
The rules
These are the rules right of this trading strategy…
Market: S&P 500
If you want to, you can test it on the Russell 1000, Nasdaq 1000, or your local stock market.
I’ll leave it up to you.
But for this strategy, we’ll be testing it on the S&P500 stock universe.
Define the trend: S&P 500 is above the 200-day Moving Average
We want to be trading when the overall market is in an uptrend.
So our way to define the trend is that the S&P 500 must be above the 200-day moving average.
If the S&P 500 is above it, we have permission right to trade.
We sell everything and remain in cash if the S&P 500 is below it.
Entry: 10-period RSI is below 30 (buy on the next day’s open)
The entry is also otherwise known as defining the depth of the pullback.
How do we accomplish this objectively?
Well, we want the 10-period RSI to be below 30.
Once it’s below 30, we’ll enter the stock at the market open using a market order.
Are you still following?
Good.
Exit: 10-period RSI is above 40, or after ten trading days (sell on the next day’s open)
Our exit method is very straightforward.
We are looking to exit when the 10-period RSI has crossed above 40 or after ten trading days.
Why after ten trading days?
Why not just wait for the price to cross the RSI 40?
It’s because the 10-period RSI can be below 40 for several days or weeks, especially during a recession.
So, we wouldn’t want to stay on the trade for too long to focus on trading better stocks out there.
Make sense?
Now let’s have a look at a few examples
Examples
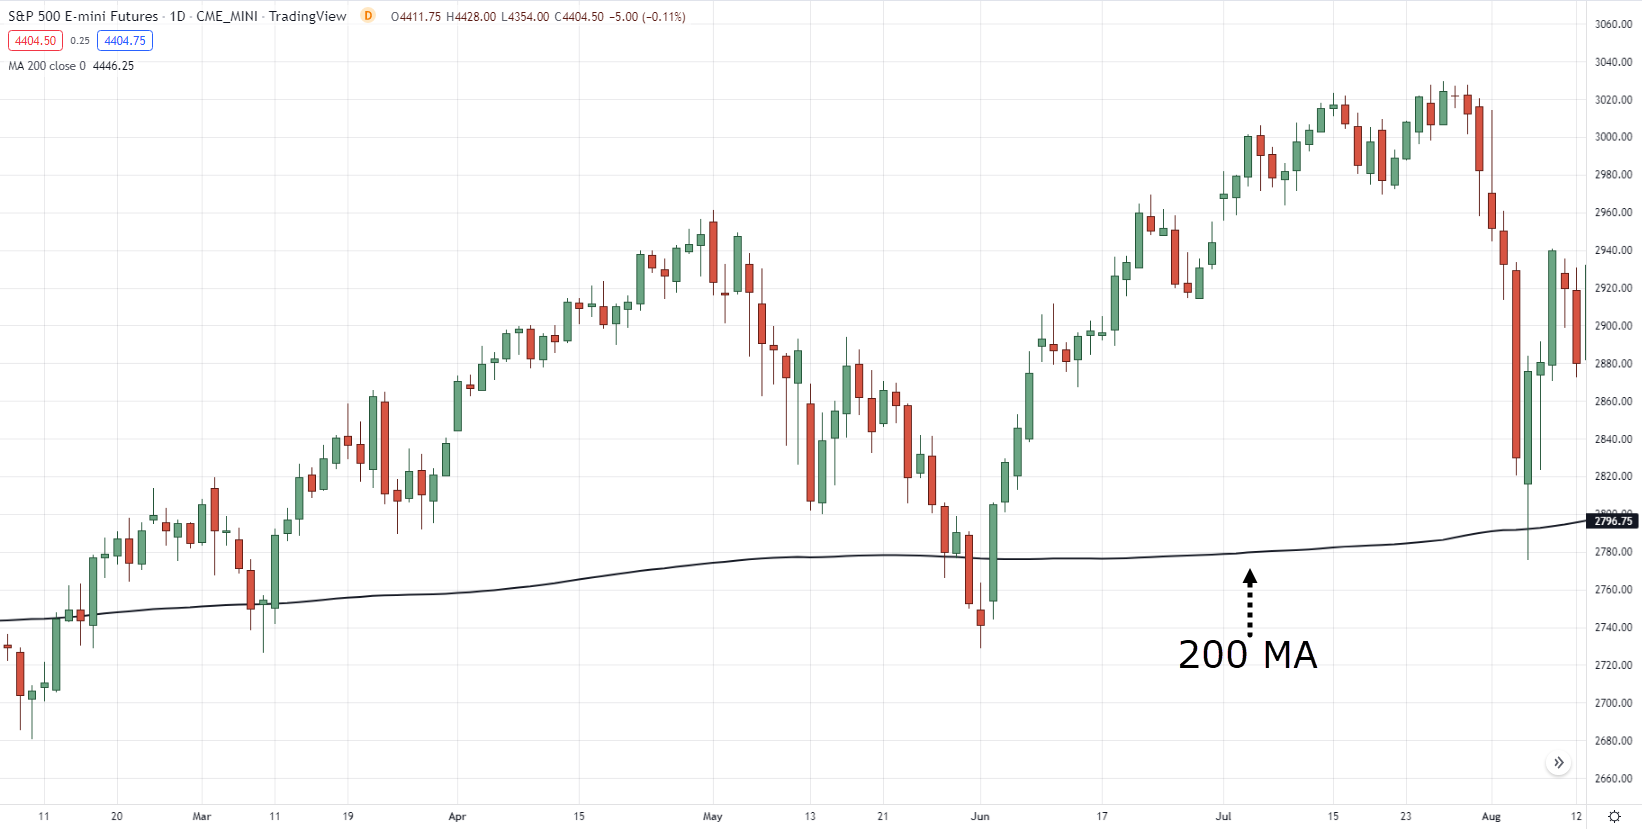
if you look at this chart on the S&P 500:
It’s above the 200-period moving average.
First criteria?
Check.
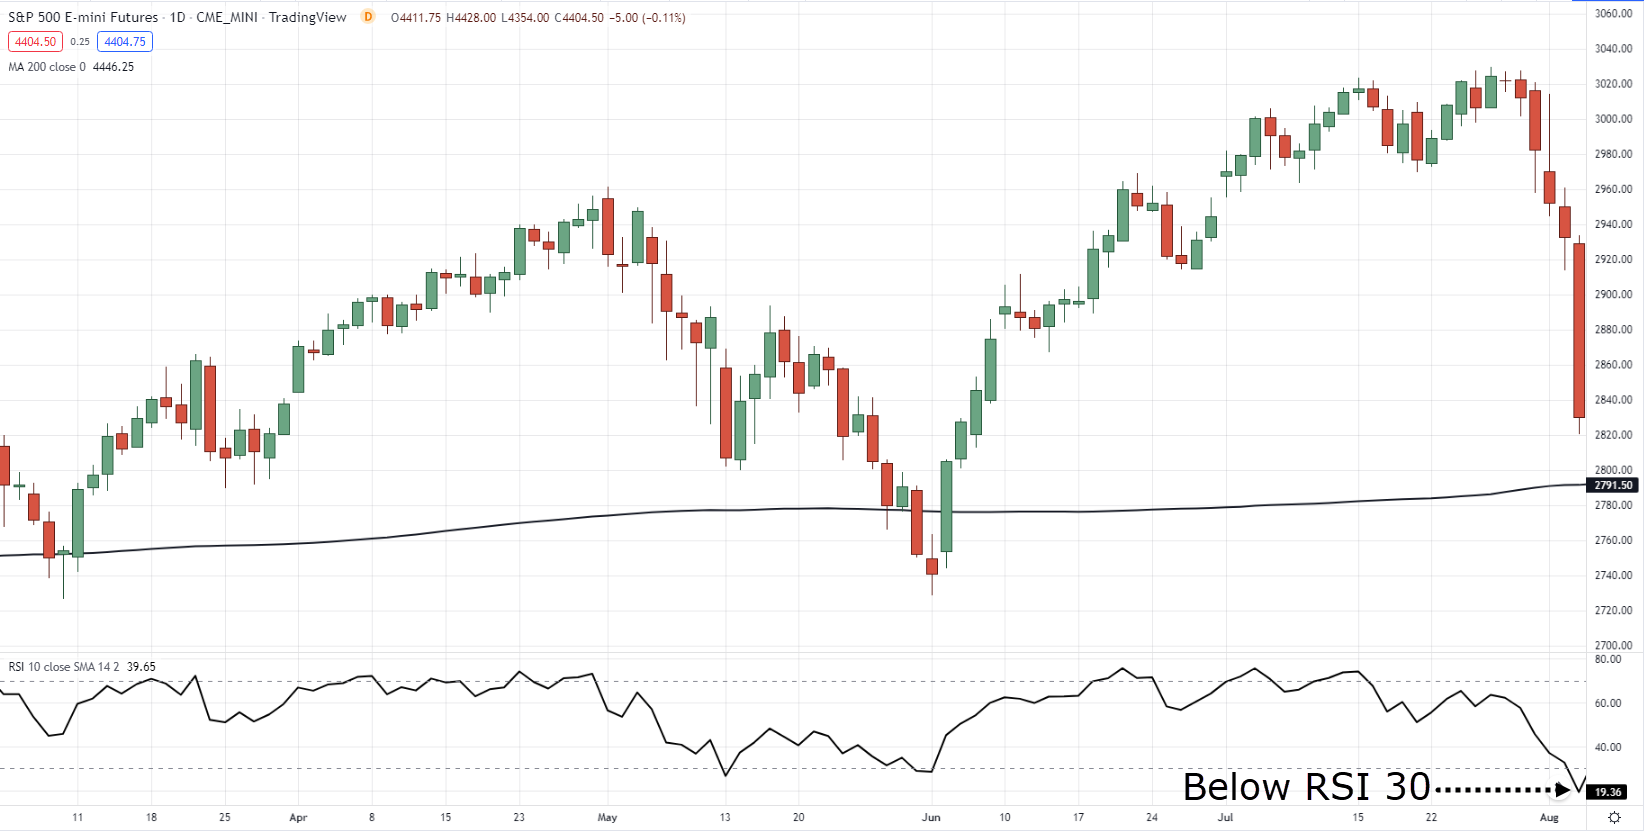
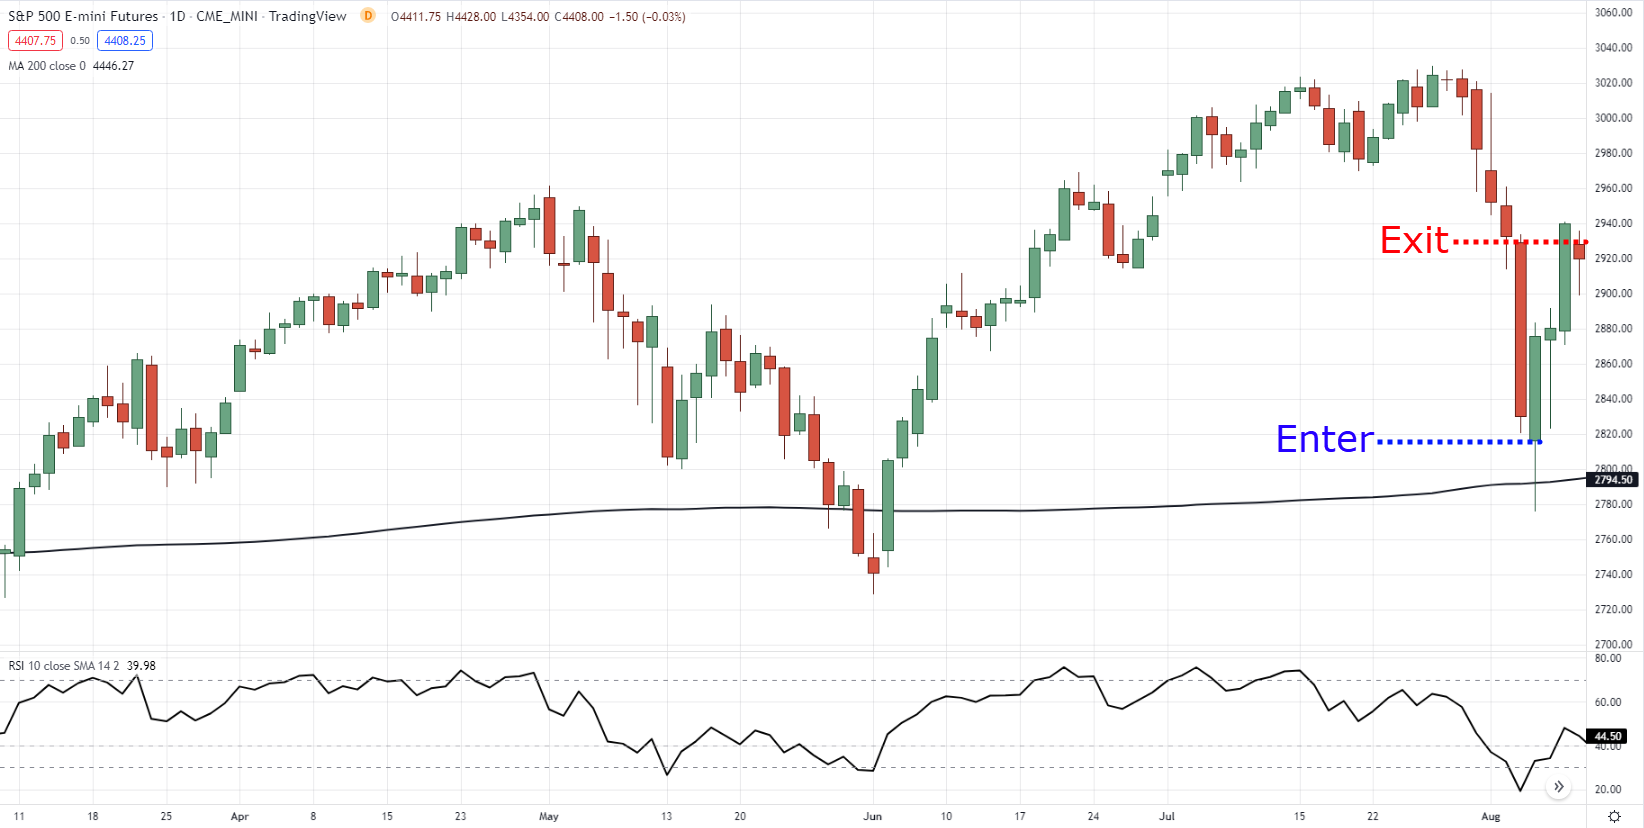
Second, we need the 10-period RSI to go below 30.
As you can see, right now, the RSI value is below 30:
This has met our second criteria because if you recall…
The 10-period RSI must be below 30.
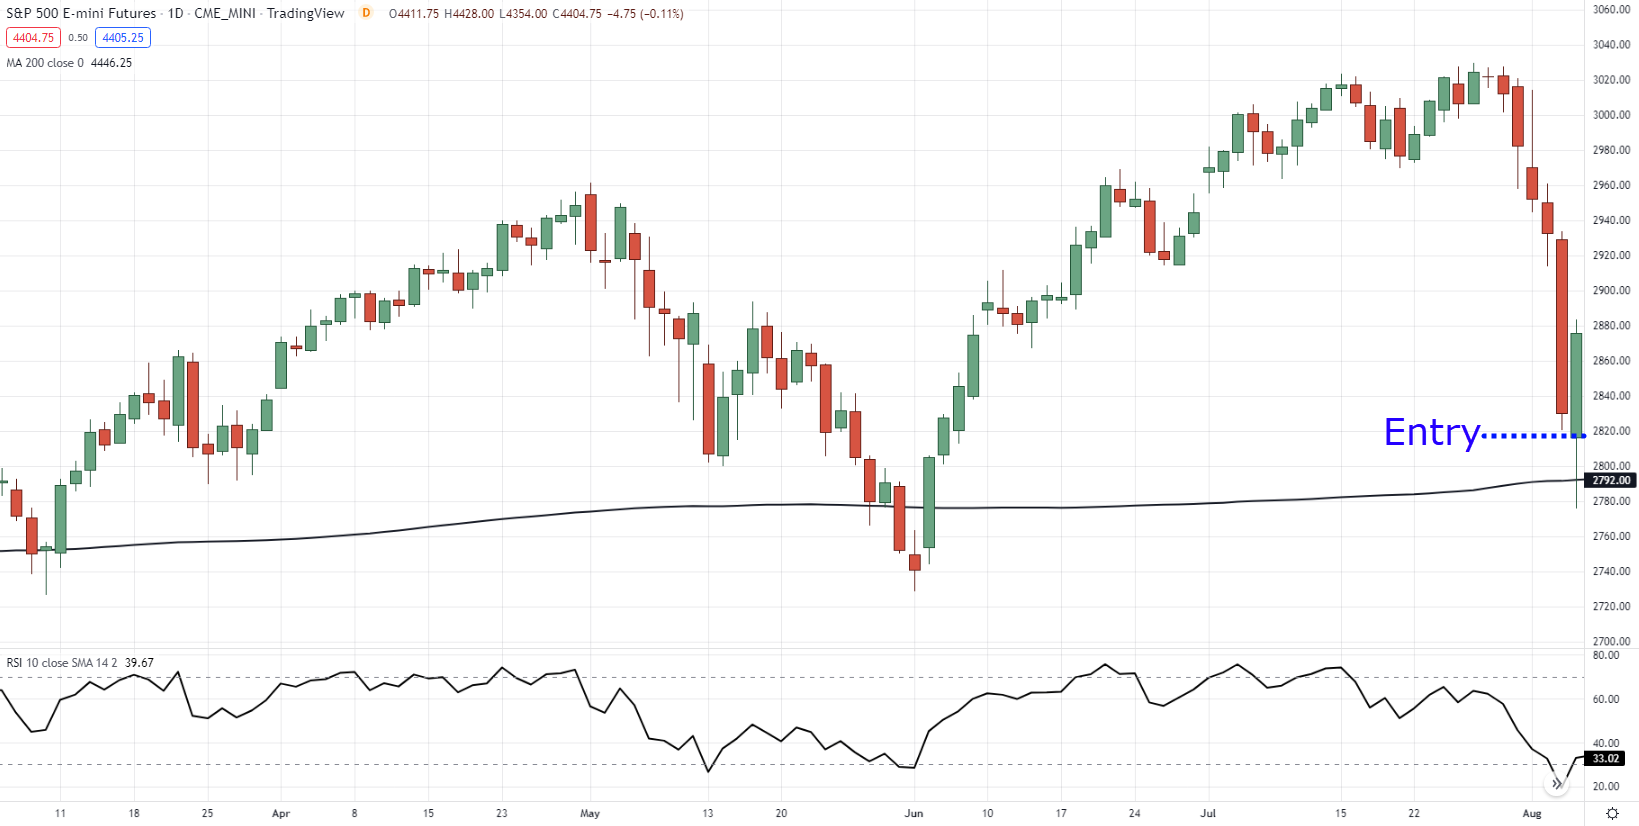
So, when the market closes today…
Our second criteria have been met, and we are going to enter on the next day’s open:
Third criteria?
Check.
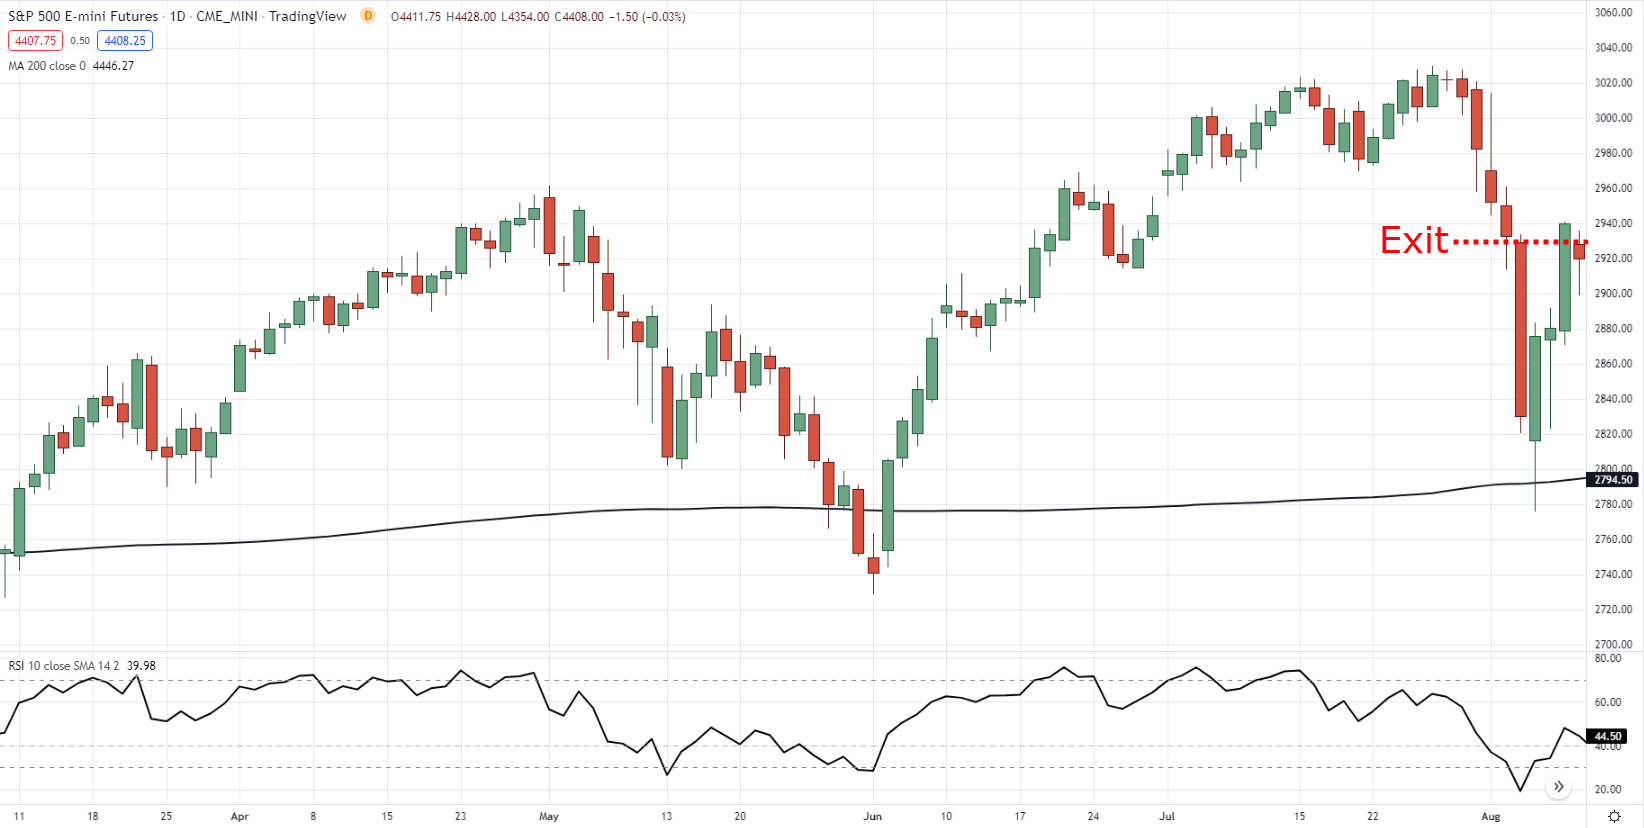
So now, how about the exit criteria?
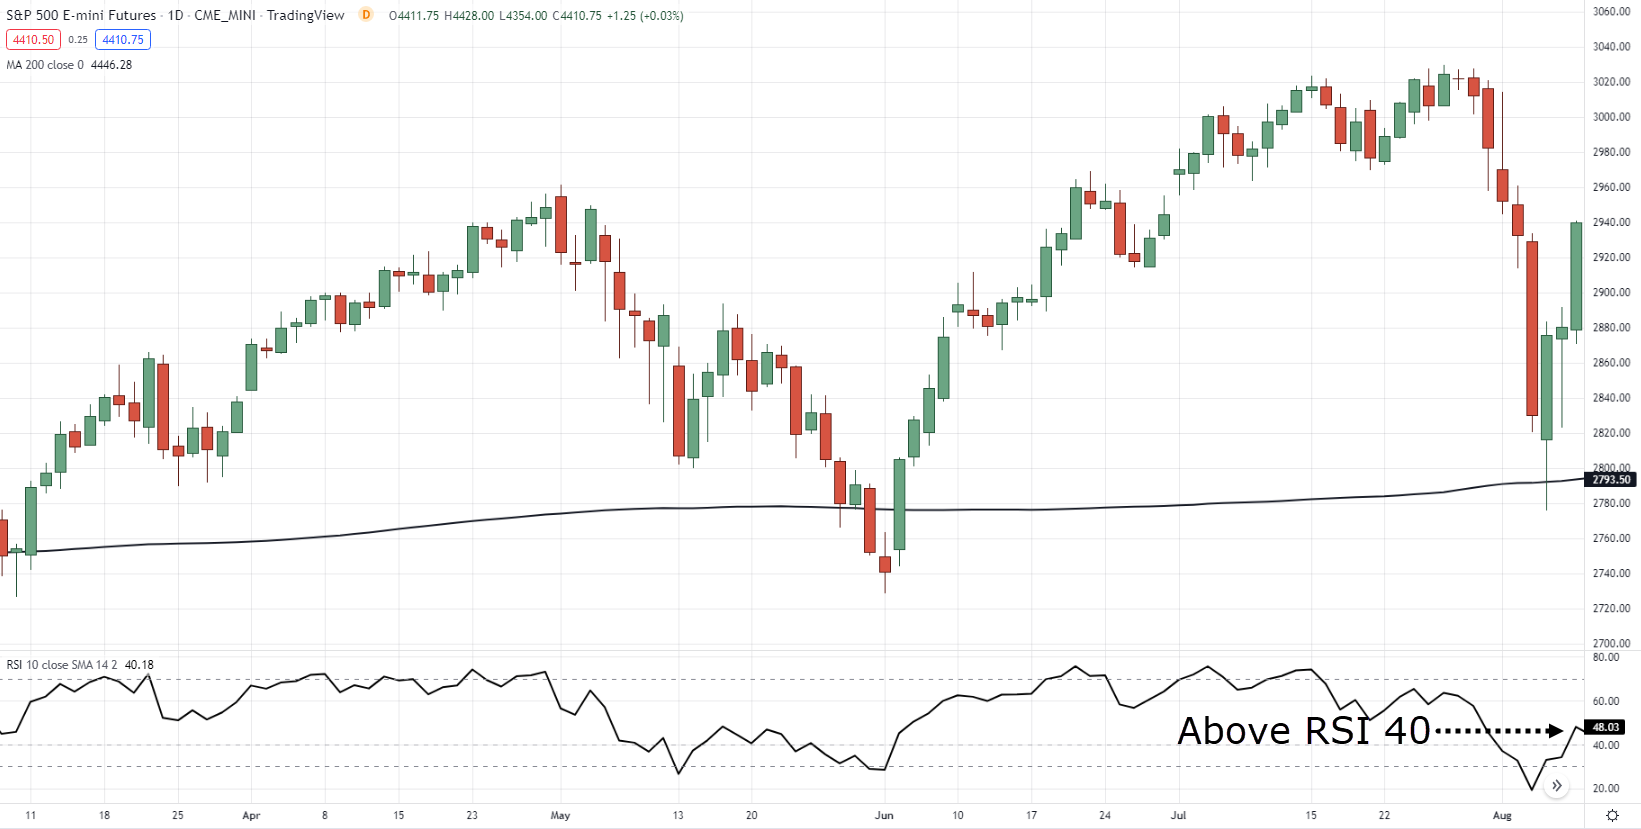
Recall, it’s when the 10-period RSI crosses above 40 or after ten trading days.
As you can see in the next two days…
The RSI has crossed above 40.
What should we do next?
Exit on the following day open:
So to put things in perspective, this is where you would’ve entered and exited the trade.
Simple, right?
This is pretty much how this trading strategy works!
I know this is just a simple chart example, so let me share with you the results on how this trading strategy has performed over the past 24 years…
Results (1996 – 2019)
- Number of trades: 36
- Winning rate: 88.89%
- Annual return: 2.13%
- Average gain: 1.43%
- Average loss: -0.87%
Overall, this is something that will give you an edge in the markets.
However, there is a downside to this, and I’ll explain this shortly…
How can you apply it to your trading?
Here’s how…
Look for buying opportunities after a strong pullback – avoid shorting
Whenever the price is above the 200-period moving average, your thought process would be:
“Where can I look for buying opportunities.”
In today’s guide, you’ve learned that we can catch pullbacks when the 10-period RSI is below 30.
But if you’re a discretionary trader…
You can use tools such as candlestick patterns or trendlines to help you better time your entries.
One thing to point out is that…
You want to avoid shorting the stock market
I know it’s tempting, but here’s the thing…
Based on historical testing, the price tends to reverse back up higher more often than not.
So as much as possible, you want to avoid shorting the stock markets, especially if it’s still above the 200-day moving average.
Got it?
But if you still want to short the stock markets, I won’t stop you.
Now, as mentioned earlier…
The downside to this trading system is there aren’t many trading opportunities.
You noticed, right?
Only 36 trading opportunities over the last 24 years, what?!
So, what can you do to have more trading opportunities?
Apply the strategy to different types of market
For example, you can also use this system to trade Exchange Traded Funds (ETFs), the Russell 1000, Russell 3000, and the NASDAQ 100 index to get more trading opportunities.
You can also trade individual stocks in the S&P 500.
This will give you more trading opportunities to exploit this inefficiency or pattern in the stock market.
That’s pretty much it!
Now over to you…
Will you consider trading this trading strategy?
Perhaps you’ll make some modifications and improvements to it?
Let me know in the comments section below!


The strategy is simple and sounds good but isn’t 2.13% return on annual basis too low?
I agree and I’m waiting on answer
Surely I will apply to Indian Nifty50 Various stock