
This post is written by Jet Toyco, a trader and trading coach.
Here’s the truth…
The Fibonacci retracement is one of the most popular trading tools out there.
At the same time…
It’s also one of the most debated ones.
It makes people wonder:
Does the Fibonacci retracement work?
Does it have an edge in the markets?
Should I even keep on using it?
You see my friend…
What makes a good swordsman is not his sword.
But the skill he has to wield the sword.
It’s the same for trading tools such as plotting support and resistance

Plotting trend lines.

And finally, drawing Fibonacci retracements.

So, the question now is…
How do you draw a Fibonacci retracement?
Do we start plotting by including the wick?

Or do we plot from the body?

Well, believe me…
The answer isn’t as simple as it seems as we’re only looking at the tip of the iceberg here.
This is why in this guide you’ll learn:
- An in-depth but quick explanation as to how the Fibonacci is applied in trading
- What you should NOT do drawing the Fibonacci retracement
- A fool-proof and step-by-step guide on plotting the Fibonacci retracement
That’s right.
You’ll be getting the whole package here.
So, get your notes up, and let’s get started!
What is Fibonacci Retracement and How Does It Work?
In case you didn’t know…
The Fibonacci levels you see on your chart are not the Fibonacci sequence itself.
You might be thinking:
“Wait what?”
“So, where did those numbers come from?”
Good.
You’re asking the right questions!
So, let me tell you where those numbers come from.
Now, the original Fibonacci sequence is as follows:
1, 1, 2, 3, 5, 8, 13, 21, 34, 55, 89, 144, 233, 377
Again.
How the heck did those numbers come into place?
You’d be surprised, basic math!

See?
It’s pretty much just a mathematical “sequence” where you add the previous number to get the next one!
But as simple as it is…
The Fibonacci is all over nature!
From architecture…

To animals…

Even to humans!

Alright, we’re getting side-tracked here…
So!
How does it apply to trading?
How in the world did we freaking get these Fibonacci ratios in trading?
23.6%, 38.2%, 50%, 61.8%, 88.6%
So, remember how we get the next number in the Fibonacci sequence by adding the previous one?
1, 1, 2, 3, 5, 8, 13, 21, 34, 55, 89, 144, 233, 377
In this case, we’re using this same Fibonacci sequence to divide them so that we can get the Fibonacci “ratio.”
Let me give you an example…
If you divide 21 by 34 in the Fibonacci sequence, what do you get?
0.618 (61.8%)
Now, what if you divide 21 by 55 which is two sequences away?
0.382 (38.2%)
How about 21 with 89 which is three sequences away?
0.236 (23.6%)
That makes more sense, right?
I mean, we need to learn how to apply these to financial markets!
And as you know…
It’s this very same Fibonacci ratio that we learn how to draw Fibonacci retracement in very different ways.
Such as with the Fibonacci circle:

Fibonacci fan:
And finally, which is what we’re going to focus on today, the Fibonacci retracement:
Now before we go head-on as to how to draw Fibonacci retracement…
Let me tell you a common mistake a trader makes when plotting them on the chart.
The most common mistake traders make when knowing how to draw Fibonacci retracement
You see…
Knowing how to draw Fibonacci retracement is more than just knowing whether or not you should “include” the wick or the close.
It’s about identifying your market structure and condition!
This is why traders often make the mistake of not learning…
How to identify relevant swing highs and lows properly
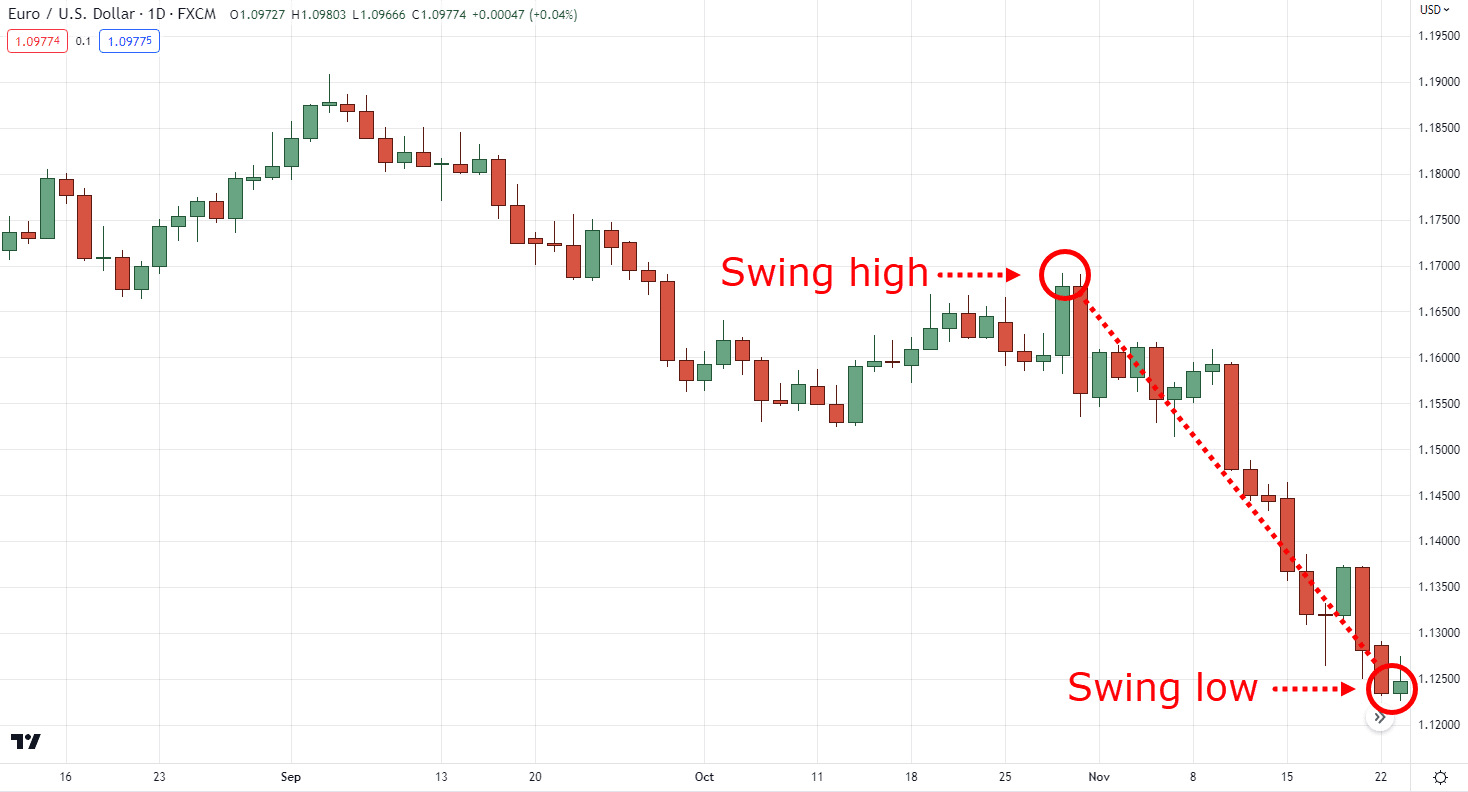
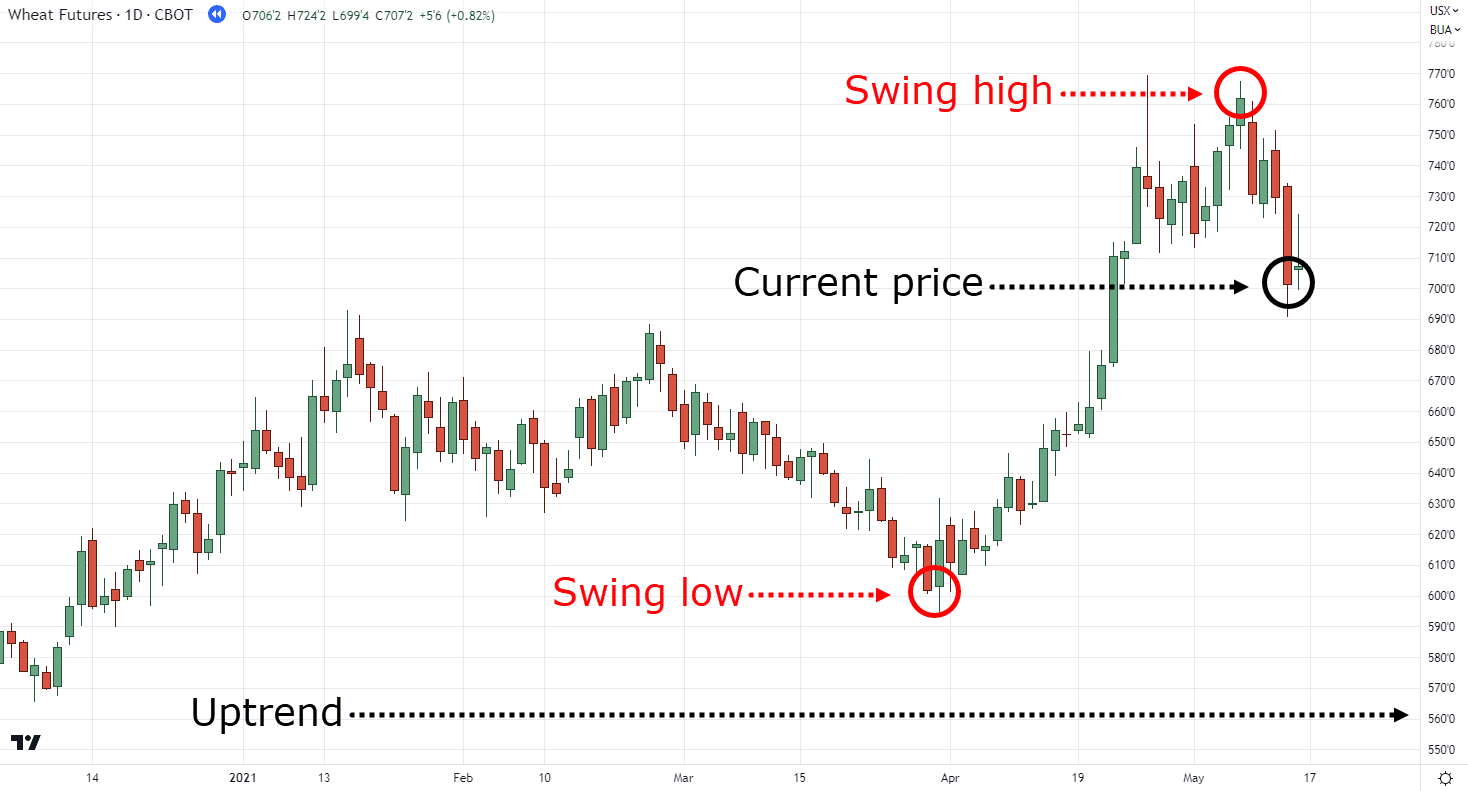
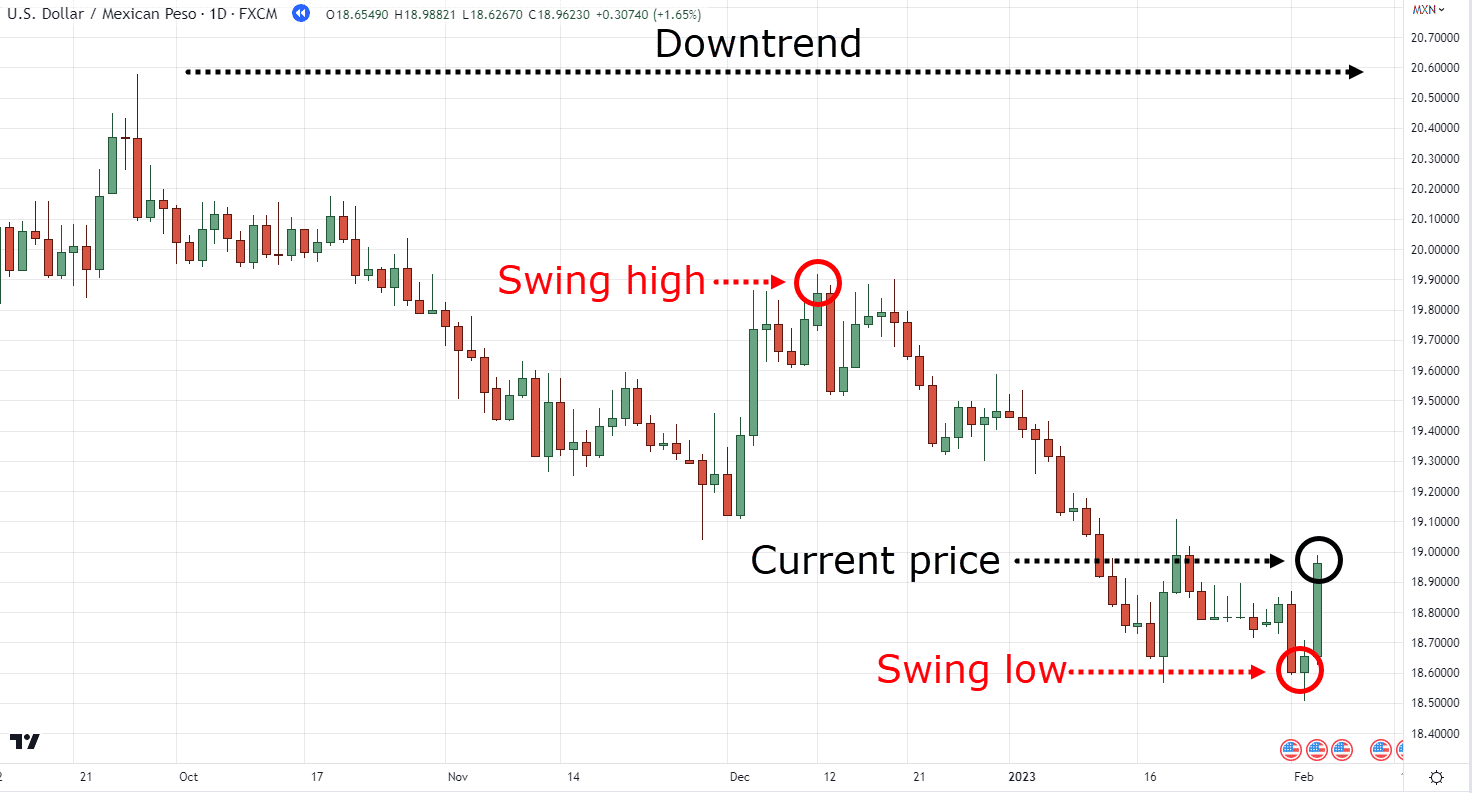
Plotting a Fibonacci retracement requires two things.
A swing high, and a swing low:
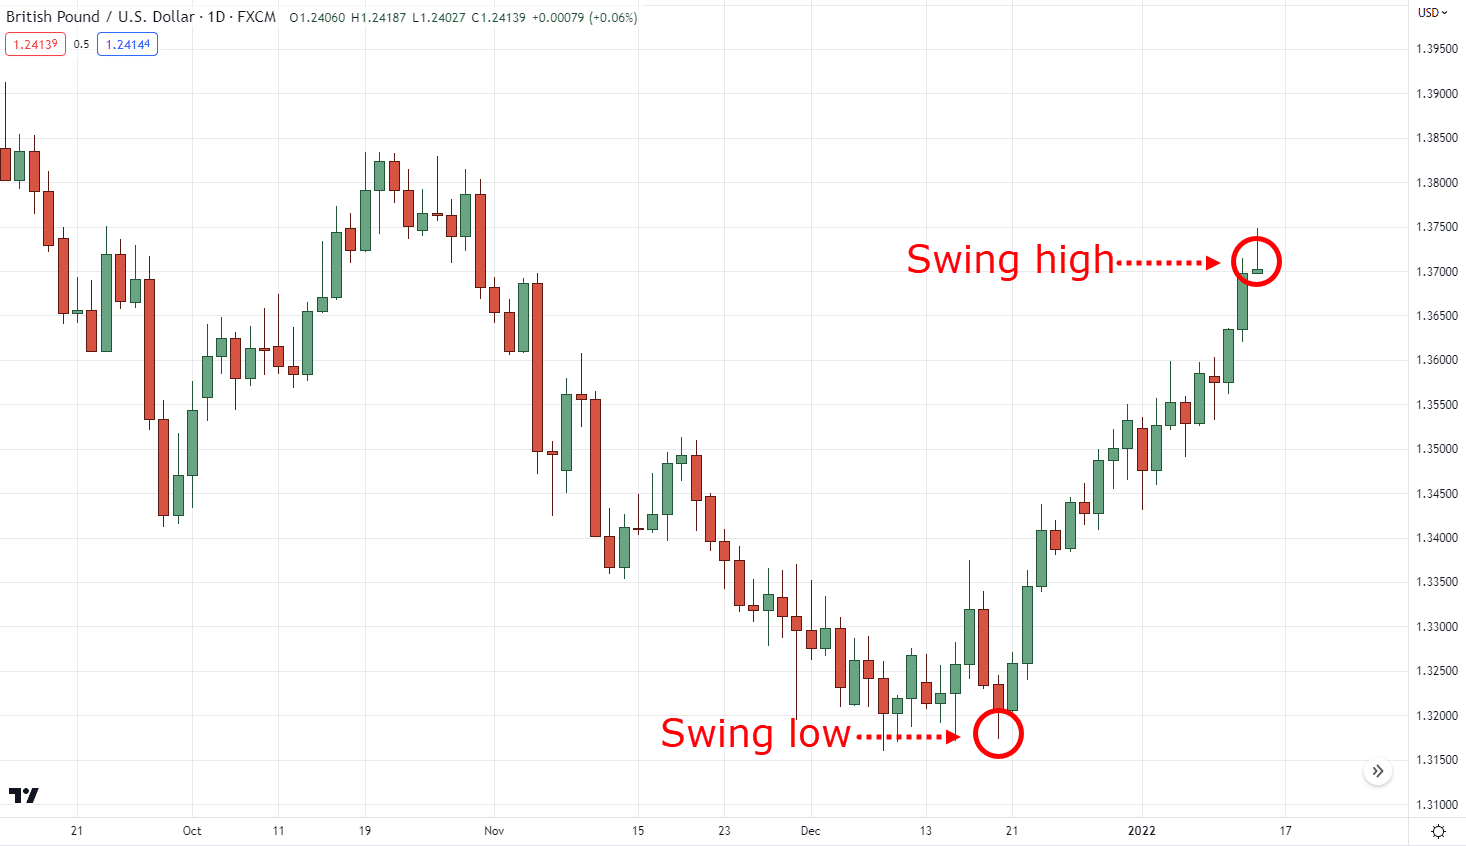
This is so that you can determine how low the pullback can potentially go:
That makes sense, right?
However…
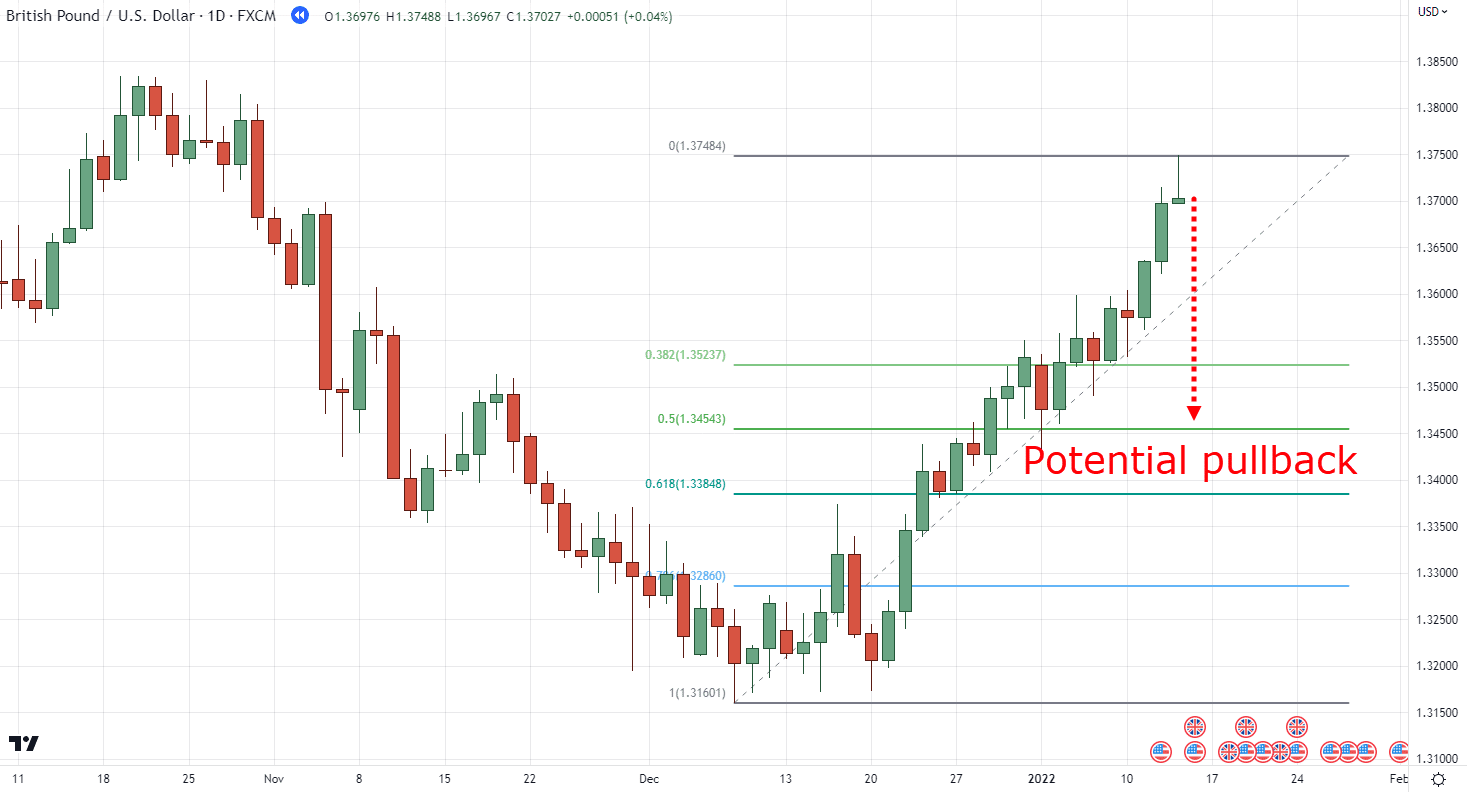
How about these swing highs?
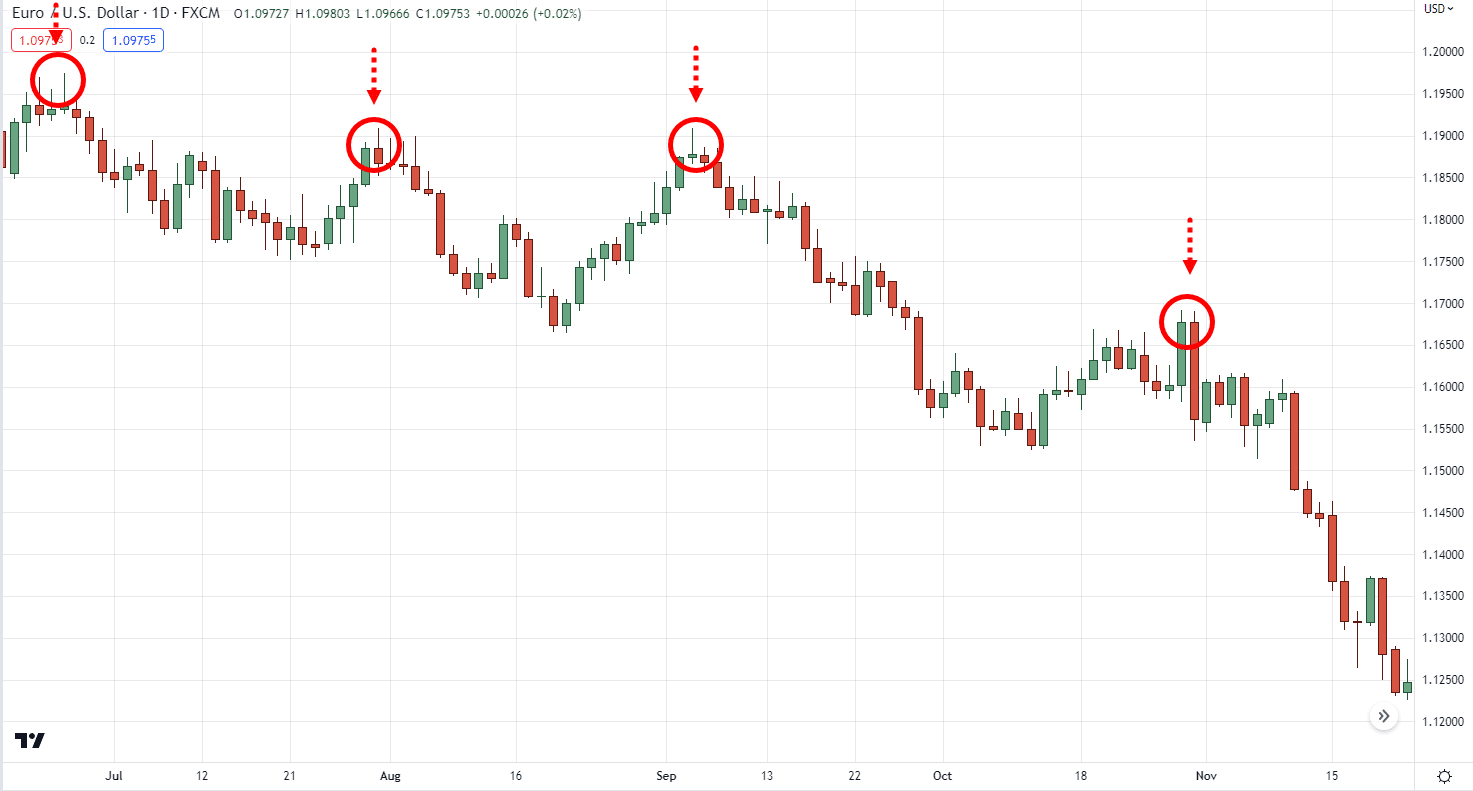
Aha, this is where things can get tricky.
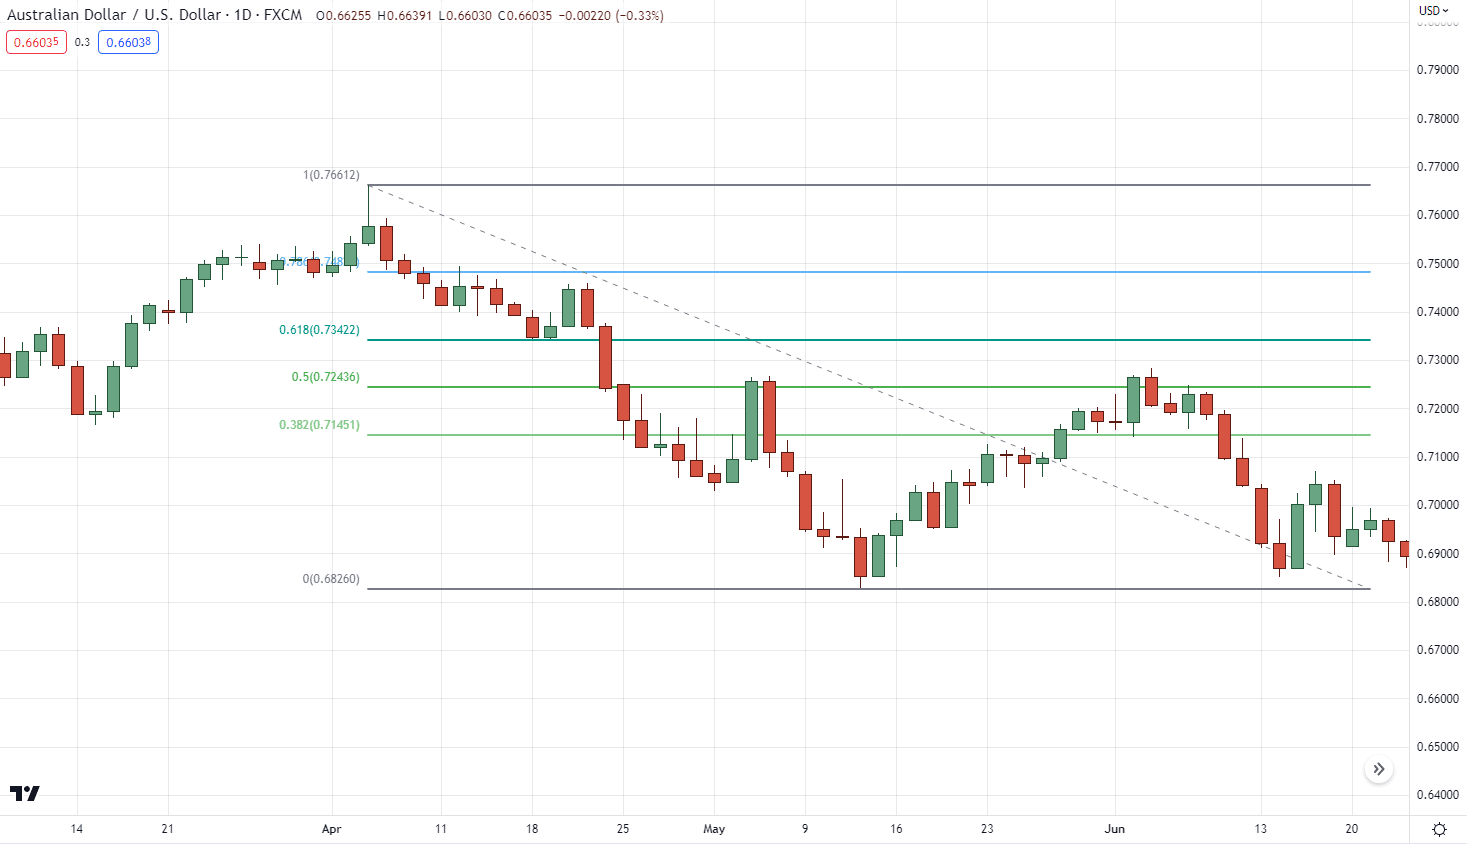
Because a lot of traders can get confused about whether or not they should plot their Fibonacci retracement like this:
Or like this:
Which swing high should you start drawing your Fibonacci retracement?
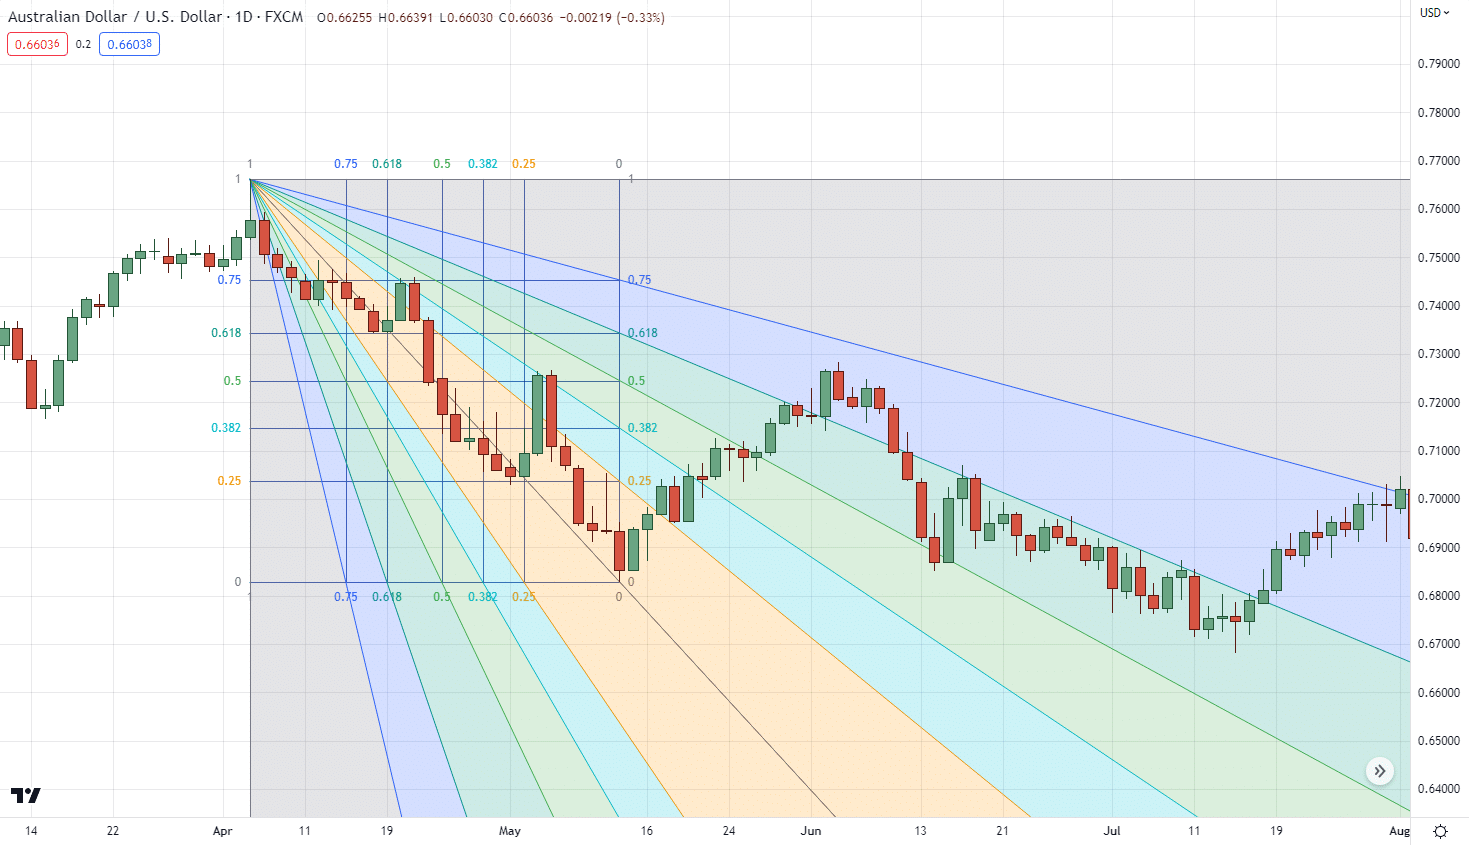
Now if you’re in this situation, what do you do?
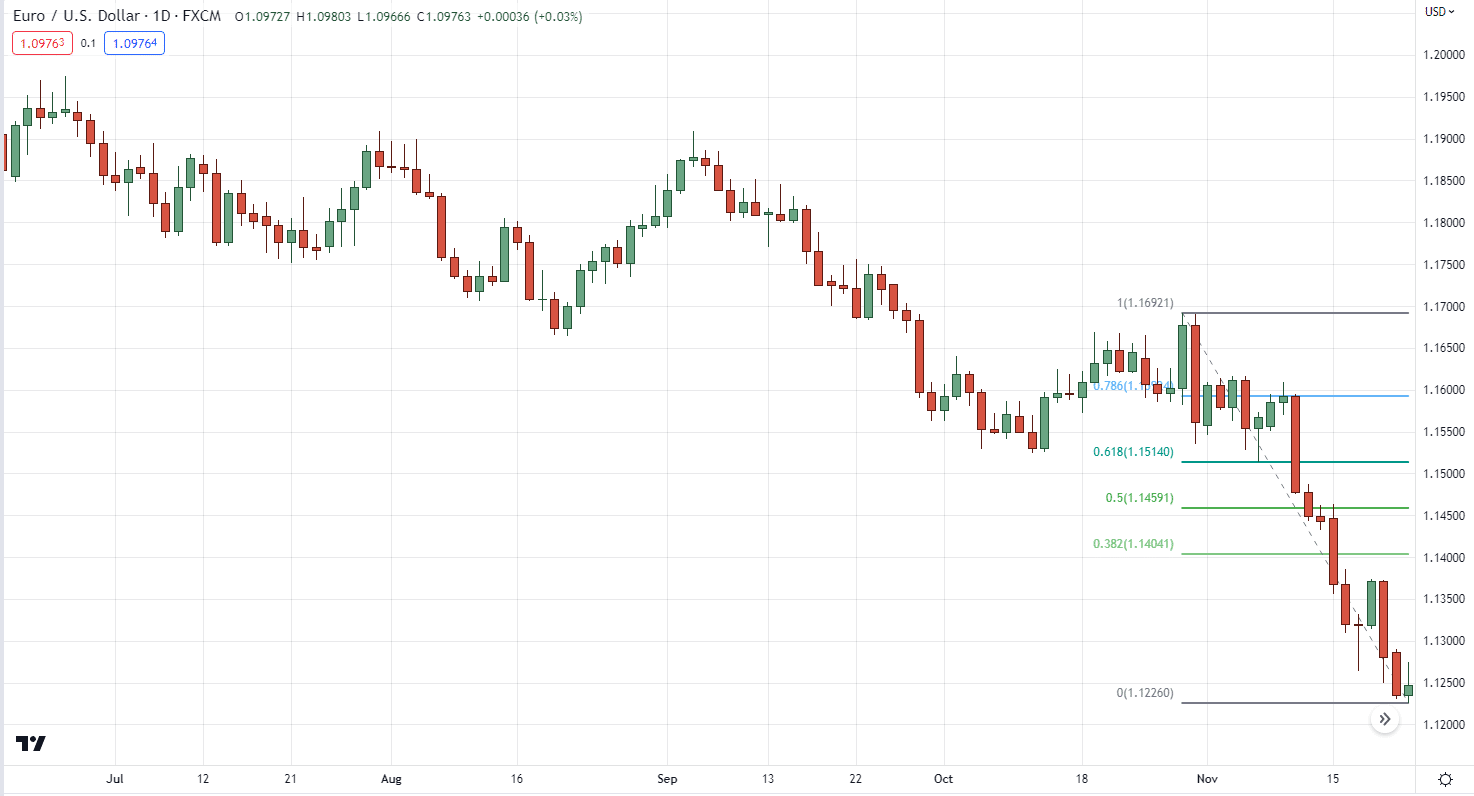
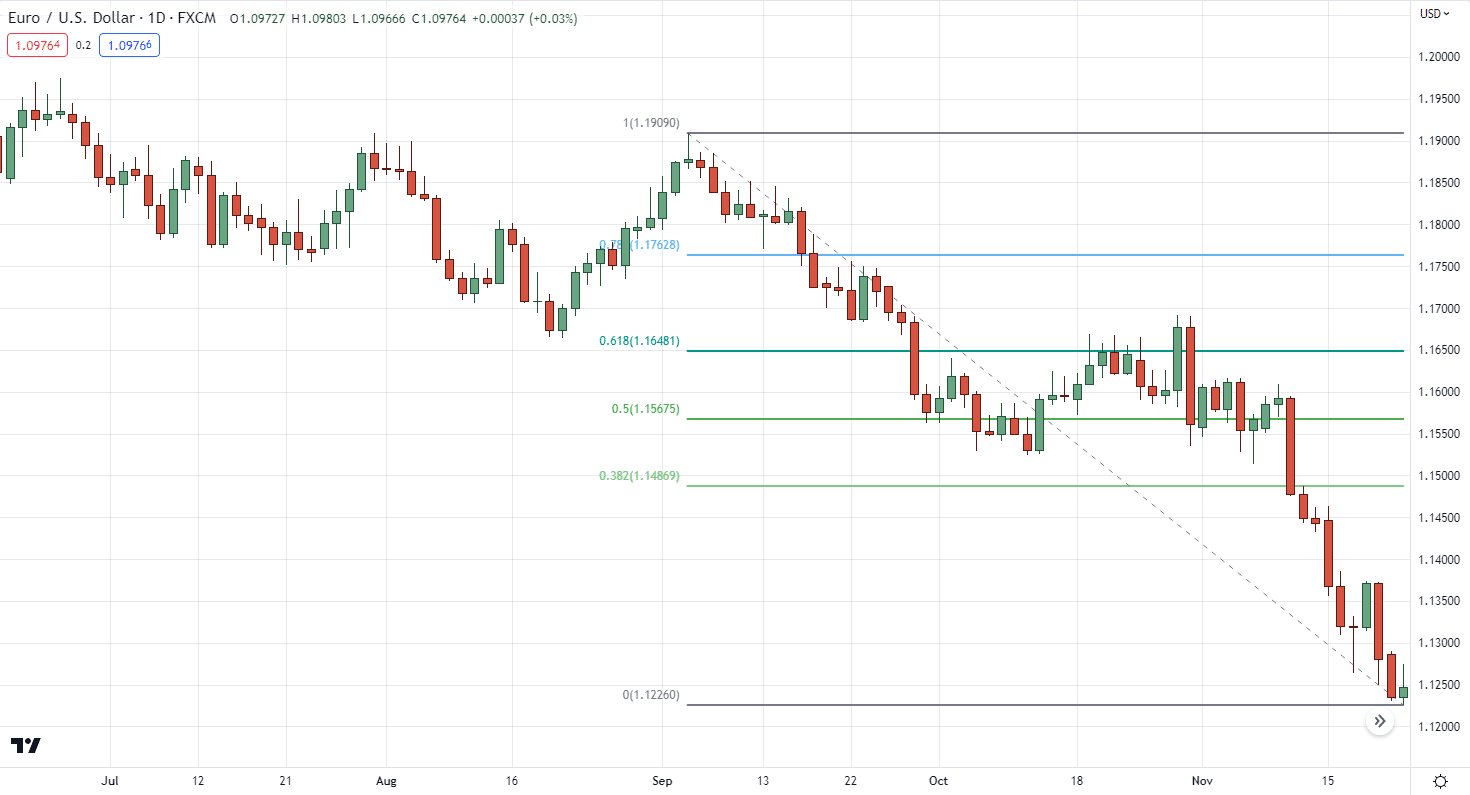
Yep, you probably end up plotting more Fibonacci retracements on your chart:
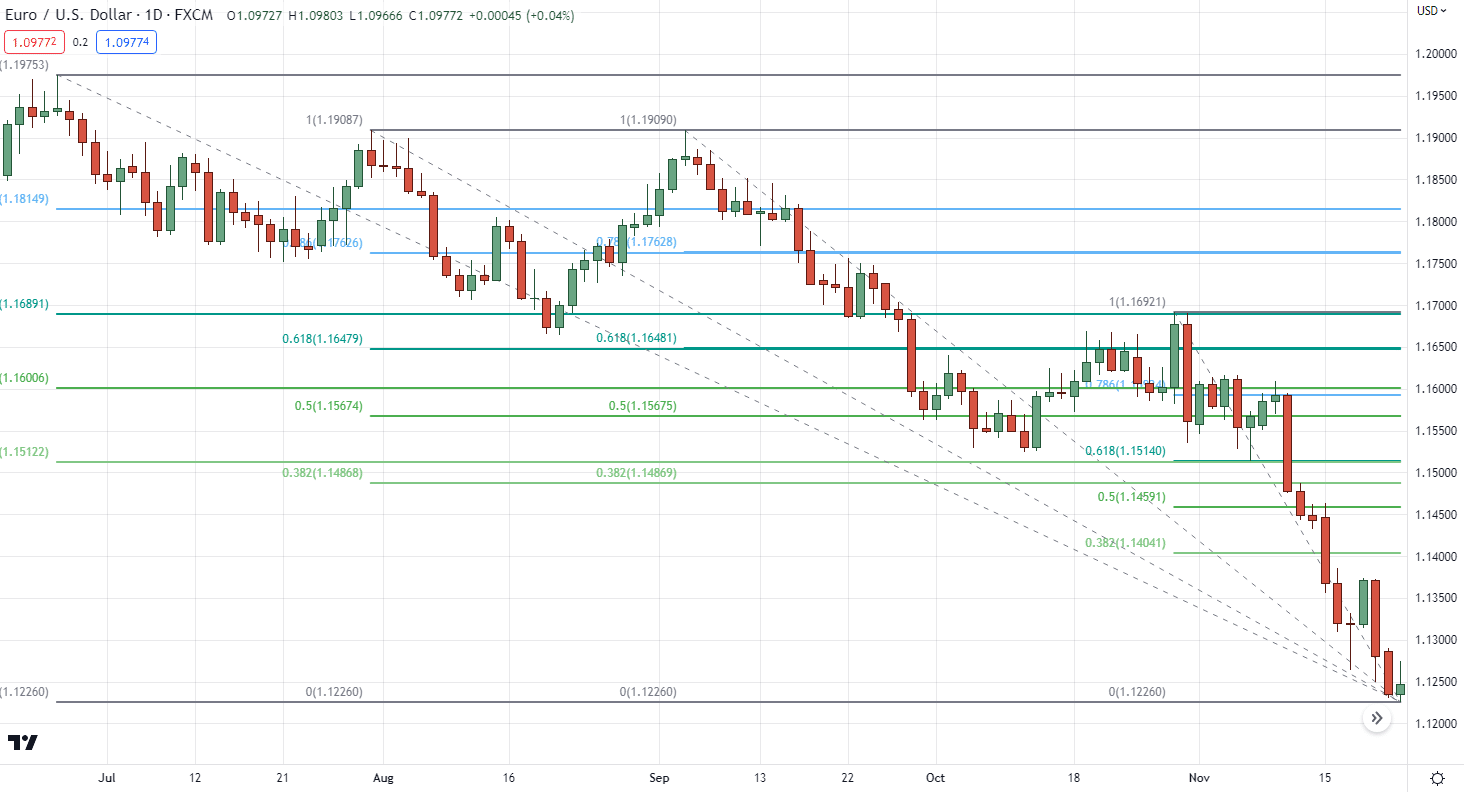
But this my friend…
Is the wrong way to use this tool.
Yes, plotting more Fibonacci retracements can give you “confluence” on which levels to look at:
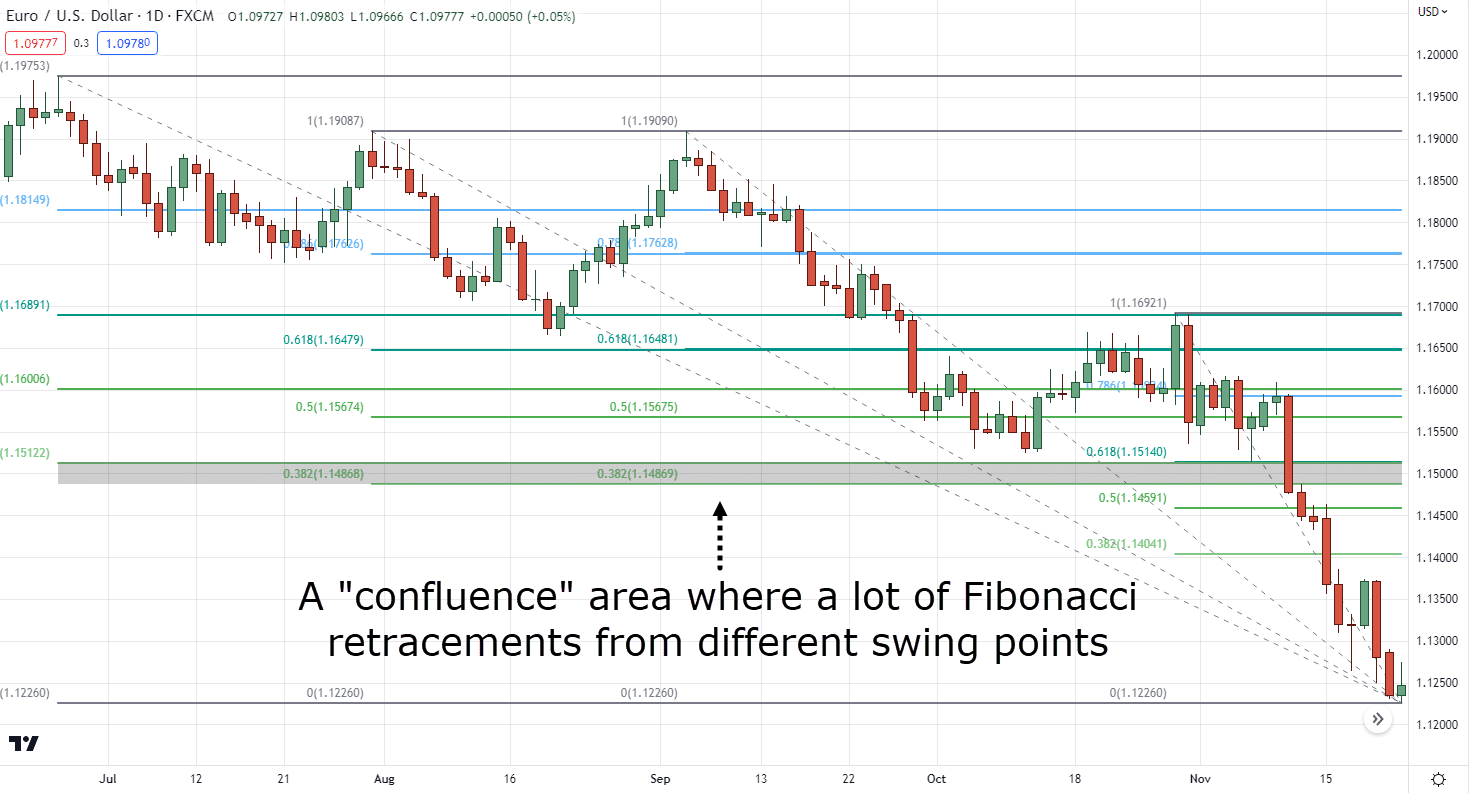
But this will do you more analysis paralysis than actually making good trades.
So?
What’s the solution?
Focus on the current price, and the relevant swing highs and lows for that current price
As a Fibonacci trader myself before…
I fell into this trap of plotting every single Fibonacci retracement I can plot on and zooming out my charts as far as I can.
But the moment I focused on the current price:
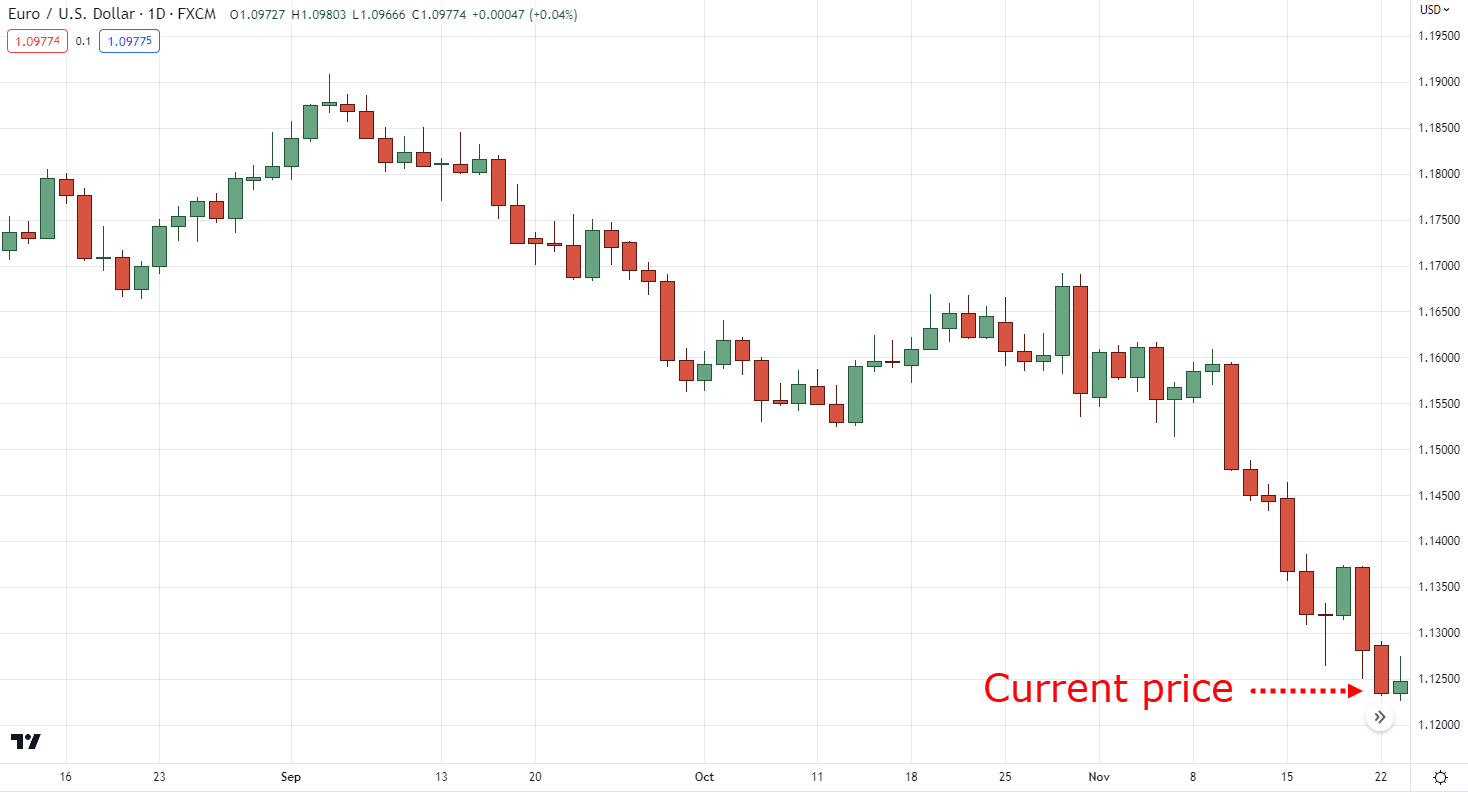
And then figuring out the “relevant” swing highs and swing lows:
Identifying trading setups has been clearer than ever:
That’s right!
Less is more, my friend.
One good Fibonacci retracement is all you need most of the time!
And this leads us to the main question of the day…
“How to draw Fibonacci retracement properly?”
Let me show you in the next section…
A Step-by-Step Guide on How to Draw Fibonacci Retracement
Let’s get right into it, shall we?
Now listen carefully…
To consistently draw a Fibonacci retracement, these are the steps that you must keep in mind:
- Identify the market condition
- Identify the relevant swing highs and lows
- Plot your Fibonacci retracement that coincides with the market condition
Let me show you how it’s done!
1. Identify the market condition
This part is crucial as you don’t want to be plotting the Fibonacci retracement into the wild.
Because if you remember…
Our purpose in knowing how to draw Fibonacci retracement is to gauge how deep a pullback can go in an existing trend!
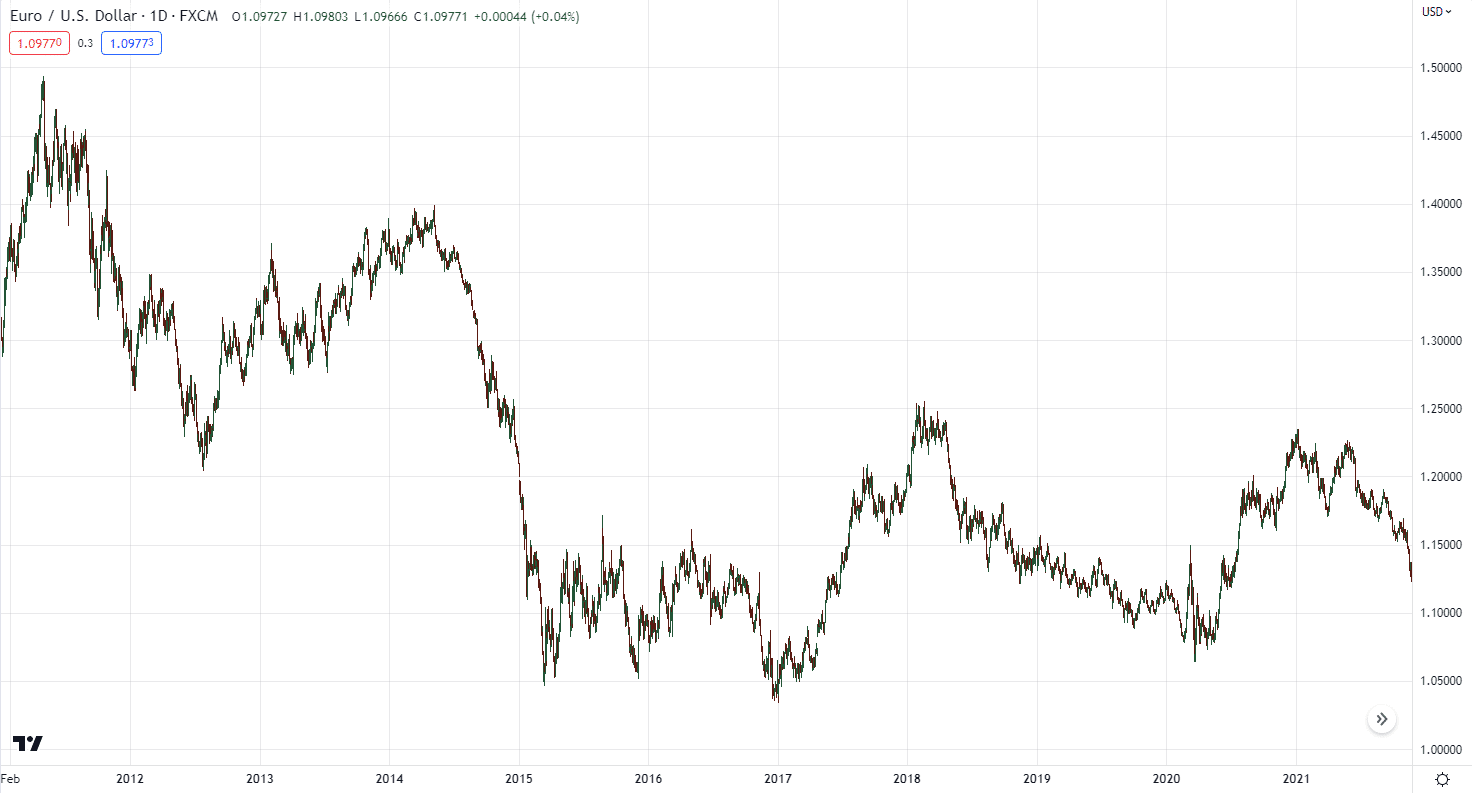
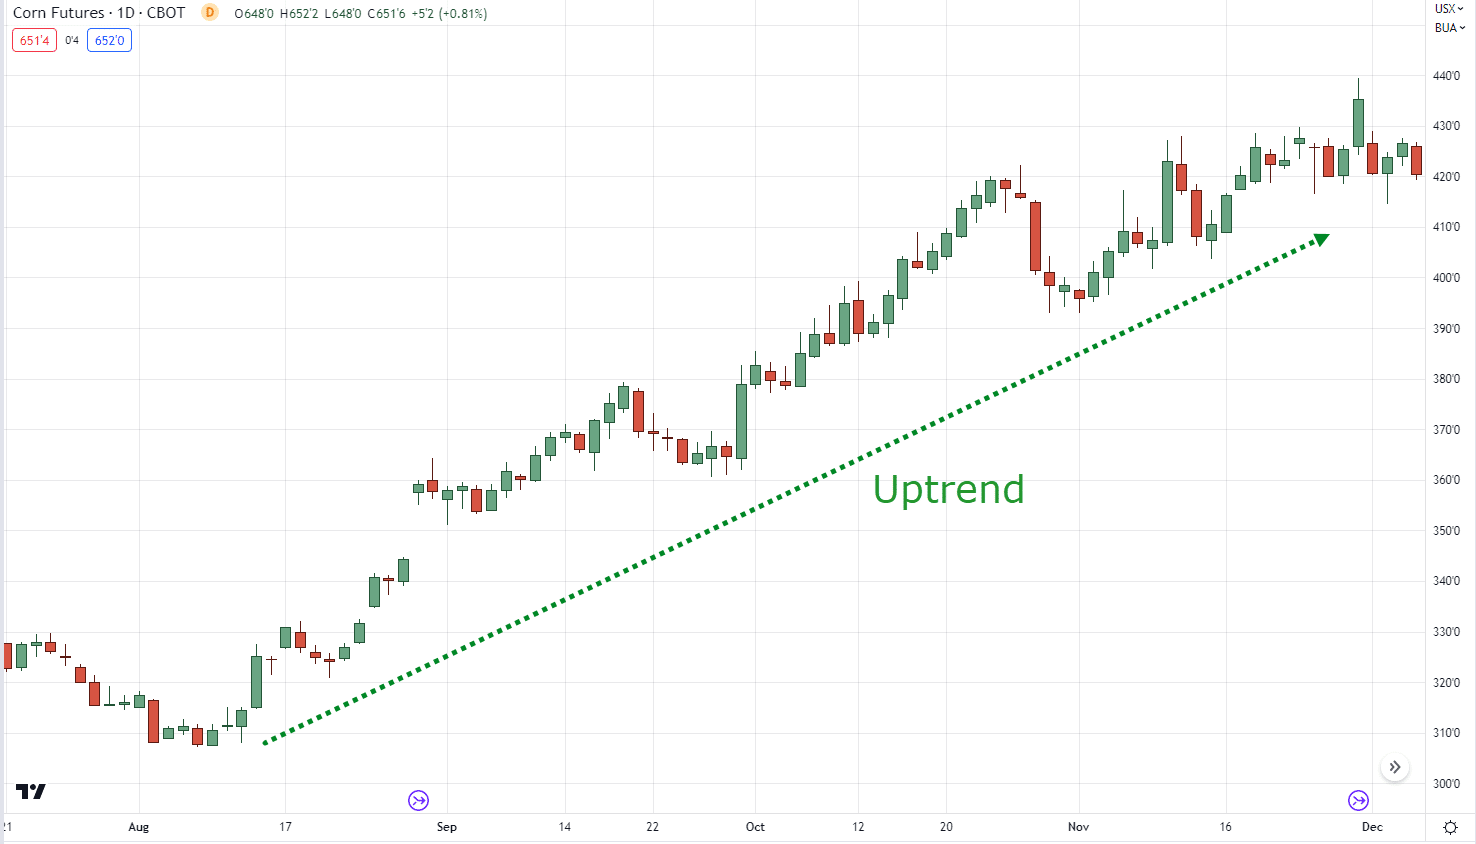
So, you must identify whether the market is in an uptrend:
Or in a downtrend:
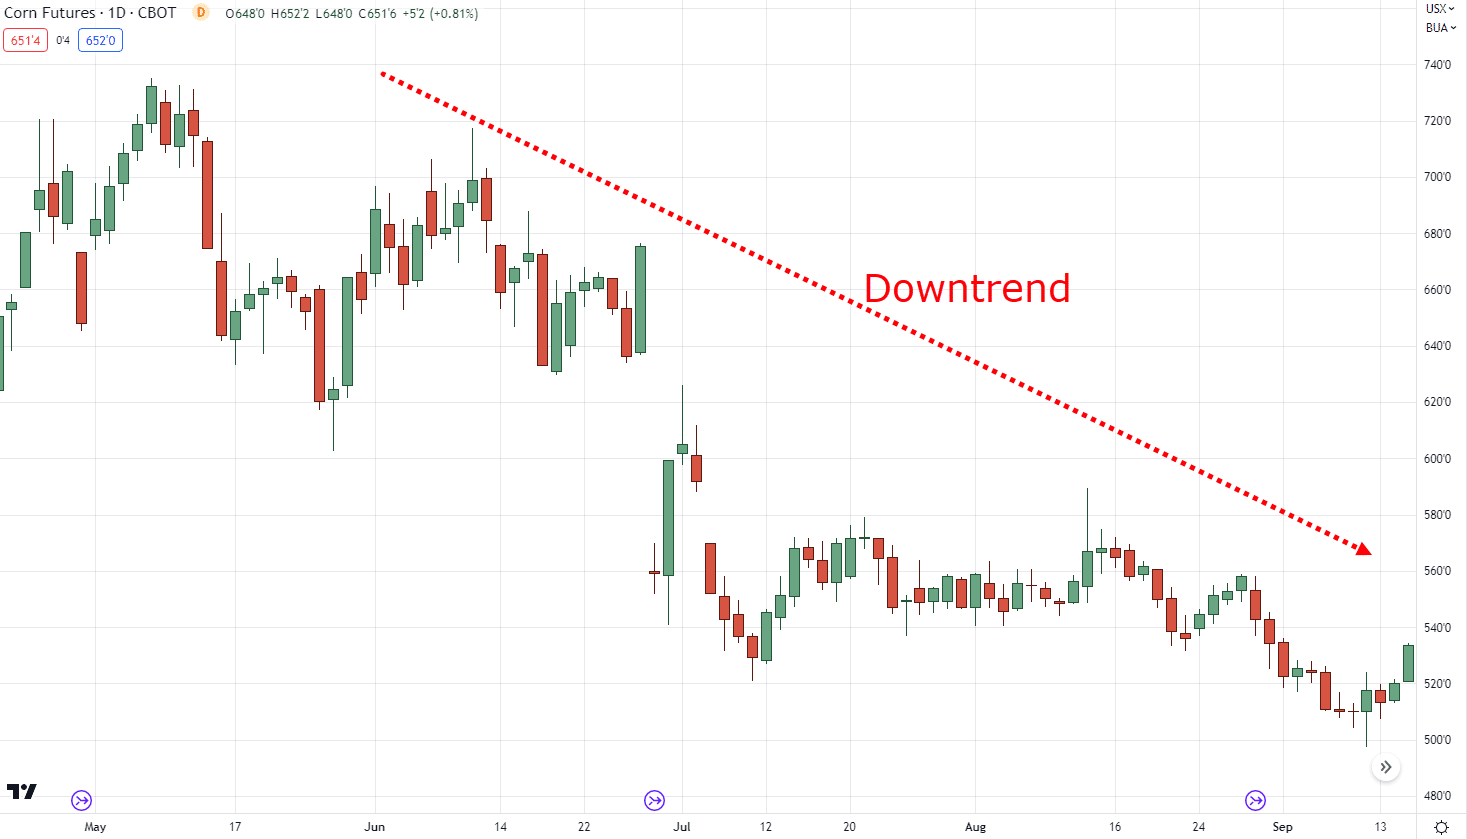
P.S. To keep things objective, you can use the 200-period moving average to define market conditions with ease.
Next…
2. Identify the relevant swing highs and lows
Remember what we talked about in the last section?
Good.
As you want to focus on the current price and figure out the relevant “leg” or swing highs and lows based on the current price.
Here’s an example in an uptrend:
And in a downtrend:
Makes sense?
So now that you have your relevant swing highs and lows…
All that’s left is to draw your Fibonacci retracement!
3. Plot your Fibonacci retracement that coincides with the market condition
The reason why I shared with you those two prior steps is this…
It’s so that you don’t plot your Fibonacci retracement upside down!
That’s why in an uptrend, you must plot your Fibonacci retracement from the swing low up until the swing high:

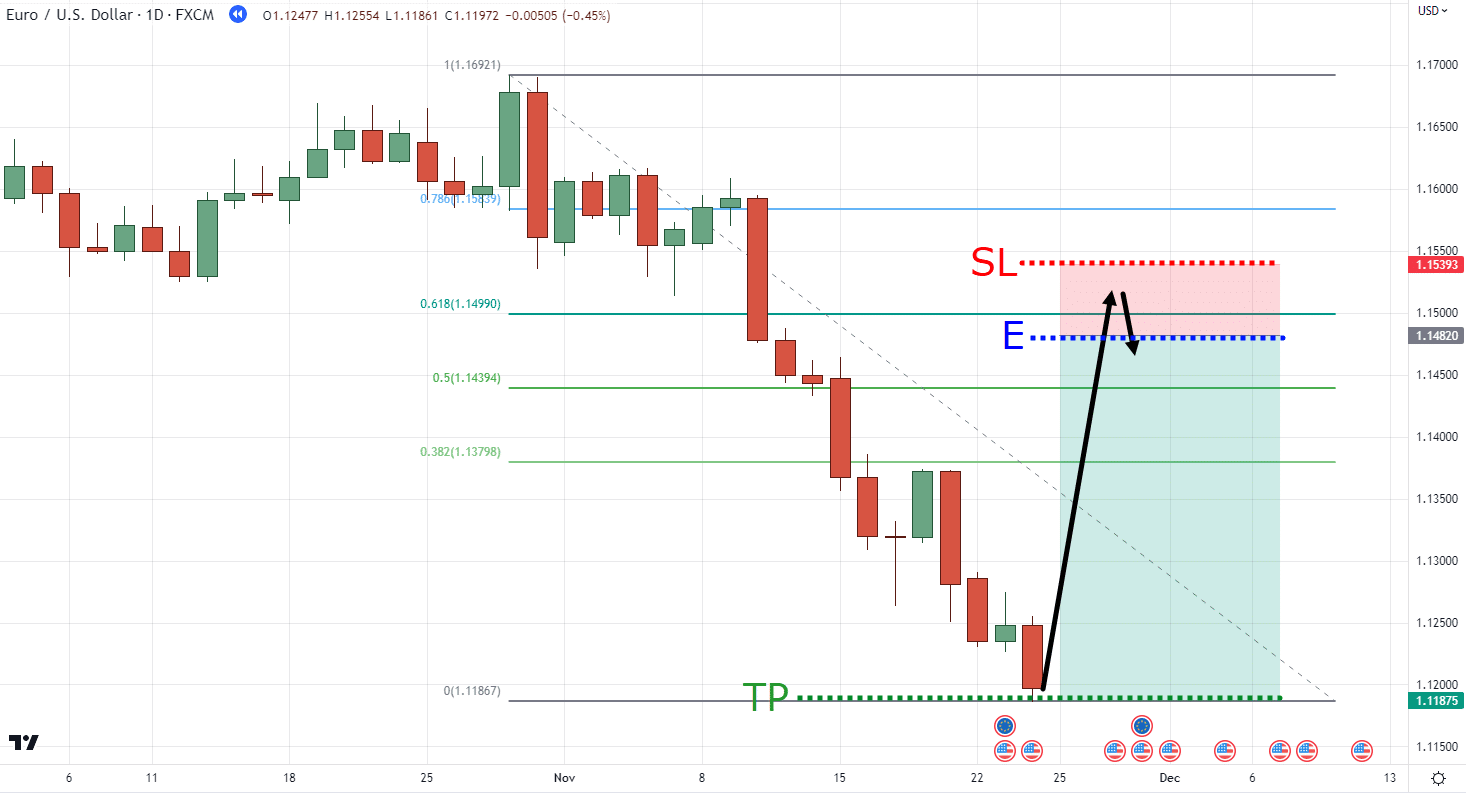
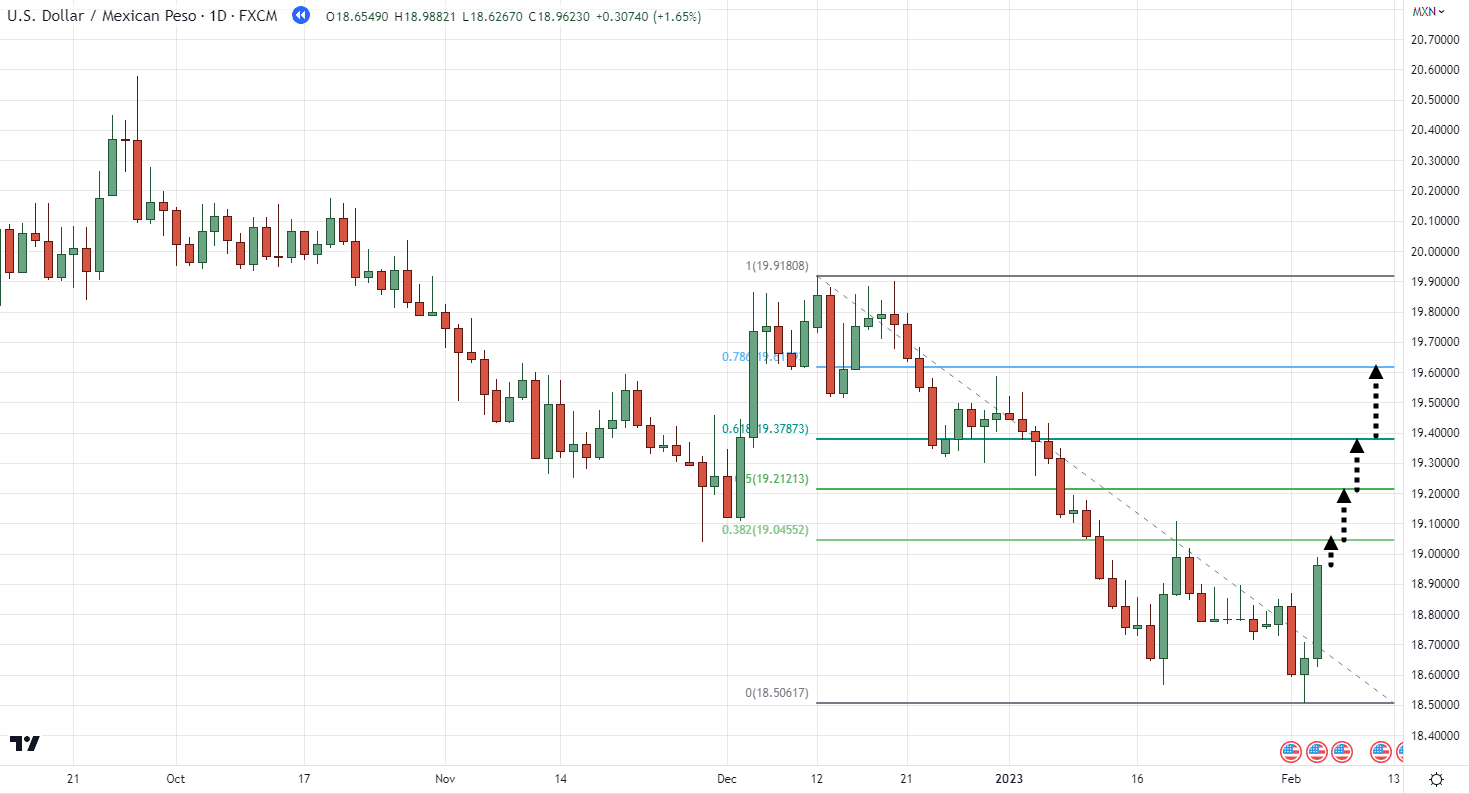
And in a downtrend, you plot the Fibonacci retracement from the swing high down to the swing low:

So, can you see how important it is to identify the trend first?
Because remember…
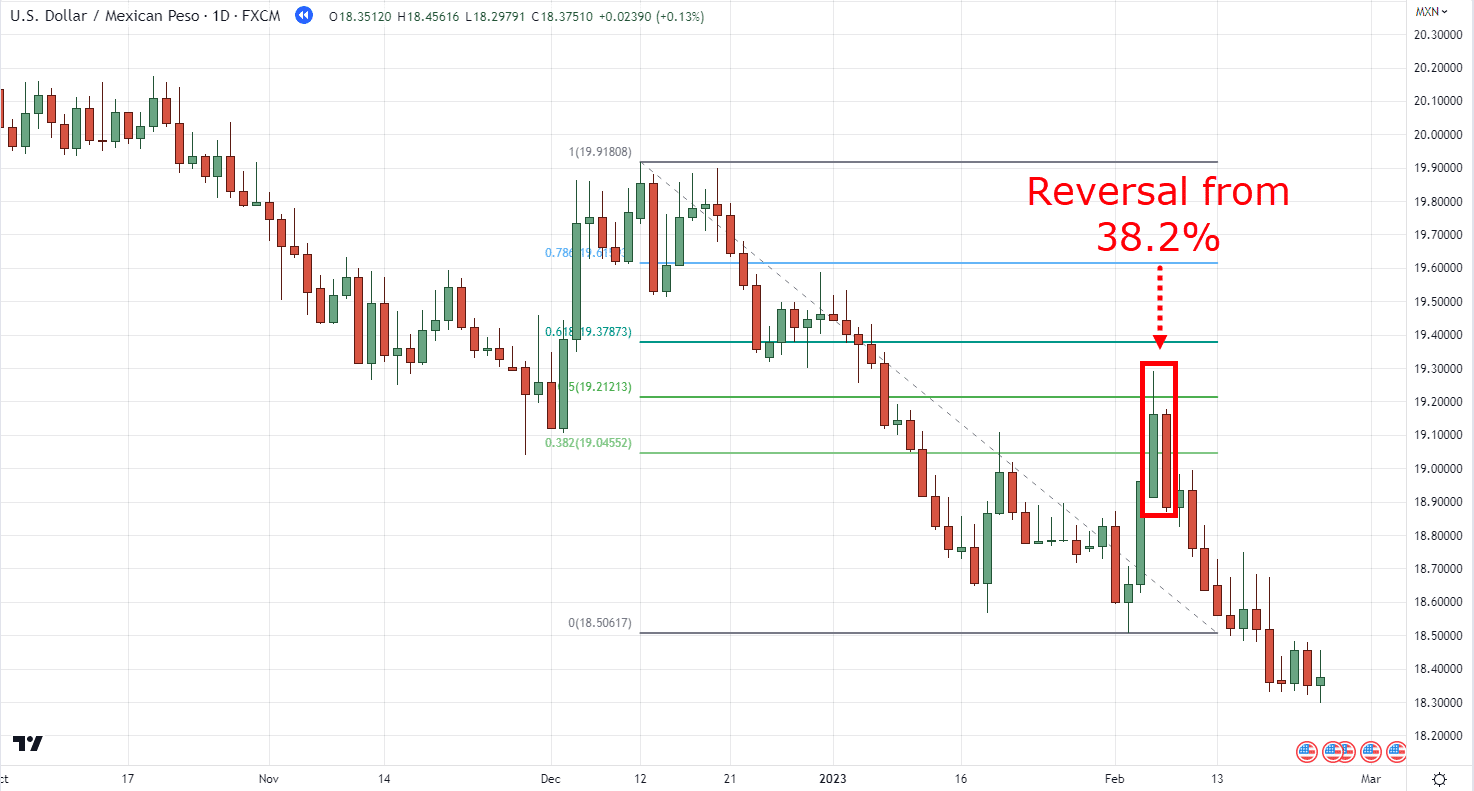
We are trying to measure how deep a pullback can potentially go, before it potentially reverses.
Here’s an example from USDMXN Daily chart:
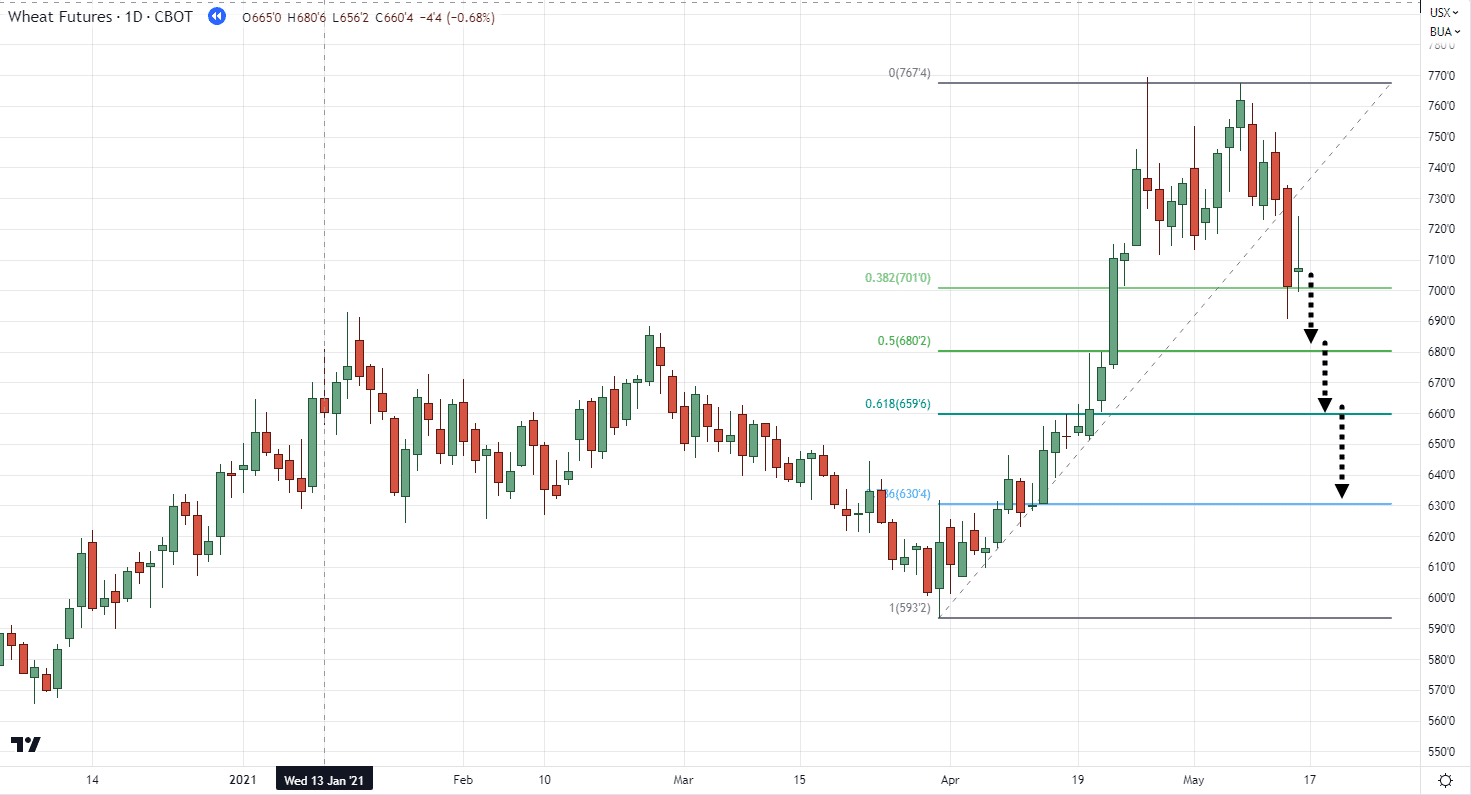
Another example from Wheat Futures Daily chart:
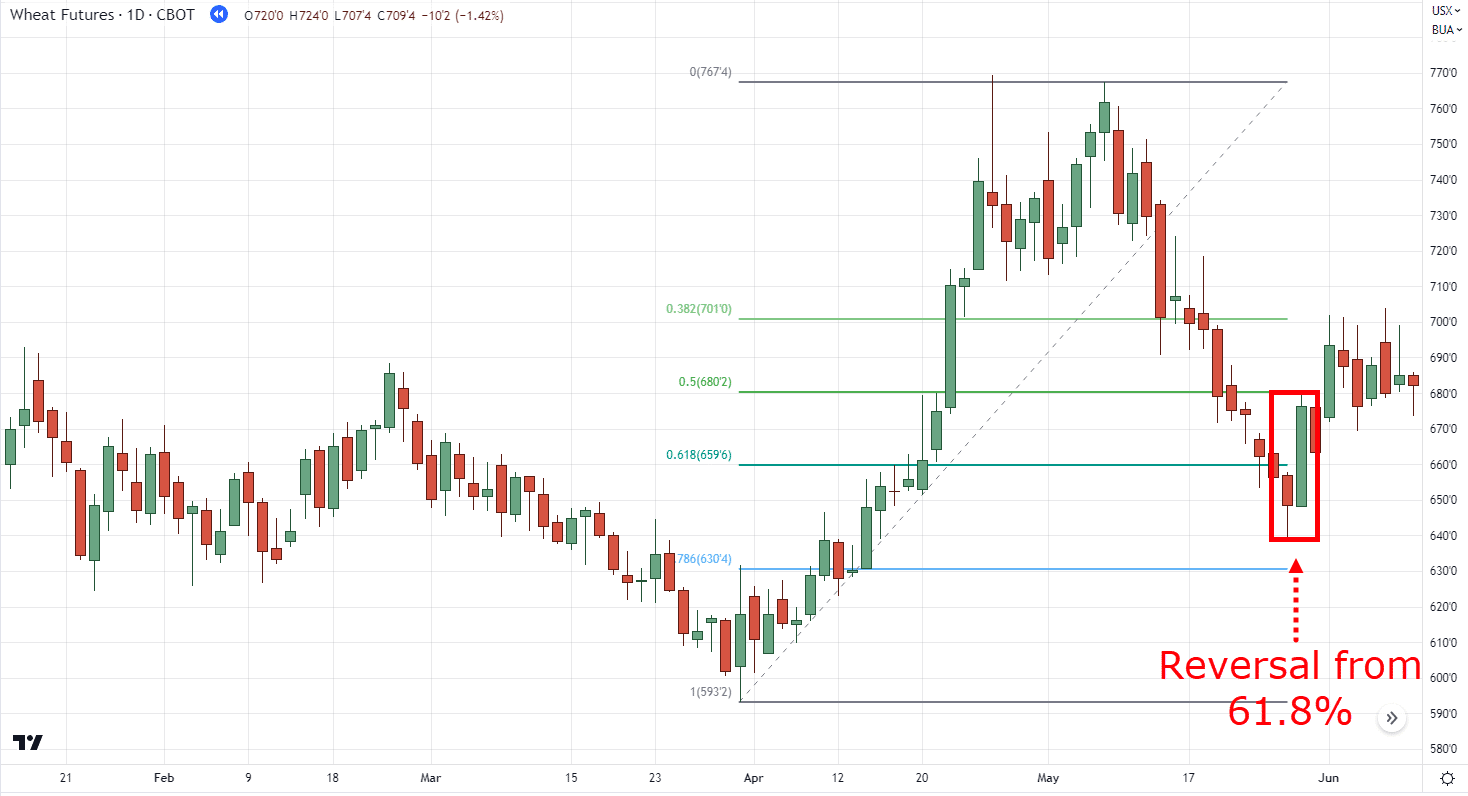
And there you go!
A step-by-step guide on how to draw Fibonacci retracement!
But wait, I almost forgot something!
There’s still one more question left I forgot to answer…
Do you start plotting from the wicks or the close?
I’ll be honest with you…
This is often a question I get about drawing Fibonacci retracement!
But for the sake of consistency…
I suggest plotting from wick to wick.
The only exception is when the wick becomes too volatile or becomes an “outlier” to the market structure:
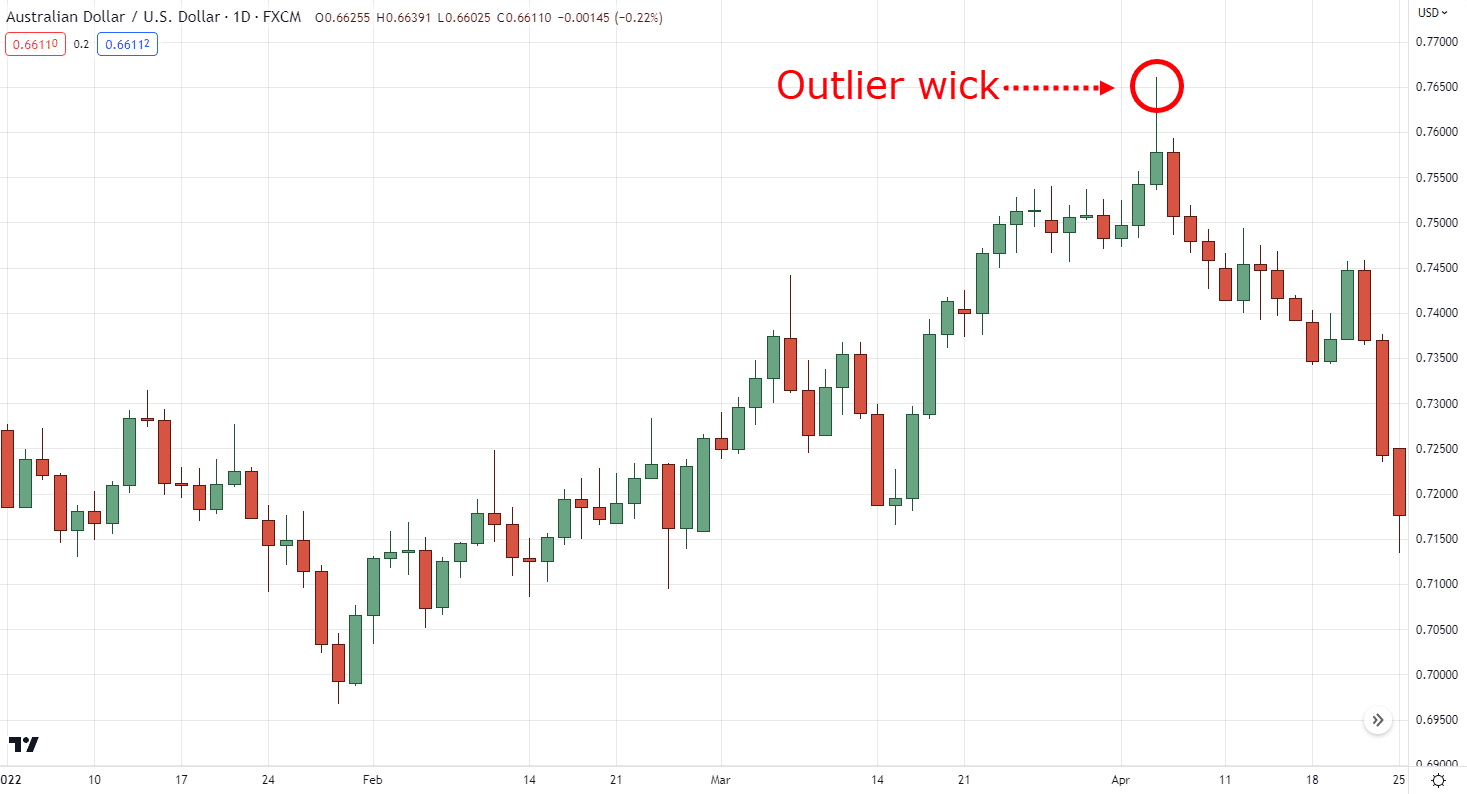
In that case…
I exclude that wick and start plotting at the area where the swing high or low is relevant and visible:
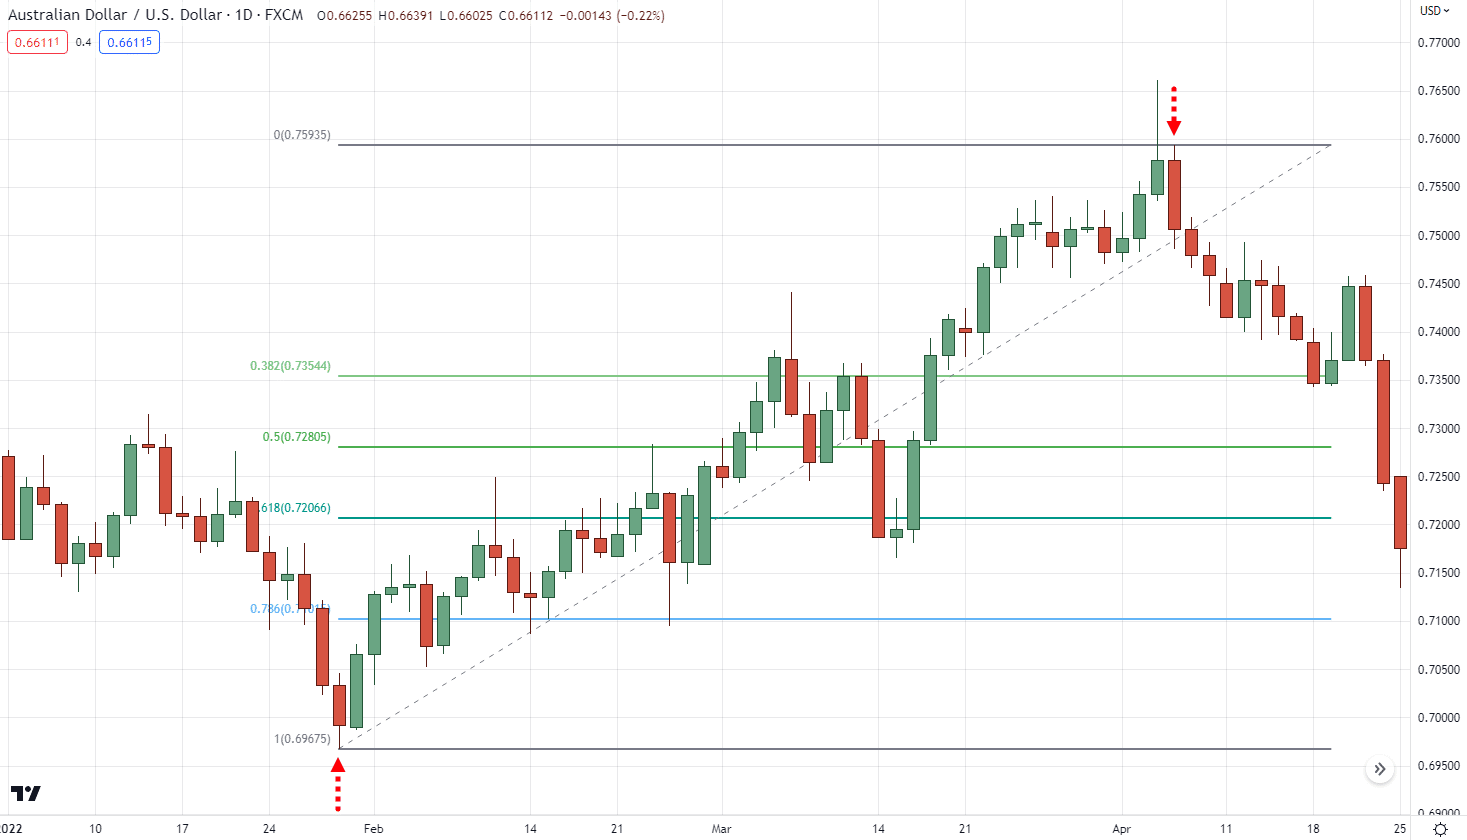
P.S. I plotted my Fibonacci retracement two swing lows below as it is more relevant to the current price
Sounds good?
Then start going into charts and start practicing how to draw Fibonacci retracement!
But nonetheless…
If you wish to take things to the next level by learning how to profit from this tool, I highly suggest you check this out:
The Essential Guide To Fibonacci Trading
With that said, let’s have a quick recap of what you’ve learned today…
Conclusion
When used right…
The Fibonacci retracement is a powerful tool that can give you an objective view of how to trade pullbacks and “predict” reversals.
But in reality, learning how to draw Fibonacci retracement requires a process.
That’s why in today’s guide I was able to share with you that:
- Fibonacci “ratios” are derived from dividing the values from the original Fibonacci “sequence”
- Plotting the Fibonacci retracement should be kept simple by simply identifying relevant swing highs and lows based on the current price
- Drawing the Fibonacci retracement means that you must identify the market condition and the relevant swing highs and lows so that you’ll know the right orientation on where you should plot all the time
And there you go!
So, over to you…
Have you been using other tools such as the Fibonacci extension or fan aside from the Fibonacci retracement?
How is it helping you in your trading right now?
Let me know in the comments below!
Hey Rayner , My name is Adnaan from South Africa . I would like to improve my trading but I need a hands on approach with a professional setting/space with perhaps other traders who are also learning and a mentor . The YouTube videos are not doing it . Thank you much ..
Hey there Adnaan, we do have mentorship programs available, but nonetheless feel free to join our telegram channel here: https://telegram.me/+VkMXvk7yNOHP71EM
We’ll always do our best to provide professional grade information in our blogs and videos!
If you need more information about our programs feel free to email me at jet@tradingwithrayner.com!
your student from nigeria lets keep it up
Sure will, Sadiq!
I have been using it for some fine now but going through this piece of knowledge you just shared with us I now understand much better how to used the FIB tool more better to time my entries in a pullbag thanks so much sir I really do appreciate love from Cameroon
Awesome, great to hear that Chenwi!
Let us know how it goes in the next few days!
Can you send a video lecture of this. It will be more easier to graps
Hey there Gracious, we’ll try to consider it!
I have been using fib the same way you explained and it’s been profitable. Thanks for the better explanation.
Hey Remmy, great to hear that the tool has been working out in your favor, keep it up!
Should we only draw the Fibonacci retracememt in daily time frame
You can draw it on any timeframe, as long as you only draw it on one timeframe (don’t draw it on every timeframe you see)
Overall it would depend on how you want to use the tool, but use it consistently!
Thank you
You are most welcome, Twinkle!
great lesson. Thanks for continuously sharing and please keep it up.
Most welcome, Luis!
Thank you for the appreciation!
Cheers!
Sir good afternoon.i want you to help me with indicator.
Hey Nura, let me know which indicator you need help with!
Fabonacci retracement become more clearer to me now than before. Thanks to a season trader Rayner
Great to hear that, Kaka!