#4: Trend Trading Secrets
Lesson 4
So, here's the thing...
You know that the trend is your friend.
Traders have told you…
“You should be trading the trend. Trend trading is the real deal. That is how, you know, you make money in the markets.”
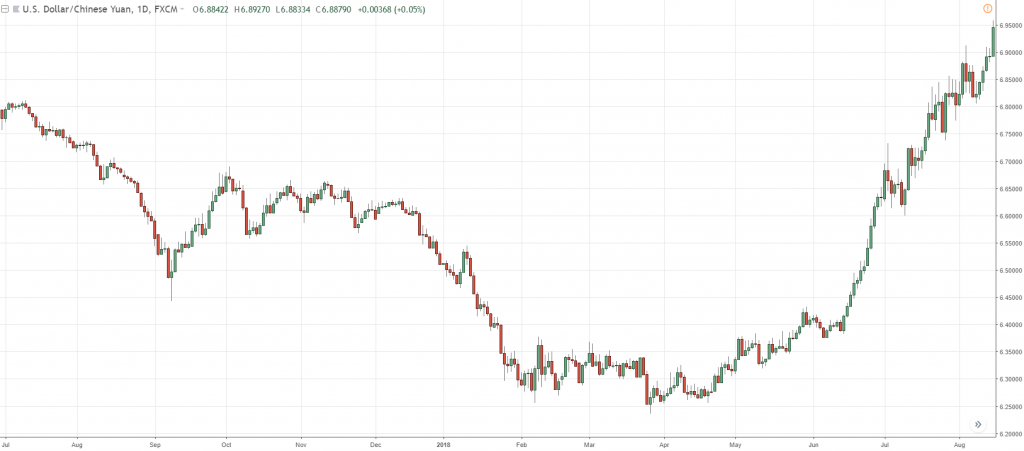
But if you look at my chart right now, you can see that this is an uptrend:
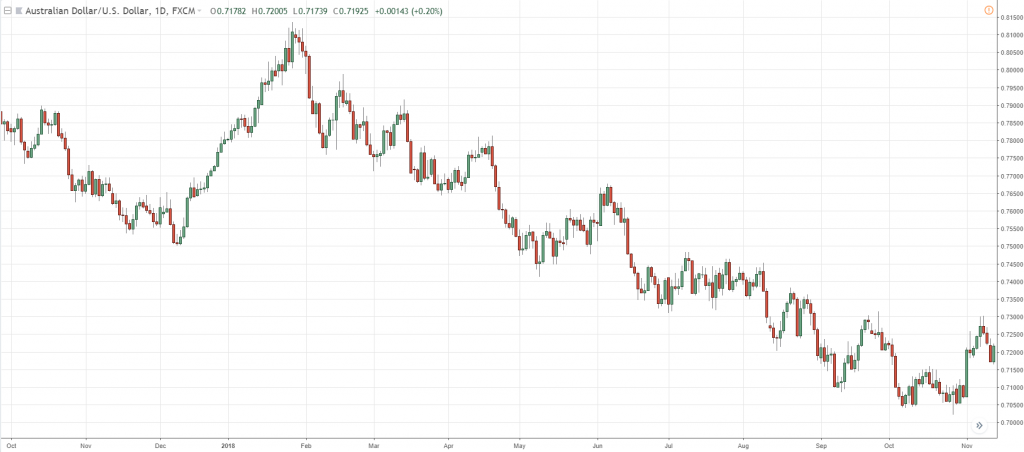
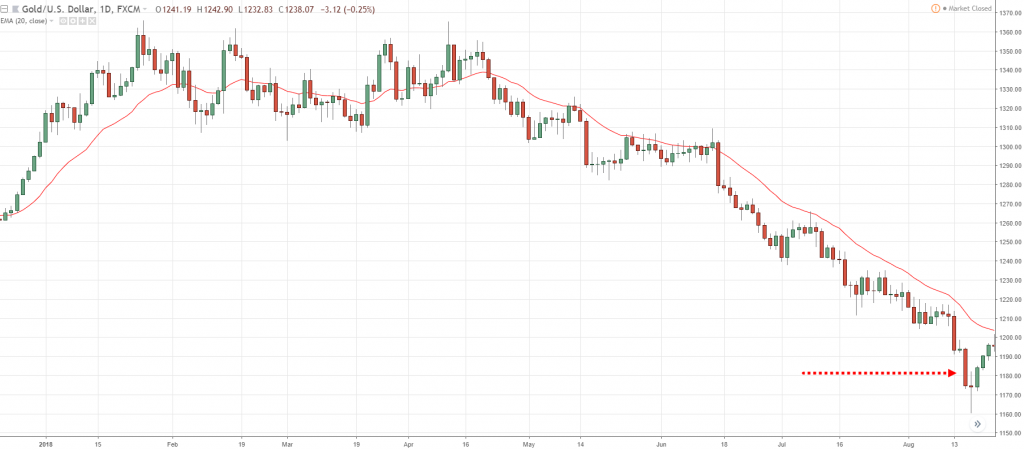
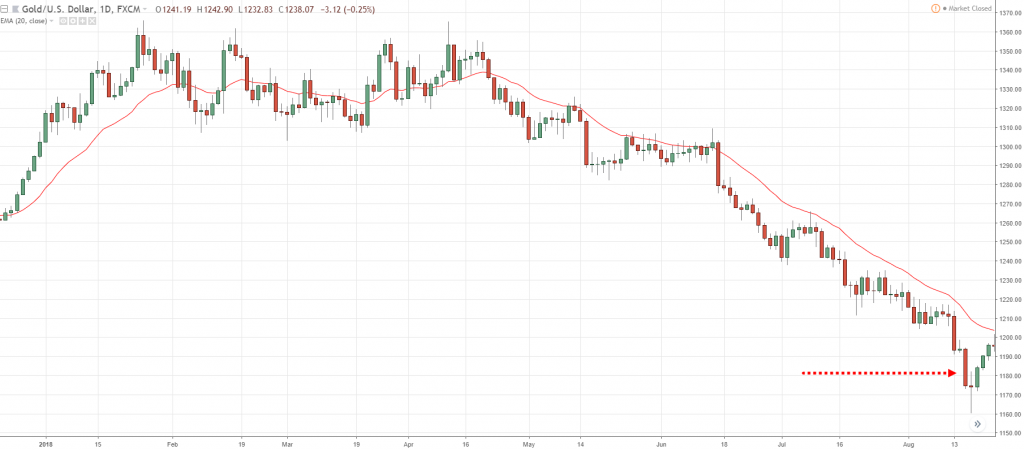
This second chart over here, it's a downtrend:
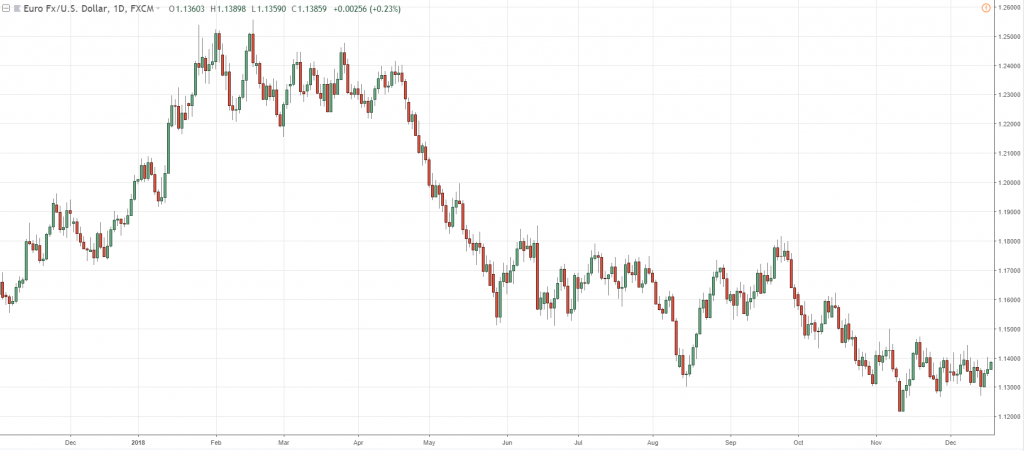
And this third chart over here is another downtrend:
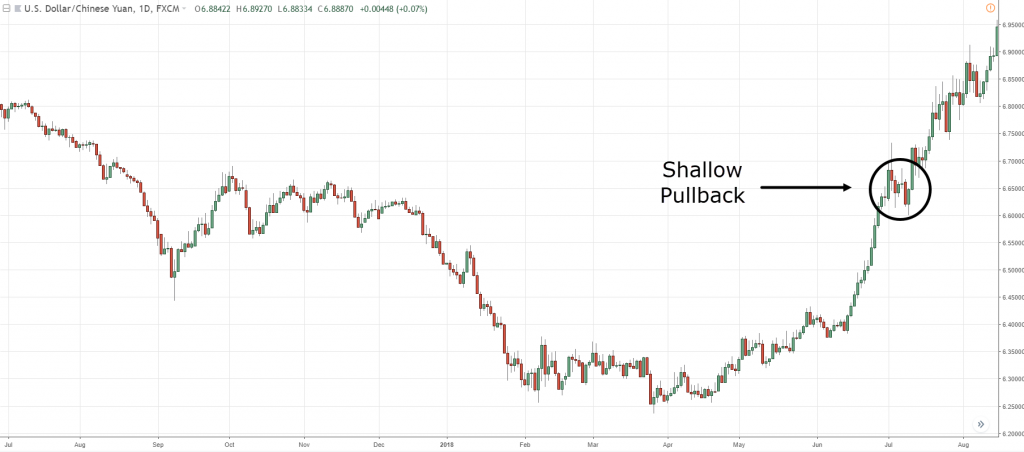
One thing that I want you to pay attention to is, again, look at the first chart again...
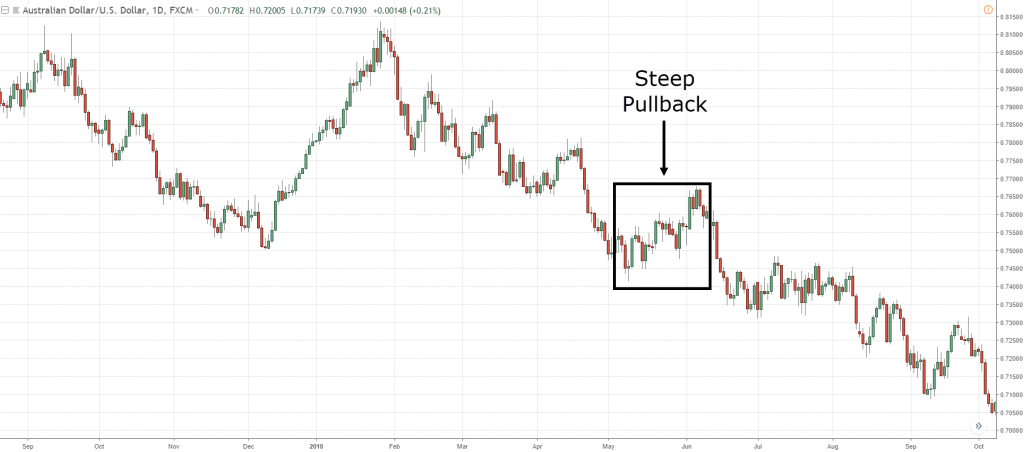
Notice this over here that it has a shallow pullback:
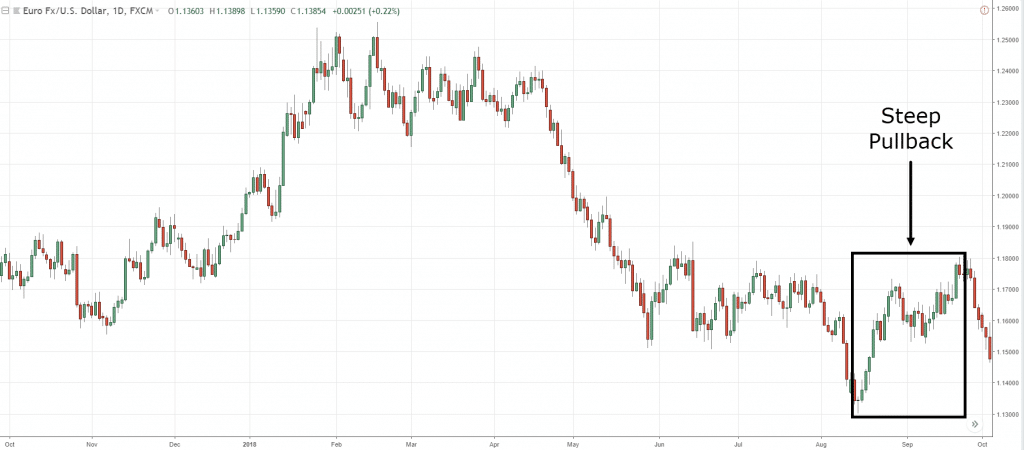
The second one over here, this chart has a much deeper pullback:
And finally, the third chart you have a deeper pullback over here:
So here is the first secret of trend trading...
Not all trends are created equal!
I do not know why traders don't talk about it.
They talk as though trends, they are all the same, but it's not.
They are not created equal, and that is why in today's video, I want to share with you:
- The three types of trend that every trader must know.
- When is the optimal entry point to enter a trending market, depending on what type of trend it is.
- And finally, by the end of this video, you will be a professional trend trader who can handle, who can profit, in the different types of trending markets.
Sounds good?
Then let's begin.
Three types of trend that every trader must know
The first type of trend that I want to share with you is what I call a…
Strong Trend
A strong trend is when the trend is strong, okay?
So, how do I actually define a strong trend?
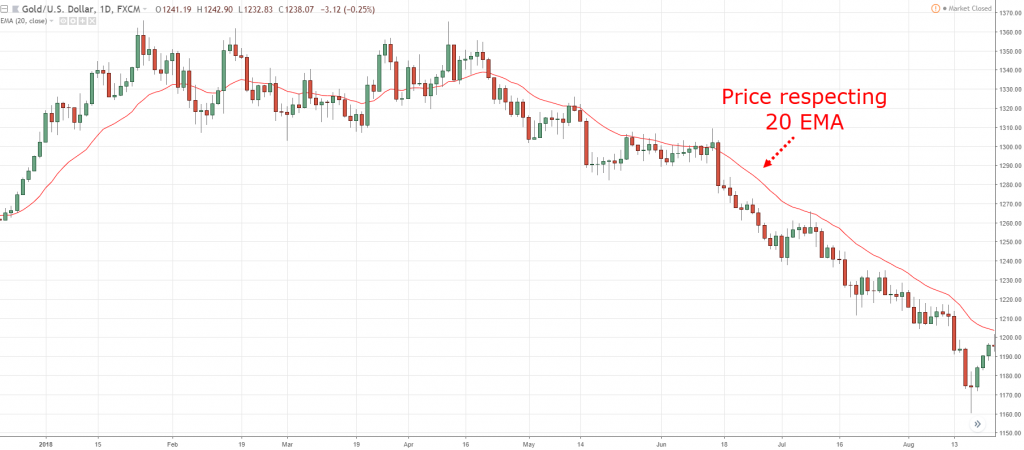
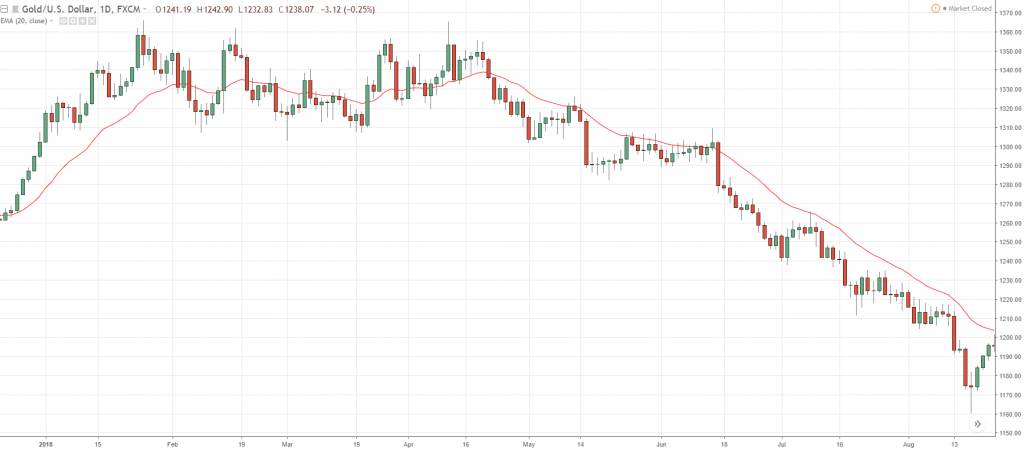
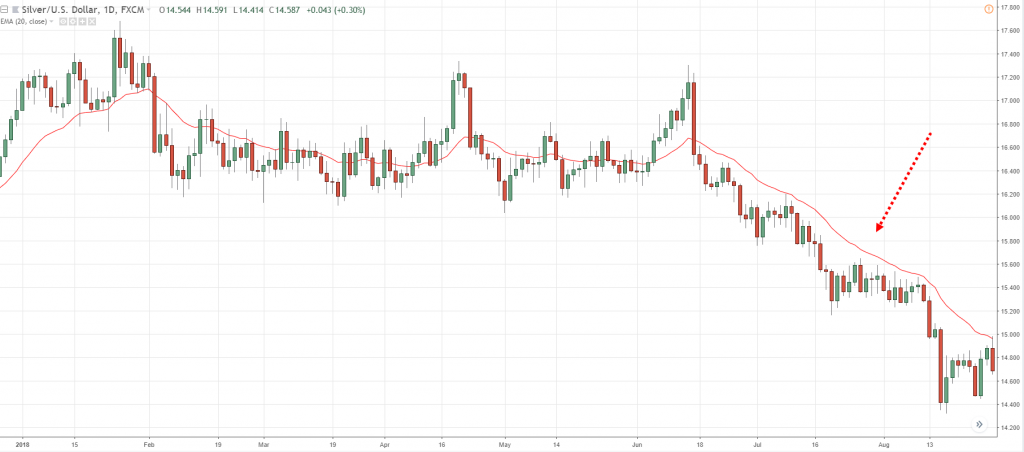
It's when the price respects the 20-period moving average:
This over here is the 20-period moving average.
As you can see, the market remains below it.
This gives you a big clue that this trend is actually strong, and that's why it has been consistently below the 20 MA.
How would you trade a strong trend?
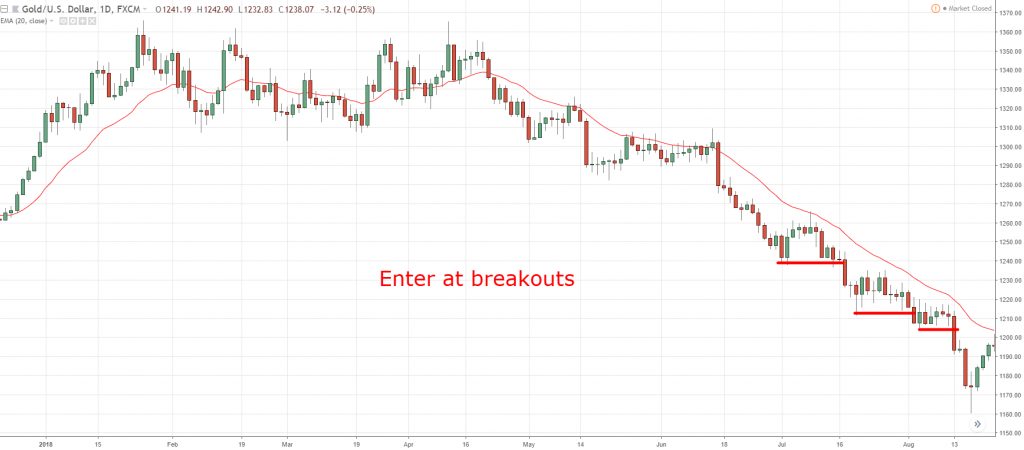
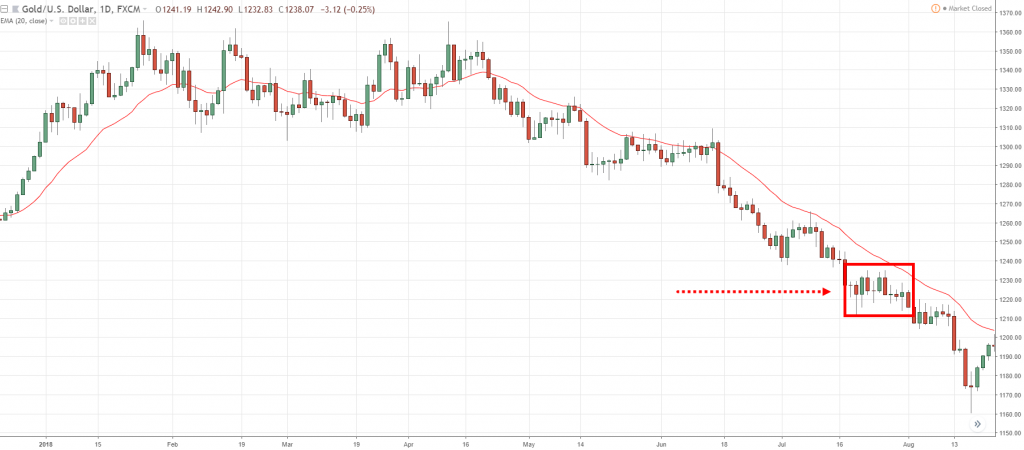
Ideally, you would want to trade a breakdown or a breakout:
In this case, since it's a downtrend, you want to trade the breakdown of the swing low.
Why do you want to trade a breakdown?
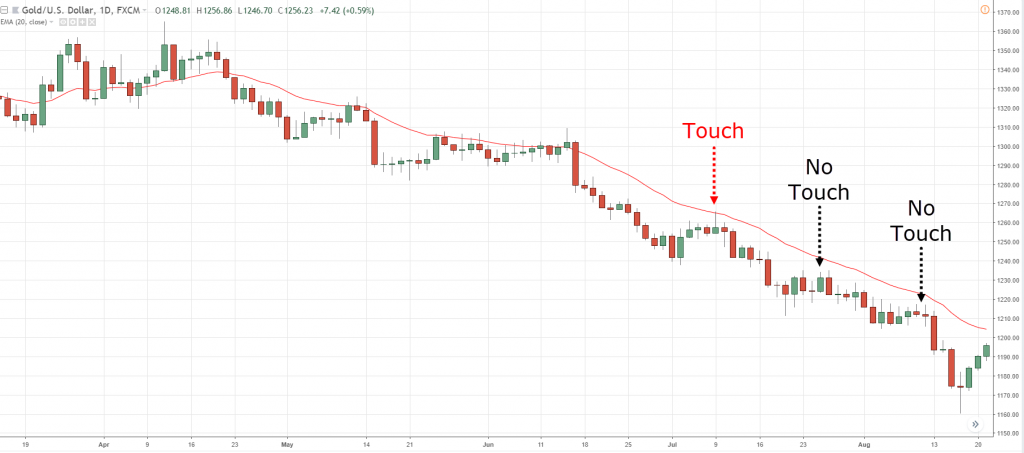
Because in a strong trend, seldom does it do a nice pullback for you to time your entries.
Seldom does it retest a moving average.
Seldom does it retest resistance.
If you look at this, it only tested the moving average over here once:
And if you are waiting for it to come to the moving average or the previous swing high…
You will be disappointed because the market, is in a strong trend!
That's why it doesn't have a deep retracement.
If you want to trade pullback or retest or key levels, again you will be disappointed.
That is why I say that in a strong trend it's ideal to trade breakouts or breakdowns.
In this case, you can just simply go short when the market breaks below the swing low.
And to set your stop loss, ideally, you want to set it beyond the 20MA.
Don't just put it above the 20MA because what could happen is that the price can spike up higher and then collapse lower.
So, give it a distance, give it some buffer above the 20-period moving average.
The second type of trend that I want to share with you is what I call a…
Healthy trend
How do you know that a trend is healthy?
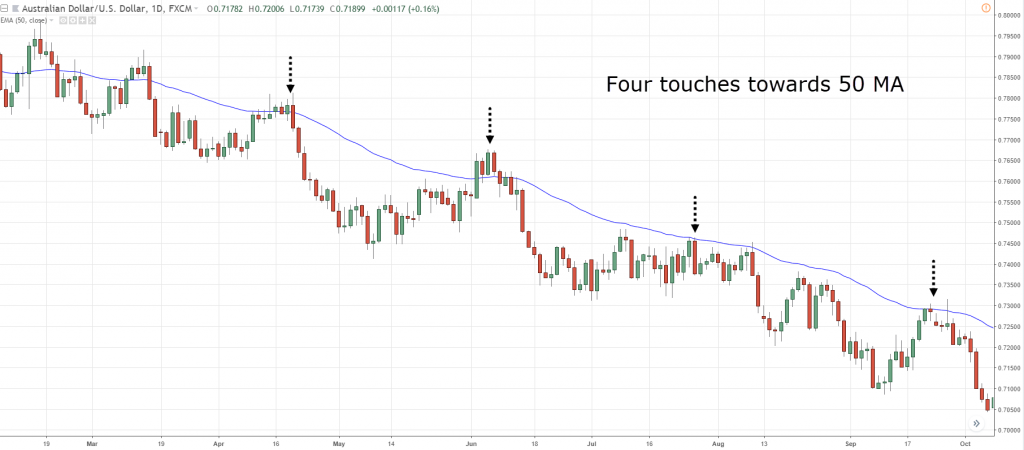
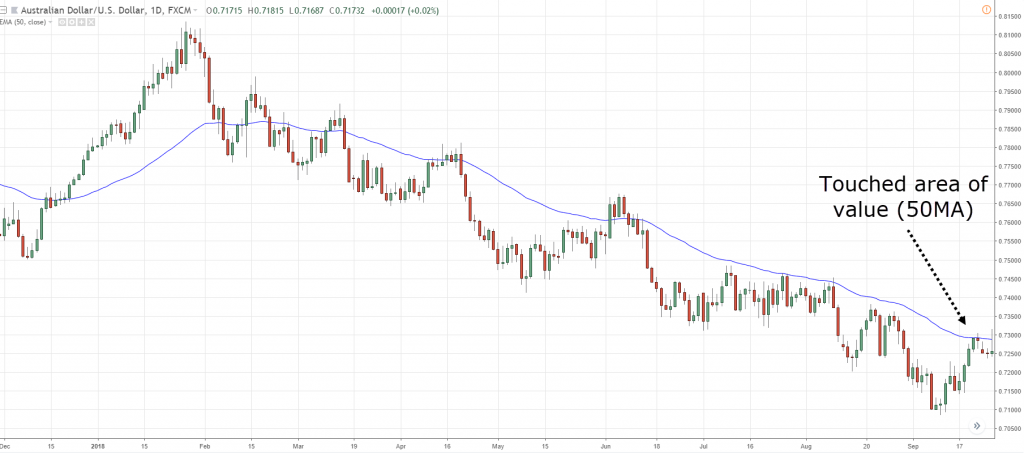
A healthy trend usually has a clear pullback towards the 50-period moving average.
This means that you can actually time your entry towards the 50-period moving average.
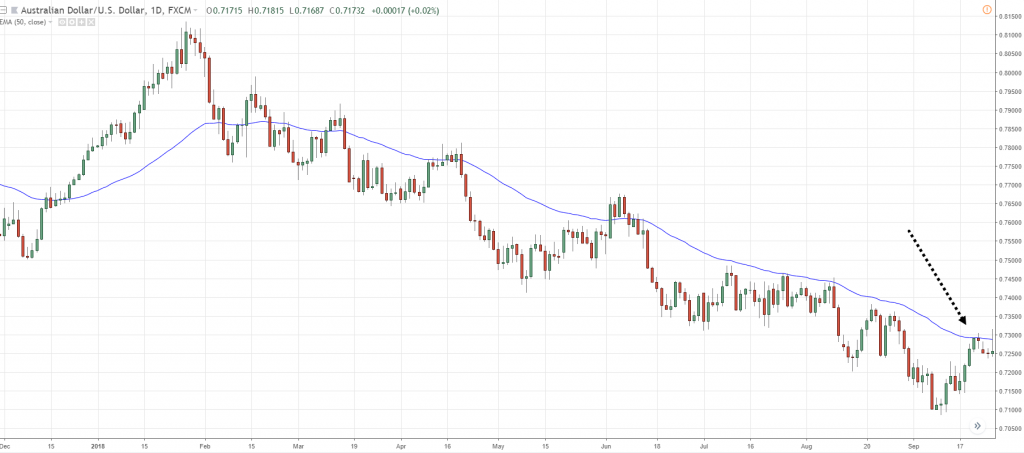
If we look at AUD/USD over here:
The market has tested the 50MA four times.
You can see that in a healthy trend...
What you need to do is wait for the market, be patient, and let it come back towards the moving average.
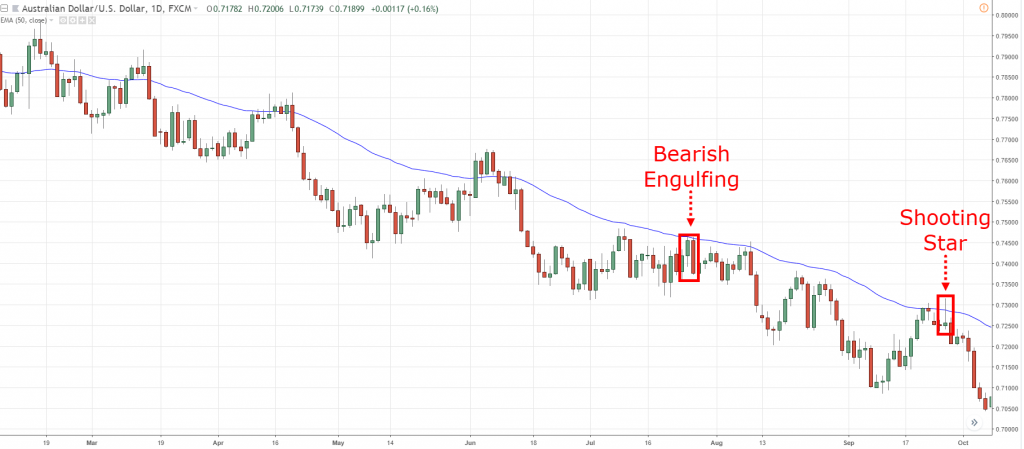
You can see that we have a bearish engulfing and a shooting star pattern before closing near the lows of the candle:
These are all entry points that we can use to trade in a healthy trend.
And one tip that I want to share with you is that…
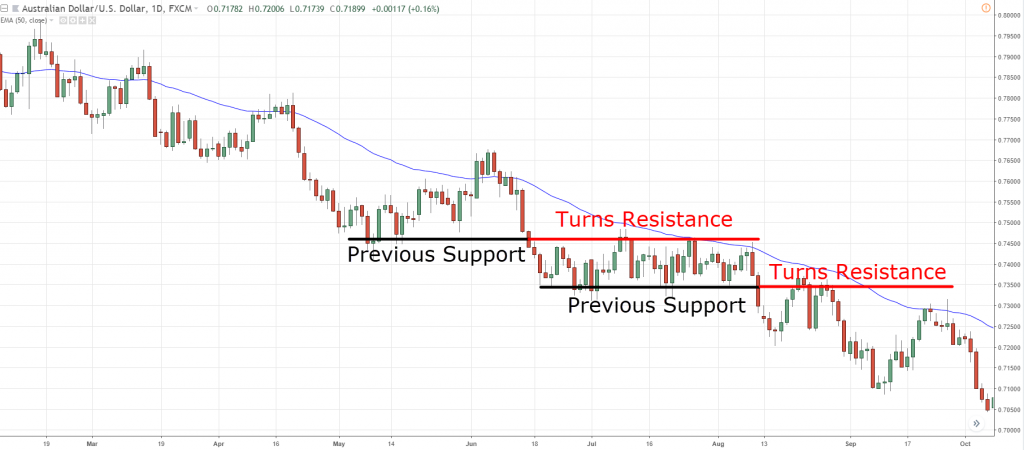
Based on my years of trading trends, I realized that in a healthy trend the market tends to respect previous support turned resistance or previous resistance turned support:
You can see that on top of it...
A confluence factor that you can look at is not only the 50MA, but also at previous support turned resistance.
This is where there's a good chance of the market reversing in a healthy trend.
And to time your entry to just wait for a reversal candlestick pattern and you can time your entry.
And again, you don't want to set your stop loss just above the moving average.
Give it some buffer, give it some distance away from it.
You can use an indicator like the Average True Range or just eyeball or give it some buffer.
This is how you would go about trading the healthy trend.
So, what I don't recommend in the healthy trend is that you don't necessarily want to trade breakouts.
Why is that?
Because if you look at this...
In a healthy trend the market tends to pull back towards a moving average:
So, if you were to trade the breakdown of the swing low...
You can see that the market went slightly in your favor and then you have to swallow deep pullbacks against you.
This would happen often if you were to trade breakouts on a healthy trend.
You would have to endure quite a sharp pullback when it comes back towards the moving average.
It doesn't happen often, but more often than not it will revert back towards the mean.
So, this is why I don't really recommend trading in breakdowns or breakouts in a healthy trend.
It's much better to time your entry and wait for a pullback, either towards the moving average or previous support and resistance.
And moving on, the last type of trend that I want to talk about is the…
Weak trend
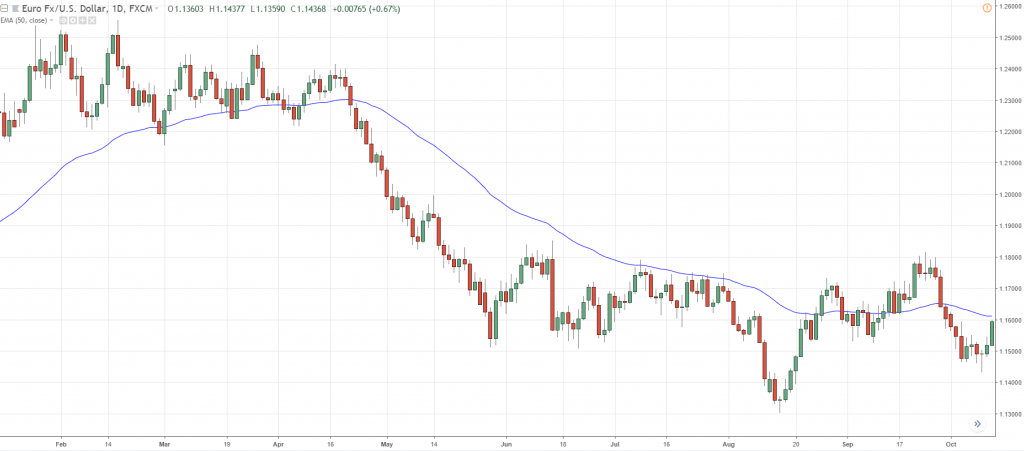
For example, a weak trend usually occurs when the price doesn't respect the 50-period moving average anymore.
It tends to exceed beyond it.
You can see it over here on the EUR/USD:
Price has been respecting the 50MA and then it trades beyond it repeatedly.
So, how do you actually trade the weak trend?
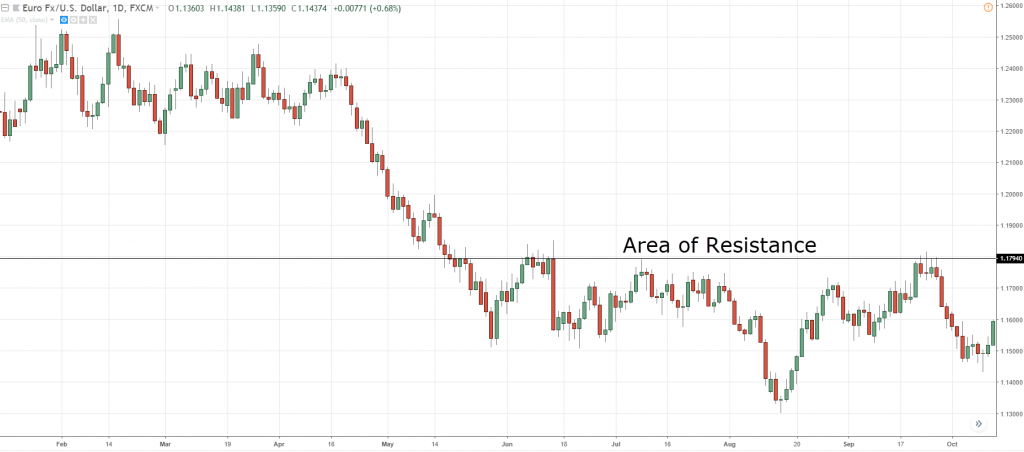
This is where your support and resistance come into play.
For example, based on this chart over here I identified that this is an area of resistance:
What I'll do is I will now time my entries at resistance!
Since this is a downtrend.
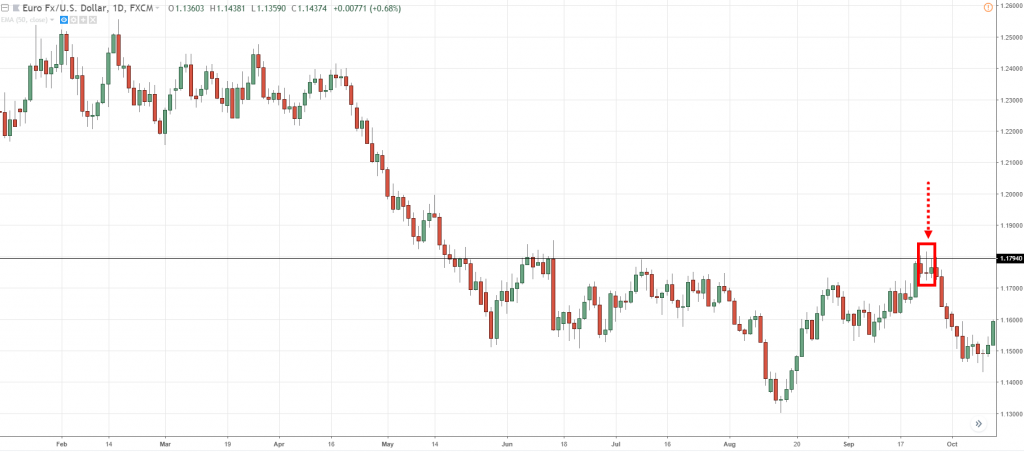
Price comes into the area of resistance and shows price rejection over here:
You have this Dragonfly Doji rejecting the highs.
Then the next candle had a slight bull candle and finally, another candle reverses lower towards the downside with a bearish close.
This is a sign of price rejection and if you look at this, you can look to go short again.
And set your stop loss a distance away from the highs.
And this is how we actually trade the weak trend when the price comes towards an area of value like support or resistance.
So just to do a quick recap…
Strong trend: Price tends to respect 20MA
Ideal to trade breakouts
Healthy trend: Price tends to respect 50MA
Ideal to trade pullback towards 50MA
Weak trend: Price tends to trade beyond 50MA
Ideal to trade pullback towards Support
So now, just an additional quick tip to share with you…
When not to trade in strong trends
The concept of trading breakouts for the weak trend is that although you are trading breakouts...
You want to use a little bit of discretion over here:
This is the same thing as the healthy trend.
If you notice that the price has already broken out over here:
Are you sure that you still want to chase the market at this point, even though it's a strong trend?
Even though it's breaking down, are you sure you still want to go short?
Because if you think about this, right now the price is very far away from the 20MA.
And if it decides to snap back, pull back towards the mean like a rubber band...
You have to potentially endure that retracement.
So, is this a good trade that you want to take?
I don't think so, right?
I don't want to be trading when the price is so far away from the moving average.
If you compare that to this, let's say over here:
If you are to go short, it is much nearer towards the 20MA so even if the pullback were to come, you don't have to endure that much pain.
Whereas you come back to this portion over here:
This is a lot of distance that you have to endure in a pullback.
So again, you want to watch where price is relative to the moving average.
If it's too far away, I usually suggest the trader to wait for the price to come to you.
Okay? This is important.
So that's the first tip that I want to share with you.
And are you interested for an additional tip?
Okay, let me share this with you…
How to use multiple timeframes to enter a trend
So, what I've just shared with you as entry points are:
1. We trade breakouts.
2. We trade the pullback by using very basic reversal candlestick pattern.
But what I want to share with you is more advanced stuff.
And it's ideally for traders who have really been trading for at least a year or more.
It's because you can actually use multiple timeframes to time your entry.
So, let me share with you an example and look at AUD/USD:
You know that it's in a healthy trend and you see that AUD/USD, came into an area of value (50MA).
One way you can go about it is that traders can just go short based on this reversal candlestick pattern!
Alternatively, if you want to better time your entry and have a better risk to reward.
You can down to a lower timeframe like the 4-hour and time your entry:
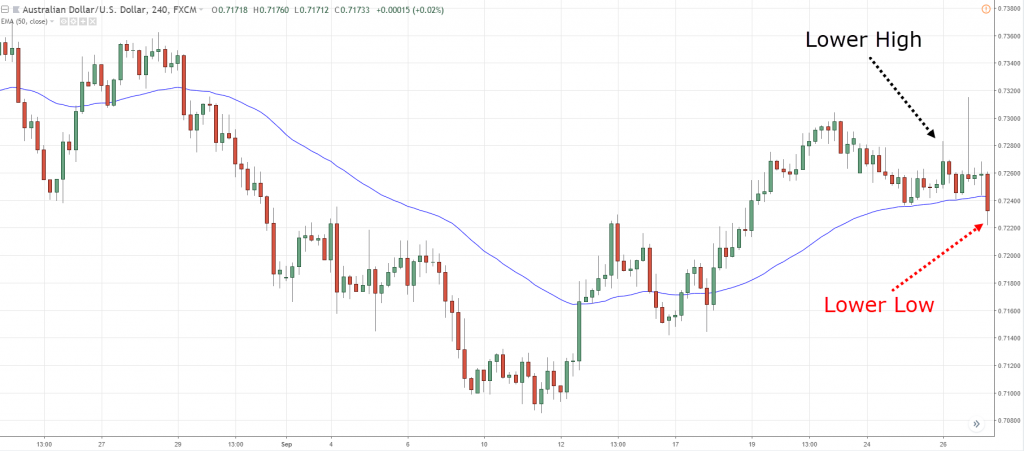
Notice that the market has actually formed a lower low and a lower high.
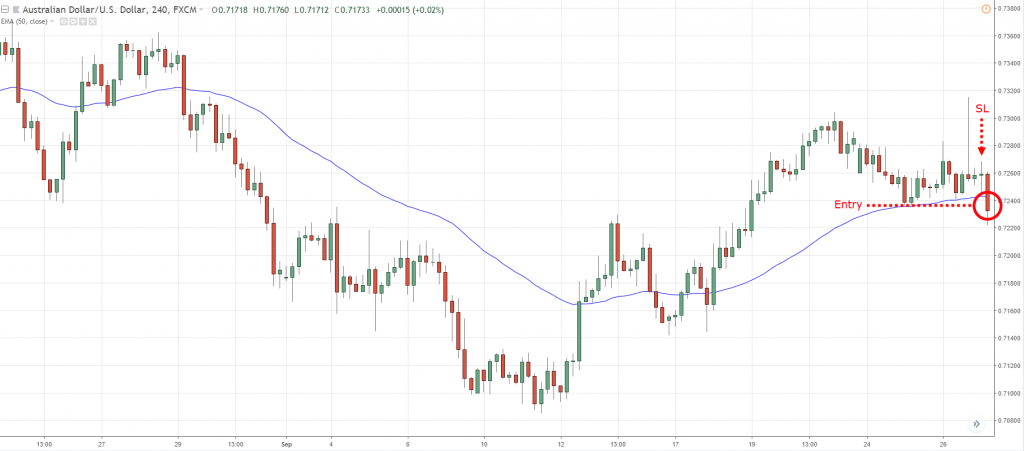
At this point in time, when the market actually breaks and closes below the swing low, you can go short and set your stop loss just a distance away from this high:
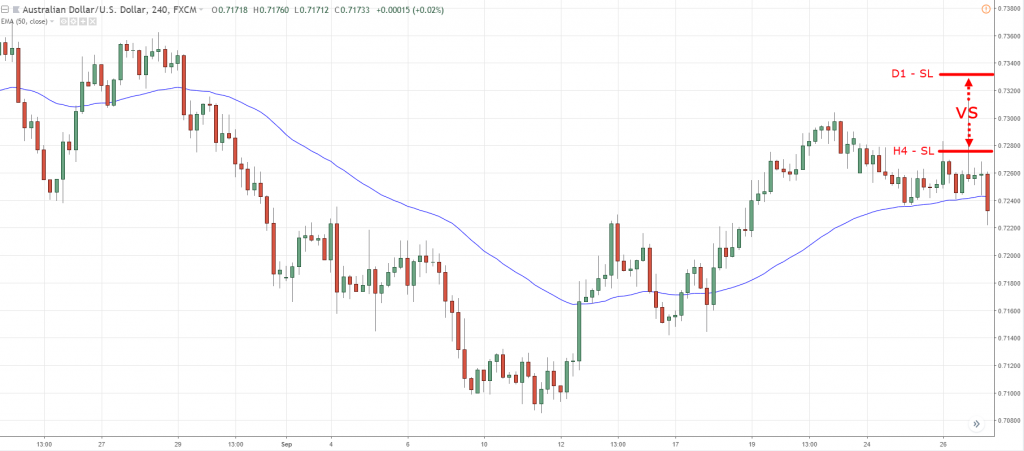
So instead of originally when you're trading off the daily candlestick pattern, the daily price action, your stop loss would go a distance beyond the high shown in the example.
But right now, if you go down to the lower timeframe.
You can actually reduce the size of your stop loss and improve your risk to reward!
You go short on the break of the lows and set your stop loss just a distance above the highs.
This is now your stop loss distance, instead of the original distance which is much further over here:
This actually improves your risk to reward on the trade, and this is what I call…
Reading the price action…
Identifying weakness…
And then getting a tighter stop loss on your entry.
This concept can be applied whether it is a strong trend, healthy trend, or a weak trend.
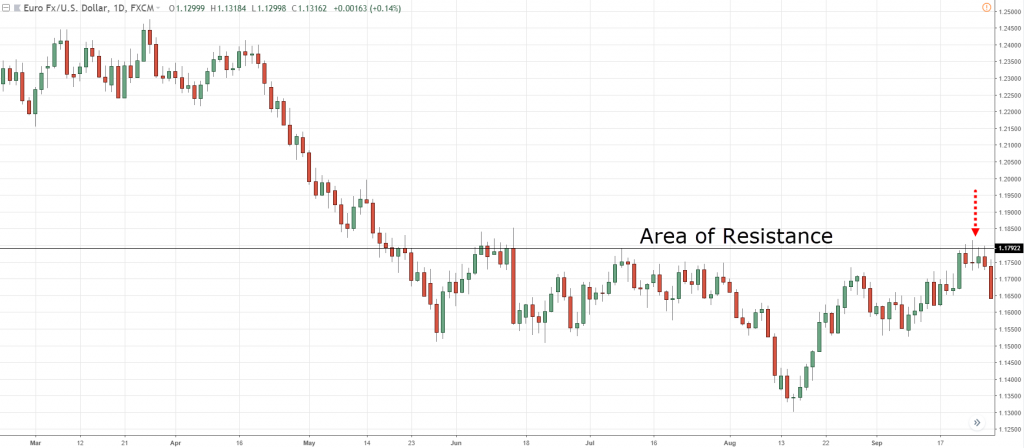
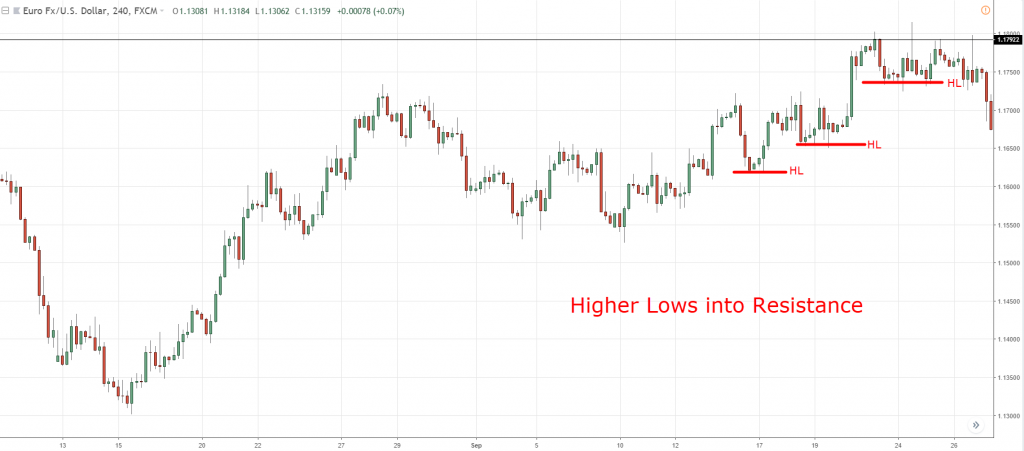
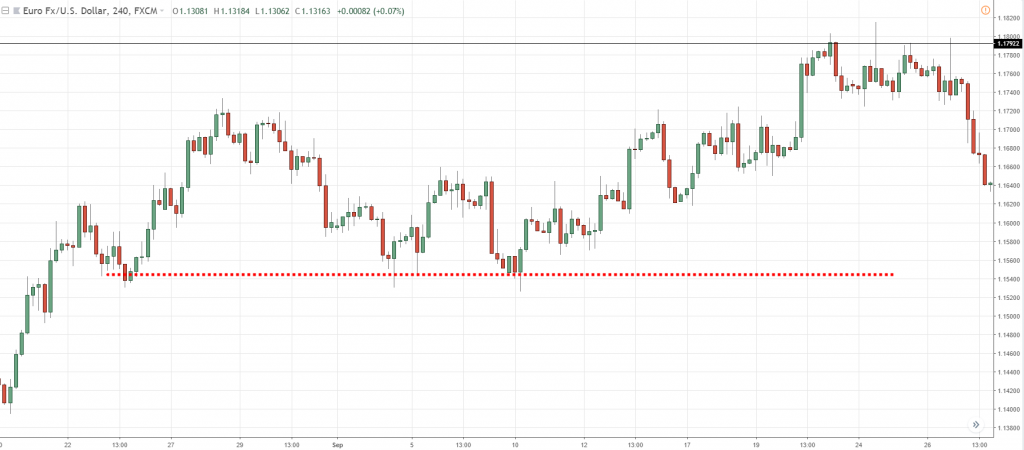
If you look at EUR/USD:
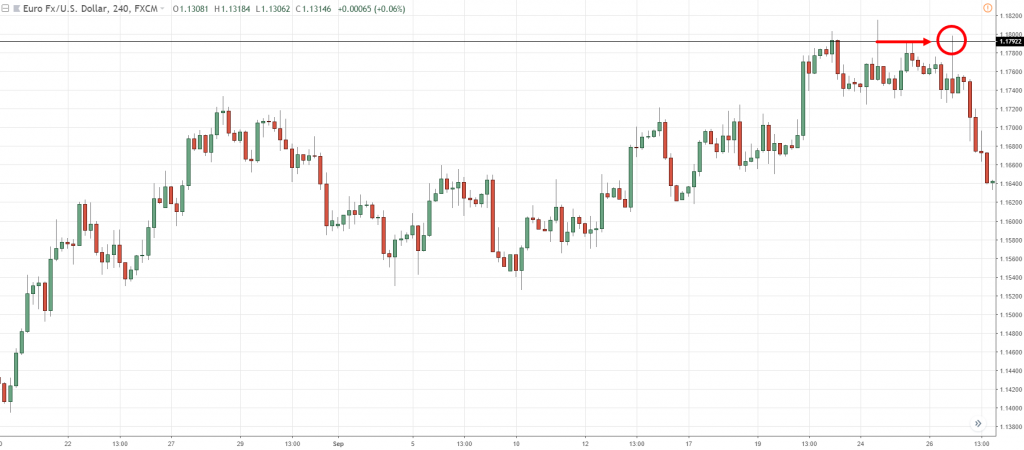
Notice over here the market came into this area of resistance.
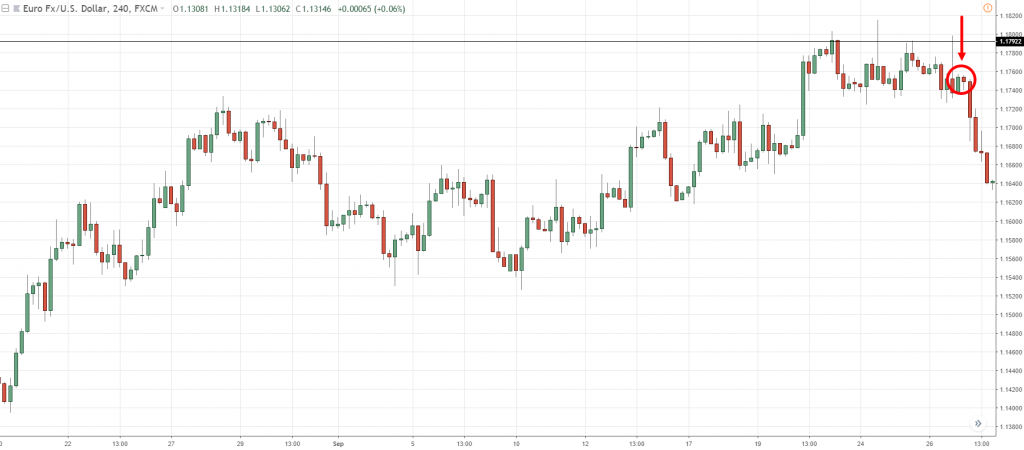
Of course, traders can trade this daily reversal candlestick pattern.
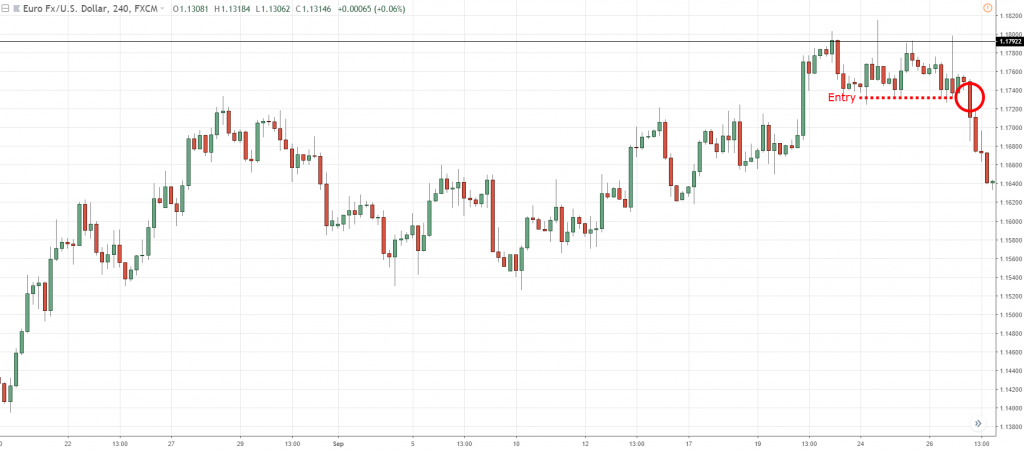
Alternatively, if you want a better risk to reward on your trade, you can go down to the 4-hour timeframe and look for what I would call a “break of structure.”
Again, you can see over here:
You have a series of higher lows and higher highs.
But over here at this structure, things have started to change!
The highs and lows are pretty much equal now.
And the first clue that tells you that the sellers are in control is when it actually broke and closed below this area of support:
And again, you can just reference your stop loss from this swing high:
Or from this swing high over here:
Again, you would have a tighter stop loss compared to trading it on the daily timeframe.
This is a very powerful entry technique that involves the use of multiple timeframes.
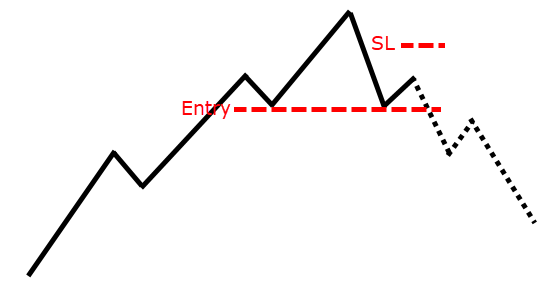
Basically, if you are looking to short, what you are looking for is that market will be in an uptrend on the lower timeframe
Then it breaks the previous low swing structure, then, you can go short on the break of the swing low.
Stop loss is just set a distance away from the highs.
You can see that you have a much tighter stop loss in this case.
And hopefully, you can ride the whole trend lower:
And on top of it, if you think about this…
You are leaning against the structure on a daily timeframe like this EUR/USD trade:
You are leaning against the resistance on the daily timeframe.
And on the AUD/USD:
You are leaning against the 50-period moving average which is another market structure that the market has respected.
This is an additional tip for you.
I believe it would really help your trading.
It can be applied whether you are trading support resistance, a weak trend, a healthy trend or even a strong trending market.
If you don't believe me, let me share with you another example.
Just a final one, okay?
So powerful that I have to share more with you.
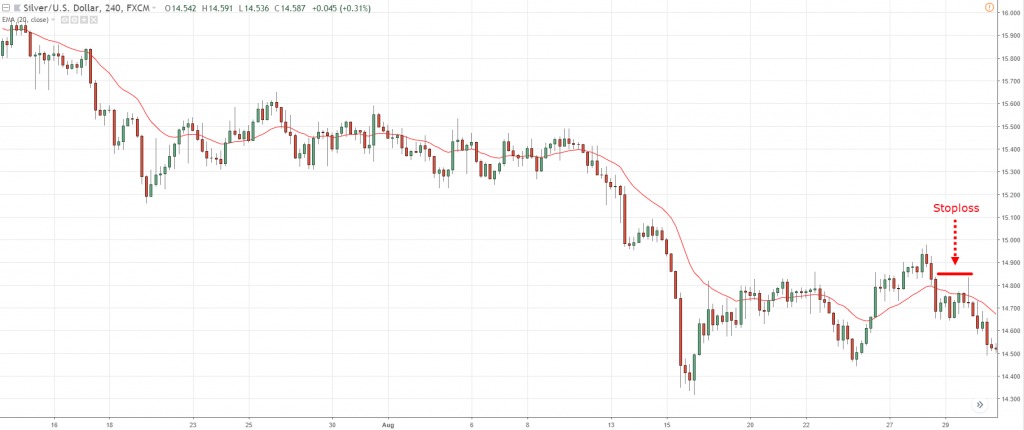
This is the chart of silver:
If you look at this 20MA on the daily time frame.
You see the same phenomenon.
Again, you can just trade off the price rejection on a daily.
But if you want a better risk to reward on your trade…
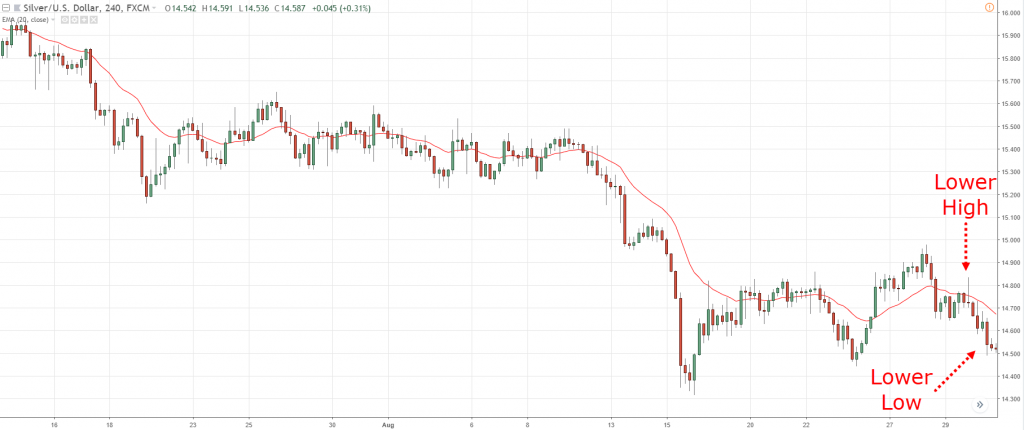
You can go down to the 4-hour time frame and just look for that break of structure pattern I mentioned, which is over here:
Notice over here this is a lower high and lower low!
You’ll to go short when the price break below this lower low, stop loss I just set it a distance away from this high:
You can see in this case you have a much tighter stop loss and a better risk to reward on your trade.
With that said, I have come towards the end of today's video.
Just a super quick recap...
Recap
- Strong trend tends to respect the 20MA. Ideal to trade breakouts.
- Healthy trend tends to respect the 50 MA. Ideal to trade the pullback towards the 50MA or previous support and resistance.
- And a weak trend, the price tends to trade beyond the 50MA. Ideal to trade a pullback towards a market structure like support or resistance.
- Then we talked about trading breakouts. You want the price to be near the moving average, as near as possible.
- And finally, we talked about the break of structure technique, how you can go down to a lower timeframe to better time your entry and get a better risk to reward on your trade.

