#2: Moving Average Trading Strategy (That Actually Works)
Lesson 2
Moving Average Trading Strategy
In this video, you'll learn a moving average trading strategy that works.
And it’s not a moving average crossover strategy.
I think there is an enough of that on the internet, right?
And instead what I'm going to teach you, or rather what you would learn is a moving average strategy that teaches you how to go long on a pullback.
This means you are trying to buy low and sell high!
And I apply this to the Forex and futures market it works well for me.
But, I've also seen traders you know using this similar strategy in the options and the stock markets.
To give you a general idea of how it works is that, first and foremost what you'll do is you'll identify an uptrend.
And this strategy seeks to take advantage of the pullback of the existing uptrend.
This means that you're trying to get to long on the pullback;
And I would show you shortly on how I go about achieving this.
With that said right let me lay out the criteria that I look for when I trade this moving average trading strategy:
- Define the long-term trend. If the price is above the 200-period moving average, I will look to long only.
- I will define the area of value in the existing trend. What I like to use is the 50-period moving average.
At this point in time, I know some of you might be thinking, “Hey, Rayner, why do you use the 50-period moving average?”
"Why not the 49, 51, etc?”
Here is the thing…
The area of value (the keyword is the area) does not really matter whether you use the 55-period moving average, the 45 or whatsoever.
It's an area you are not dealing, not a specific line.
The reason I use 50 because many traders look at this moving average.
And it tends to become a self-fulfilling prophecy, so I use the 50-period moving average.
The second reason is that when you use a 50-period moving average.
You are able to identify swings in the trend easily.
If you use the 10-period, or the 20-period moving average chances are those type of trends are too strong.
And you would sell them or rather it would be difficult to actually identify the swings in such a strong trend.
When you use the 50-period moving average, it is much, much easier to identify the swing in the trend.
Let me explain what is a swing...
Here's what I mean:
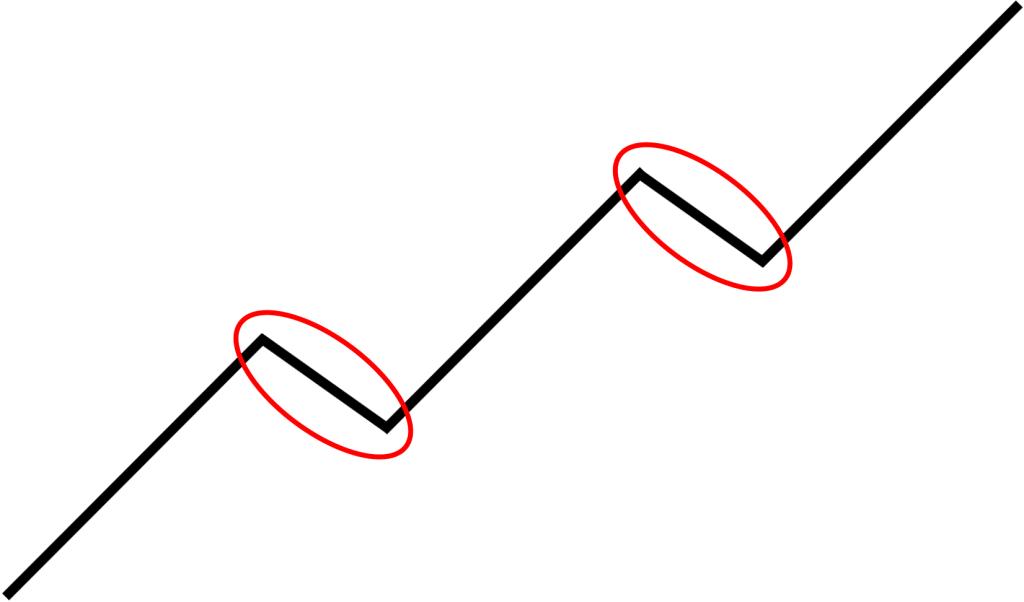
It’s much easier to actually identify this part of the trend compared to if you are using the short-term moving average.
Trading a stronger trend, the pullback is sometimes very shallow, very slight, and then it continues higher!
So, it's very difficult to trade the pullback when the trend is strong.
This is why I use the 50-period moving average!
The next thing I will talk about are:
- Entries. How I look to enter this particular trading setup. The general idea is that you want to let market reverse in your favor before you enter the trade.
- Stop loss. So you don't get stopped out of your trade too early. Traders tend to get stopped out of their trade and then see the market continue back in their favor.
- Targets. It really depends on whether you are trying to capture a swinging in the trade or whether you want to ride the long-term trend.
Let me walk you through what you have learned:
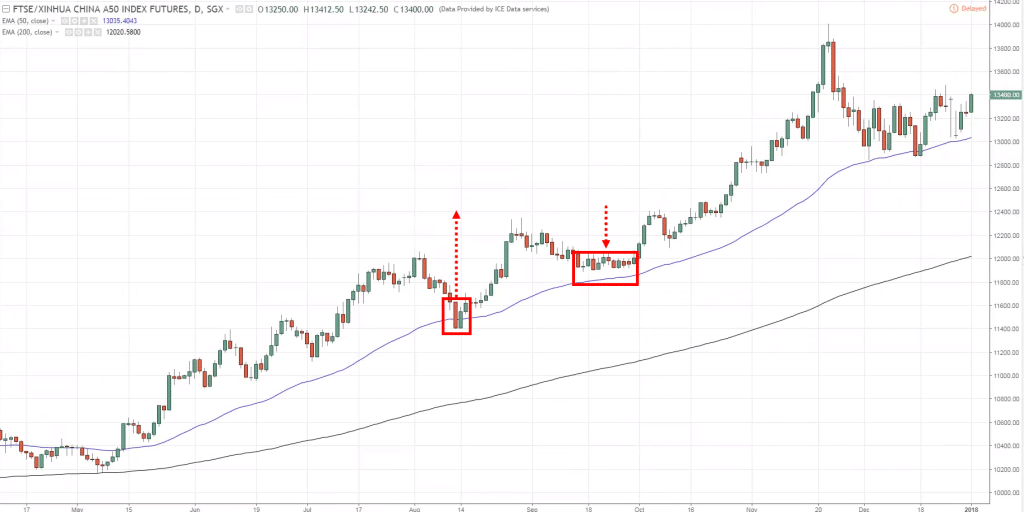
First and foremost, how do you I define the long-term trend?
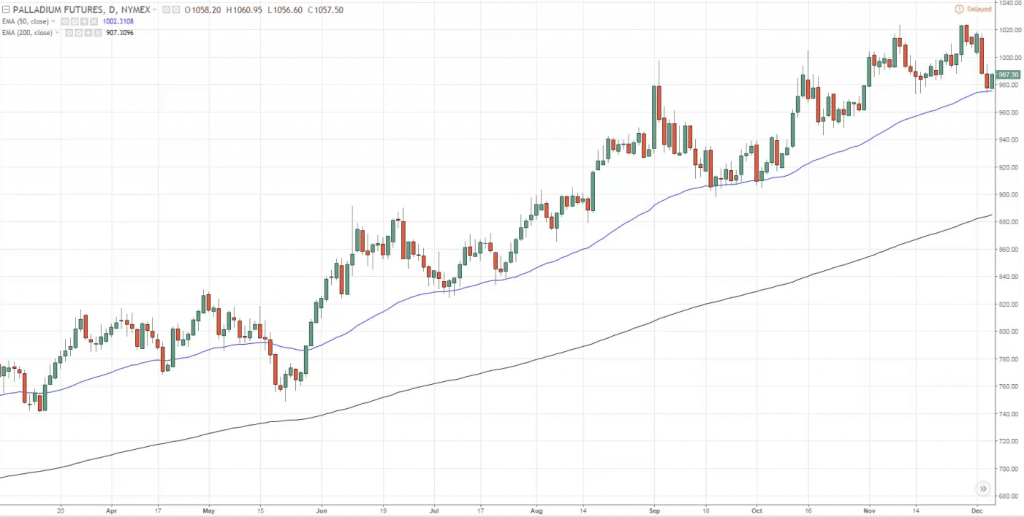
The black line is the 200-period moving average.
The price is above it so I look to go long only.
Second, where is the area of value?
I use the 50-period moving average, which is the blue line.
You can see that the price respecting it.
Bounced once, twice and it came back for the third time.
At this point, I'm looking for an entry because clearly, this market respects the 50-period moving average!
This is the area of value!
So, what do I look for in the entry?
Actually, it is very simple...
You can look for simply a higher close in your intended direction.
That's the most straightforward and simple approach.
But if you ask me, the best kind of trading setup is where you get a strong price rejection.
The price could come into the level and then it trades lower only to get rejected and close above.
If you get this type of strong price rejection, you have better odds of the trade working out.
Usually, it can be in the form of a strong bullish hammer, bullish engulfing pattern and stuff like that.
Usually, the stronger the price rejection, the greater the chance the market will reverse back towards the upside.
But what about for stop loss?
I would say be careful of just putting your stop loss just belong the lows.
Because it can get triggered very easily.
What I like to do is to give it some buffer.
If you identify the swing low give it some buffer and just put it a distance away from the swing low.
It gives your trade more room to breathe, and you don't get stopped out prematurely.
If you want to learn more go and watch one of my videos here:
"How to set a stop loss so that you don't get stopped out unnecessarily"
It's on YouTube right, and I go into more details over there.
With that said, that is for your entry and your stop loss.
But what about your target?
For targets, you want to take just a swing in the market.
If you want to take a swing, go long on the pullback.
And then capturing the move up until the previous high.
Whereas the trend follower or position trader...
You are trying to capture the entire move and only exit when the market shows signs of reversals.
You have to know, which approach you are trying to apply and then use the right technique for the right goals you have.
For example, let's say you are trying to capture a swing in this market.
What you want to do is identify areas or level where there will be potential selling pressure coming in!
On the previous high, you would expect selling pressure to come in because this a swing high, this is an area of resistance.
It makes sense to set your target profit just before the resistance area.
Why don't you want to set it above the resistance area?
Because you do not want to fight through the obstacle to get through the level!
This is where sellers could potentially come in!
By putting your target at the resistance, you are making yourself a great disadvantage by trying to punch through a wall.
You want to set your target right just before the resistance area.
You have a better chance of getting your other view for swing trading.
Now, what about trend following?
What if you want to ride the long-term trend how can you go about it?
One approach again to do is to reference from this 50-period moving average.
This means that you would only exit the trade if this market closes below the 50-period moving average!
Looking back at the example, your swing trade would have gotten you out of the trade.
Whereas, your trend following trade would still be in the move.
For trend following trades, you would only exit if the market comes down and finally closes below this 50-period moving average.
These are a couple of techniques that you can use to so-called “manage your trade.”
Whether it is a swing trade or a trend following trade.
Just one more example to hit the points that have shared with you, and obviously, the examples that I shared is a cherry picked.
I don't deny it, and the reason I purposely cherry pick this chart is because it's much easier for me to illustrate my point!
But, bear in mind there will be losing trades right this isn't the holy grail.
There will be losing trades, do not think that it's 100%
There will be losing trades be prepared for it and if you want to trade this strategy...
I suggest you demo trade it or forward trade it in the markets first.
Before, you try to risk any money on the line.
Because there will be losing trades, right?
This is one big disclaimer that I want to put out:
Again, the same thing right?
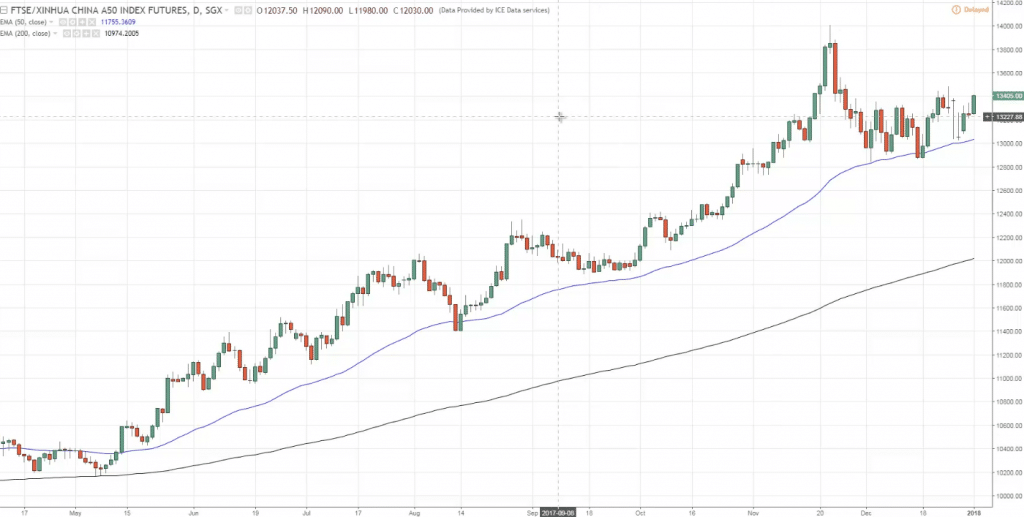
The price is above this 200-period moving average, so you look too long only.
Then I defined the area of value, which is the 50-period moving average.
You can see that it tested it once:
The market traded higher and came back.
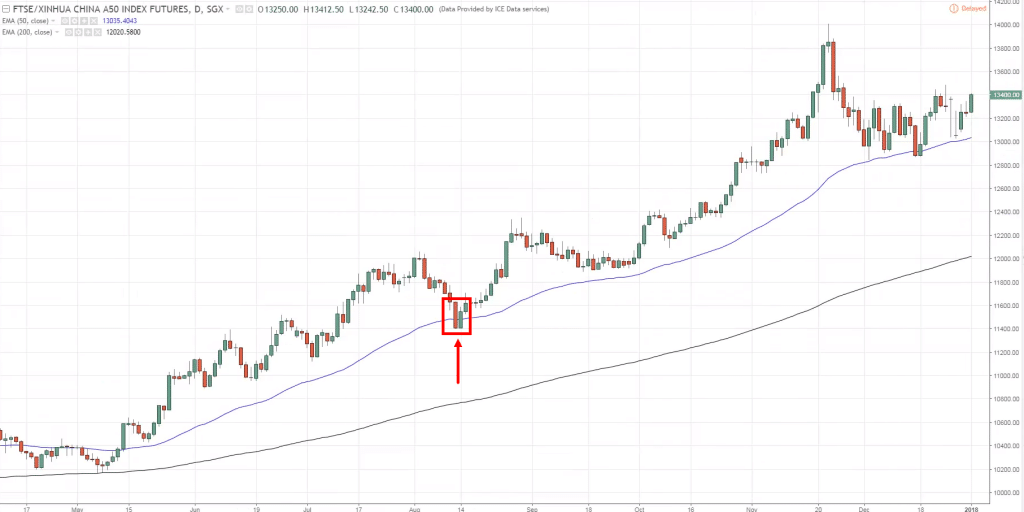
Noticed that it didn't touch the 50-period moving average but, I consider this a second test as well:
Why?
Because, I said, it's an area of value, I did not say a line of value.
So the market could actually trade just before this 50 period moving average or could trade slightly beyond it as well.
This is an area.
I typically look to go long on the third test where you noticed the market retrace:
Then you have this somewhat of a bullish engulfing pattern, market closes higher.
And this will be an entry signal to go long.
For stop loss, I recommend setting a buffer below the low.
For those of you who are familiar with the Average True Range Indicator, you can set it 1 ATR below the low.
As for targets I am looking for a swing trade set-up.
This is a level that potential selling pressure could come in:
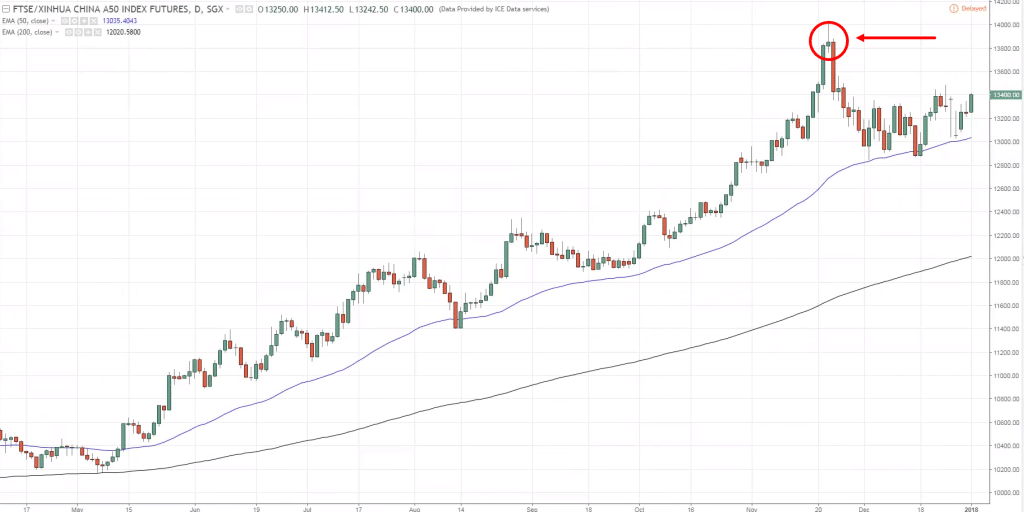
So, you may want to take a profit off the resistance level.
For trend following trade, you could just use a simple trailing stop with the 50-period moving average.
For this one over here:
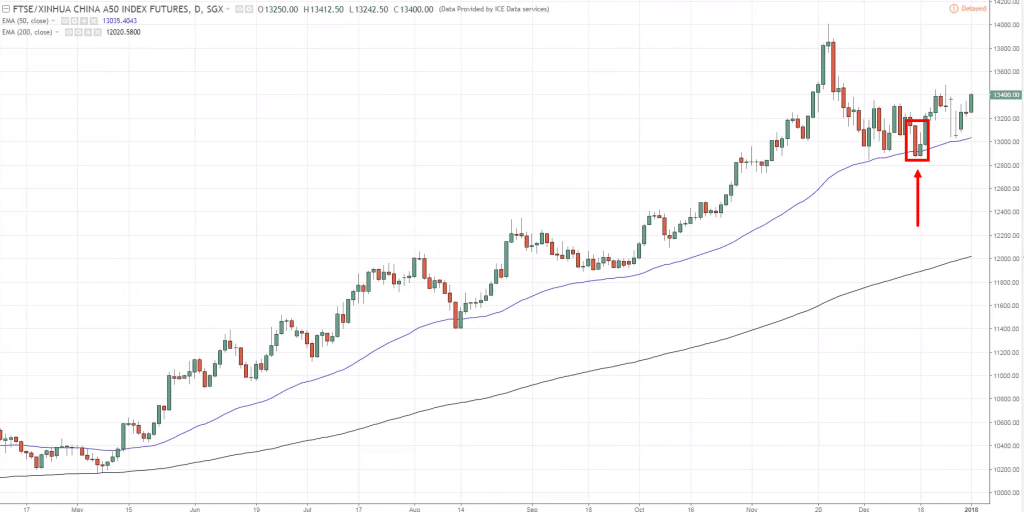
You may or may not get stopped out depending on how strict you follow your trailing stop whether is going to be...
Whether it is the moment that the candle closes below the 50MA or whether it is the second candle that closes below the 50MA.
These are things you have to consider when you are trading this moving average trading strategy.
With that said I want to do a recap so kind of you know encapsulate what you have learned so far.
Recap
- Identify the long-term trend. If you are long right the market is above the 200MA I look to long only and vice versa for short.
- To define the area of value I use the 50 periods moving average because of the two reasons I have shared with you earlier.
- The entry. A simple higher close in an uptrend will warrant an entry. But, you can also trade candlestick patterns like the hammer or the engulfing patterns.
- For stop losses. Usually, I give it a bit of buffer beyond the swing low or swing high if you are sure.
- For targets. Depending on whether you are trying to capture a swing or to ride the trend of the market.

