#3: Forex Trading Strategy
Lesson 3
Hey hey, what's up my friends!
In today's market analysis, I think you'll like this one because it's something that I don't usually do.
I take a blank chart.
I plot in my support and resistance levels.
And then share with you my thought process on how I go from a blank chart to looking for a trading setup.
This is something that I believe would help a lot of traders.
Because this technique works across any markets, anytime timeframe.
Definitely pay attention to this.
And after which, I'm going to cover Bitcoin, a market that I believe that one of the subscribers has been asking me to analyze.
We will also analyze Bitcoin.
And towards the final part, I'm going to talk to you about how you should approach trading.
Looking at it from a point system instead of P and L instead of dollars and cents.
I believe that will help you overcome a lot of your psychological barriers that you're facing.
So, today's weekly market analysis is definitely content-packed.
With that, let's begin.
A Forex Trading Strategy That Works In Any Markets or Timeframes
Moving on to this week's market analysis...
I want to do things slightly different.
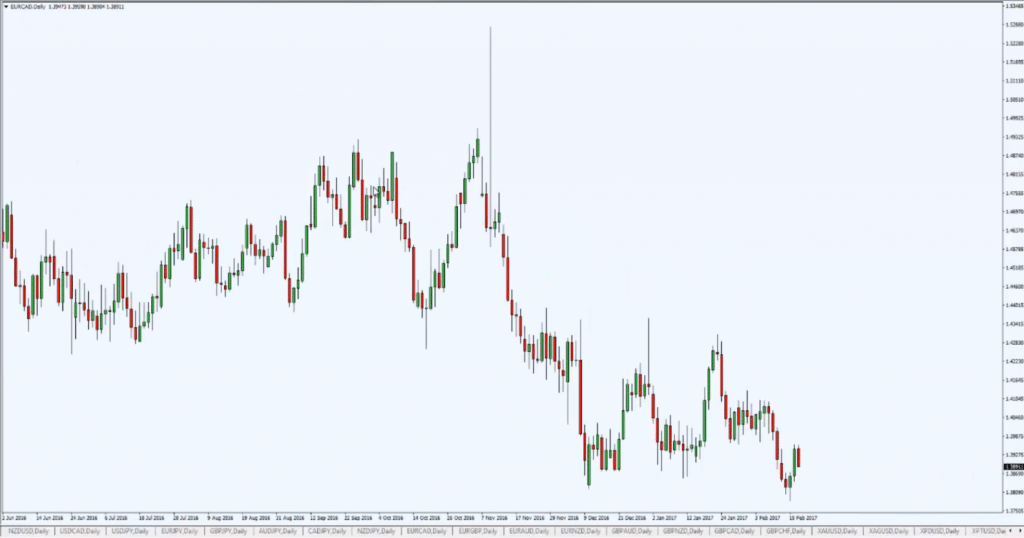
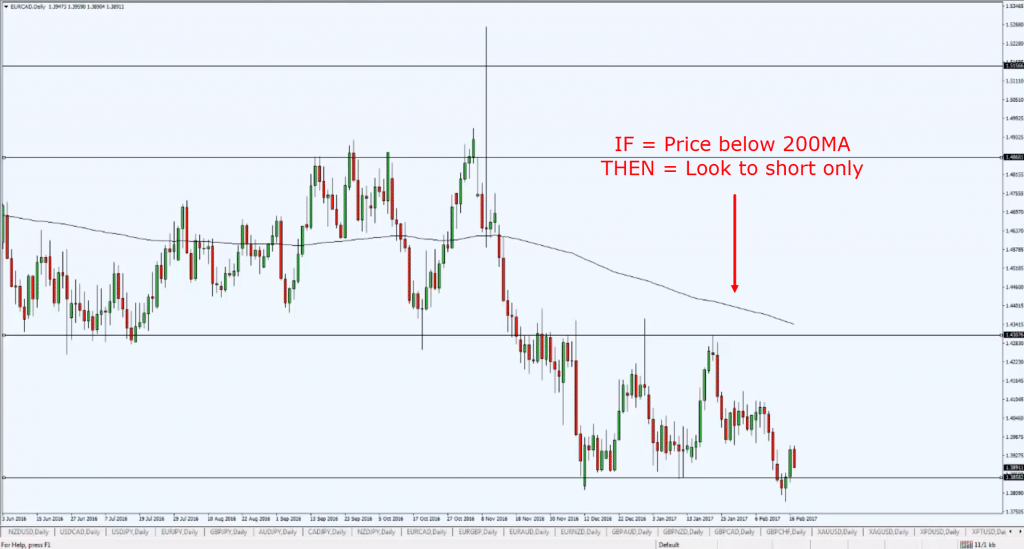
What you see here is the chart of EUR/CAD:
It is a blank chart.
I purposely left it as it is.
The question is, “Hey Rayner, how do you actually, put on a blank chart and make your decisions from there?”
Or basically, what is my thought process whenever a chat pops up on my screen?
The first few things that I would do every time when I see a blank chart.
Is to plot my support and resistance level, because this is so important.
Since I primarily trade off the daily timeframe, what I'll do first is to draw my support resistance on the daily timeframe.
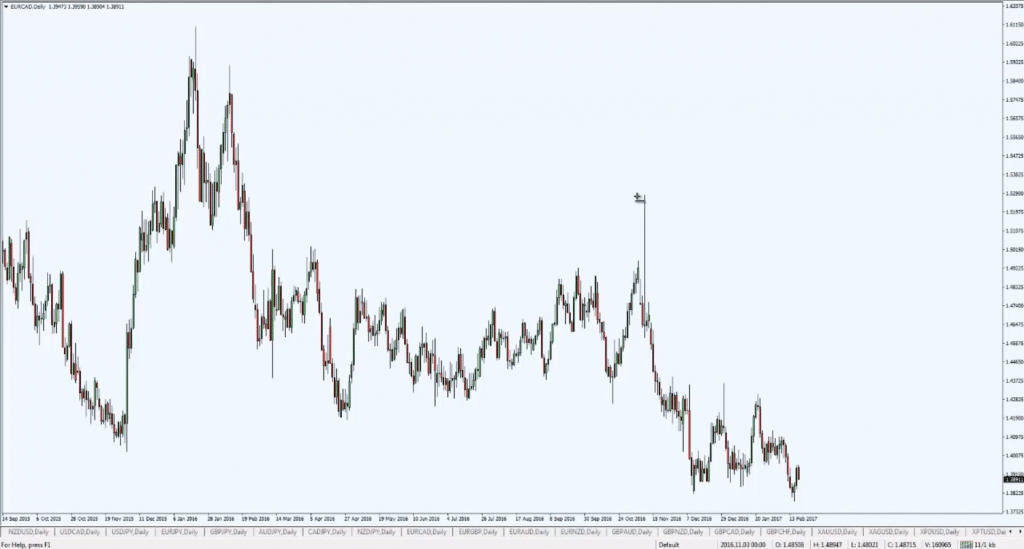
I like to zoom out first so I can see the big picture, and to encompass more price action into this chart over here:
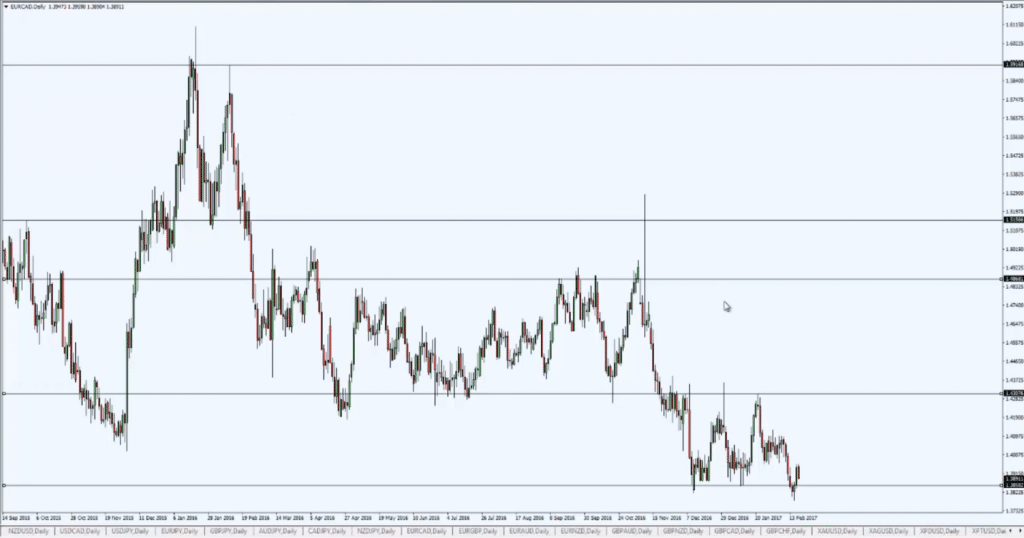
I'll start plotting out support resistance.
And basically, these are some of the key levels that struck out immediately to me:
You can see that the levels that I drew are nothing fancy, nothing complicated.
Basically, the levels that are obvious are basically the levels that I would mark out.
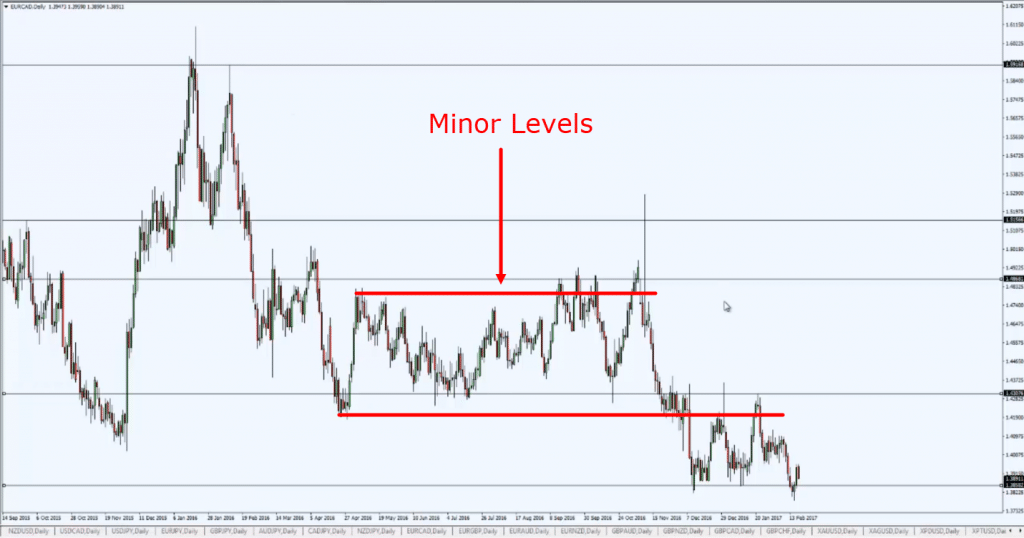
You may be wondering, “Hey Rayner, what about all these smaller levels?”
I can see them, but I don't necessarily want them marked out.
Because if not, my chart is going to look very cluttered with many lines.
So, usually what I do is to plot out the more obvious support resistance level.
For example, this over here:
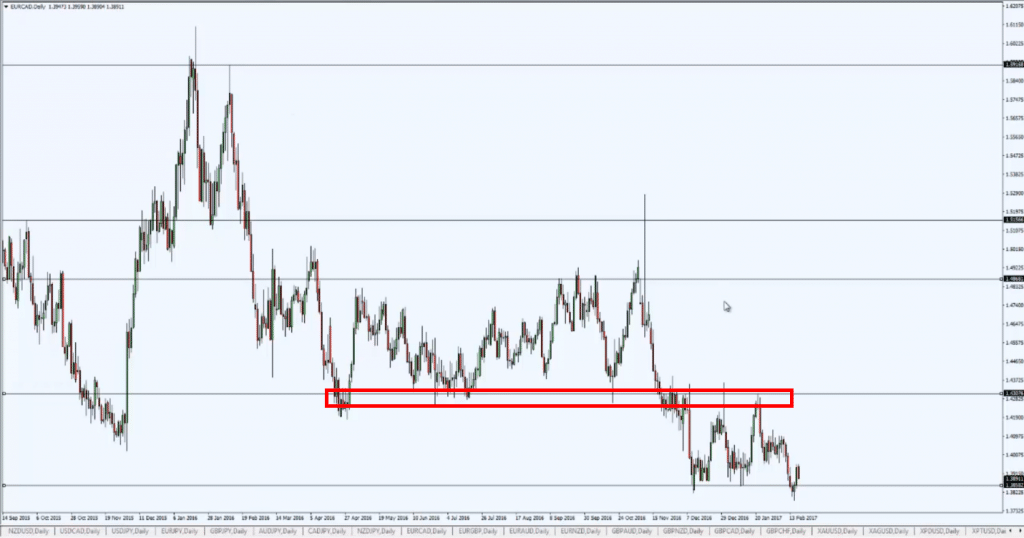
Although I draw a line over here, I'm treating this as an area.
Because you can see that slightly above, there is another low that could potentially become previous support and resistance.
So, I'm treating all these as areas on my chart.
But again, some of you would prefer if you want to do, you can draw this green color box to signify an area:
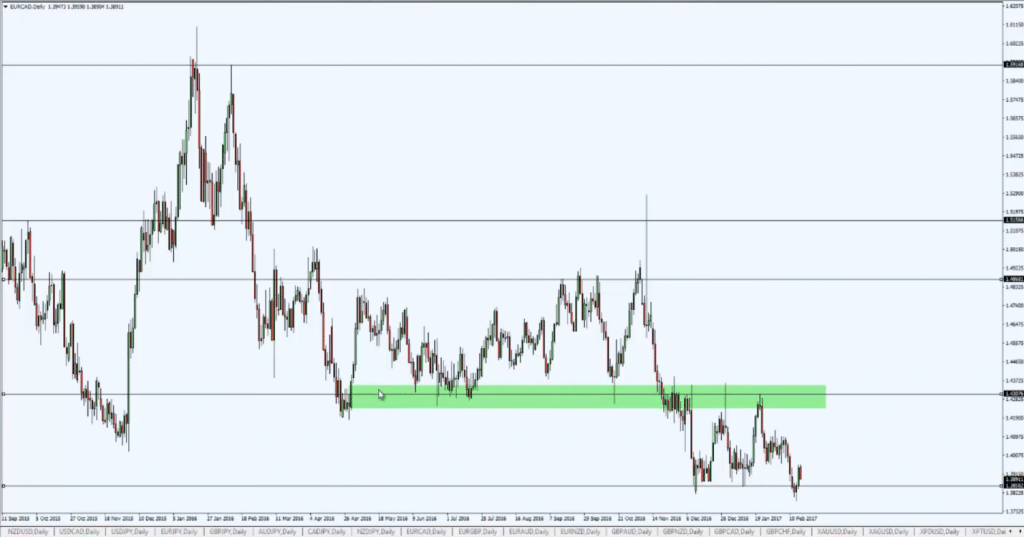
But for me personally, I prefer to have lines on my chart.
It just makes everything looks cleaner and less cluttered.
But again, there is no right or wrong to this.
If you want to draw boxes in there, fair enough.
Go ahead.
Now that I've drawn my support resistance, what is next?
Then the next question is, I want to ask myself, "do I want to be short in this market, or looking too long? What is the trend?"
So for those of you again, who have been following me, who have read those two trading guides.
You know that I would just use simply the 200-period moving average, again in black color:
if the price is below this 200-period moving average, I will look to short.
A very simple trend filter.
There is nothing magical about the 200-period moving average.
There's nothing, fancy about this technique.
And this technique, won't work all the time.
Sometimes it may fail, sometimes the better choice would be to go long.
But more often than not, if you follow this simple filter, you will be on the right side of the market more often than not.
Trading is all about probabilities.
This is a simple filter I use the 200-period moving average.
Nothing magical about a 200, but it's just that it helps define the longer term trend that puts me on the right side of the market.
Now that price is below it, what should I be doing?
Well, I'll be looking to short.
Now you can see that clearly, we have:
- Defined the trend.
- We have actually drawn out of support resistance, to help you identify areas of value.
- What do you expect the price to do?
Well for me, I have nothing to do until price approaches higher into this area of resistance:
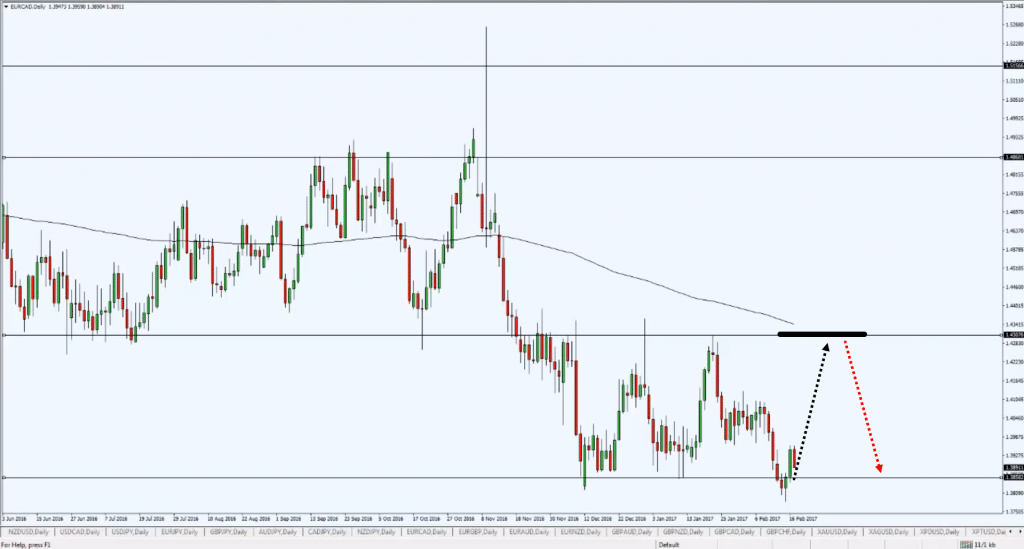
I clearly marked out this resistance.
This is a level that I possibly want to trade from!
And also you have this confluence of this 200-period moving average!
At this point in time, there is really nothing to do till price gets to the resistance level.
Or alternatively, for those of you who trade breakout, you can wait for the price to consolidate for a while at the area of support before taking a short towards the breakdown:
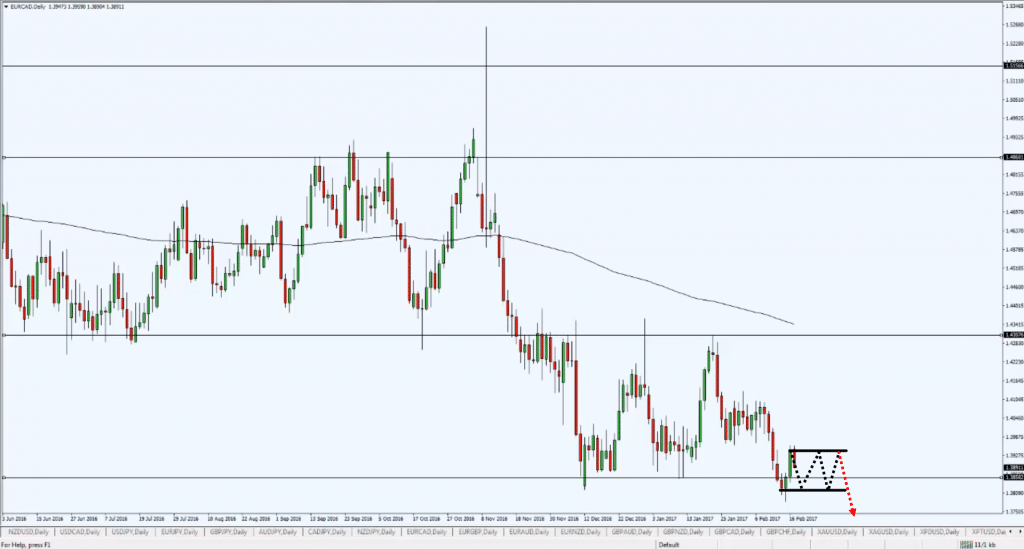
You can see how I'm actually planning my trades once I've got my filter up, and once I've got my support resistance drawn out.
You can see that the flow just pretty much comes naturally.
You already know, which are the levels, the areas that you want to trade from.
And from there you can actually base potential trading decisions that you want to make.
And also, you know which are the areas that you don't want to trade from!
This is basically what I do on a week-to-week, day-to-day basis.
This technique is simple.
It can be applied across the 1-hour time frame if you want to.
Let's see if I get out a 1-hour time frame.
Let me pull up the chart…
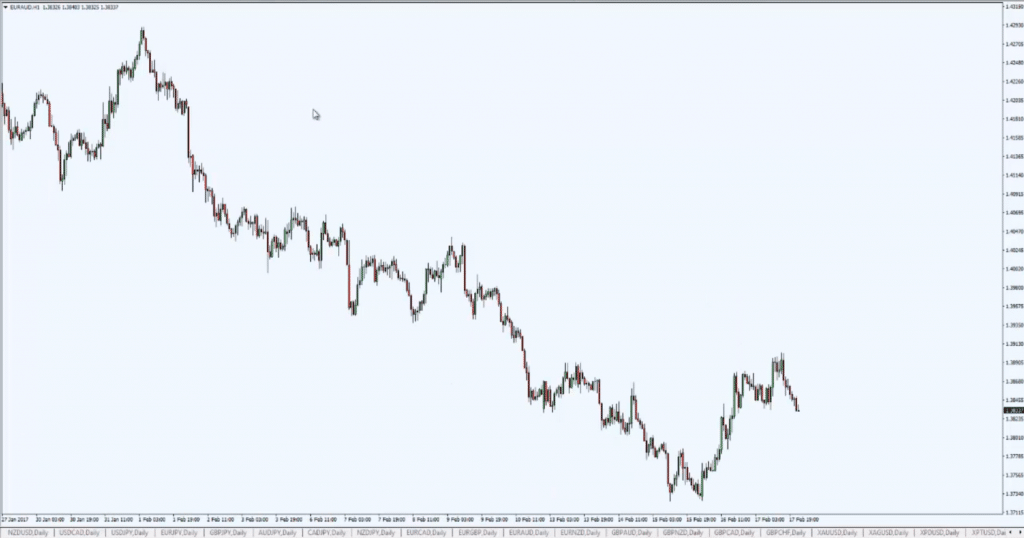
Let's say we try EUR/AUD:
This is the 1-hour timeframe.
Again the same thing, I zoom out, and this time around you can see that this structure of the market is pretty much in a downtrend.
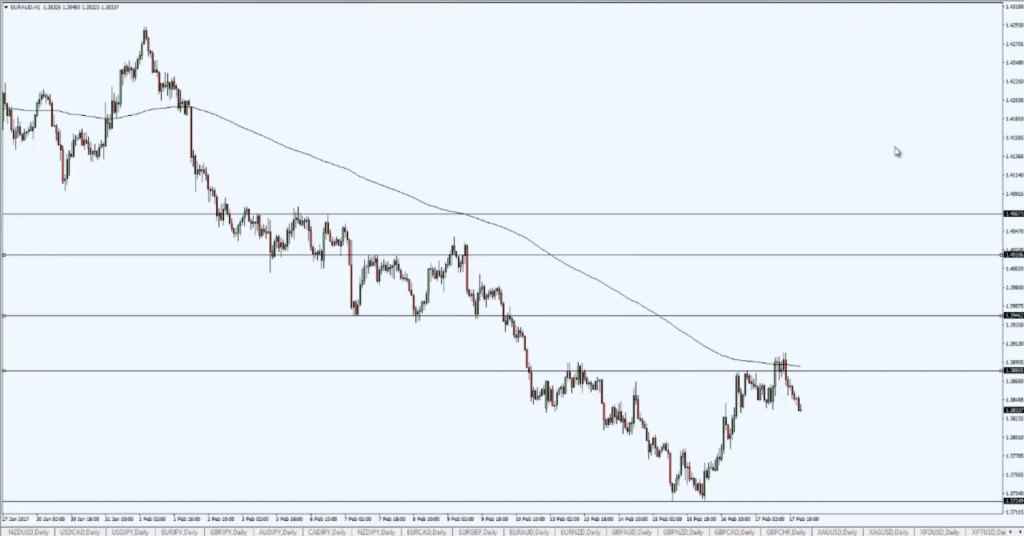
Again, just mark out your support resistance level:
I'm not going to the exact details, what are the precise areas, but these are generally the ones that I'm looking at right now.
Then the same thing, pull out your 200 MA.
From then on, you can see again, this time round price come into this area of resistance, the confluence of the 200 MA:
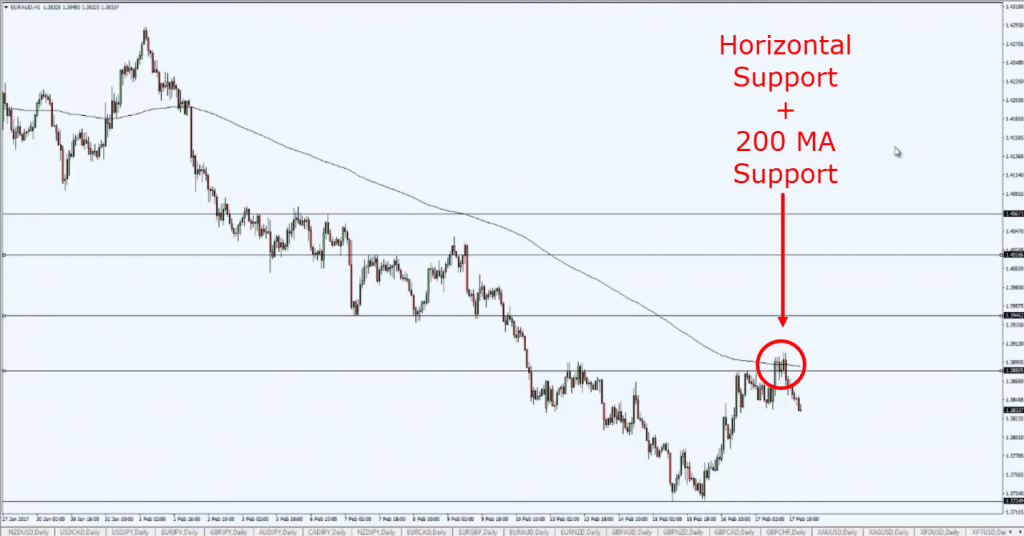
And now we have this slight bounce.
You can see, this really makes your trading so much easier!
Should you be long or short, ask yourself, what is the MA telling you?
Price is below it, so you should be looking to short!
Right?
That's it. I want to move on.
I hope by now you have an understanding of how I actually look at the markets.
So now, I just want to go through a chart that I've never gone through before!
This is tradingview:
It's a website where you can actually look at charts across the stocks future bond markets, a lot of markets.
It's a good place to get free charts for those of you who don't want to pay for it.
And the market that I'm looking at is actually Bitcoin.
Someone asked me on YouTube, “Hey Rayner, can you analyze Bitcoin?”
I've done a bit of research:

The symbol for Bitcoin.
There are a few.
You have the XBIT this one over here.
XBIT against the USD.
There is the Bitcoin against the Japanese yen.
Bitcoin against the British pound.
And this is Bitcoin against the US dollar.
I'm going with XBTUSD, but this is not the only symbol.
You can have another symbol like for example, the BTC as well.
Whichever symbol that you prefer, go for it.
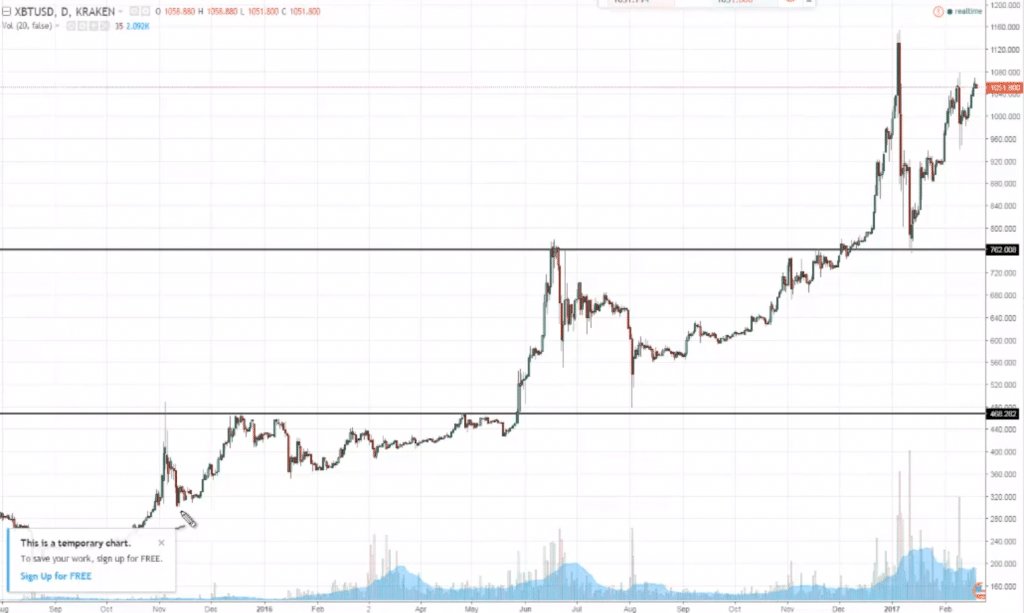
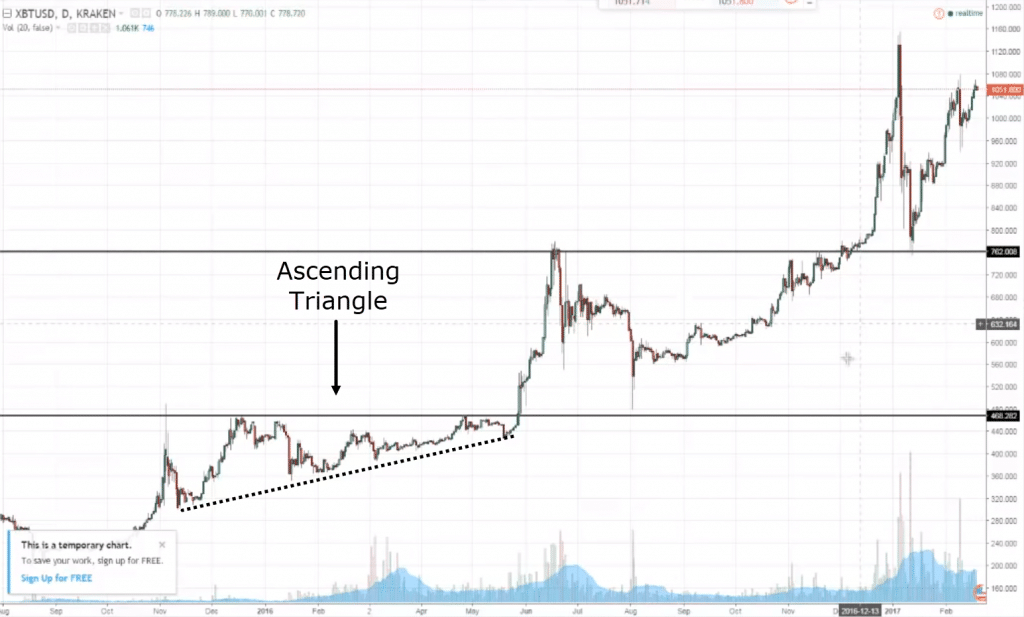
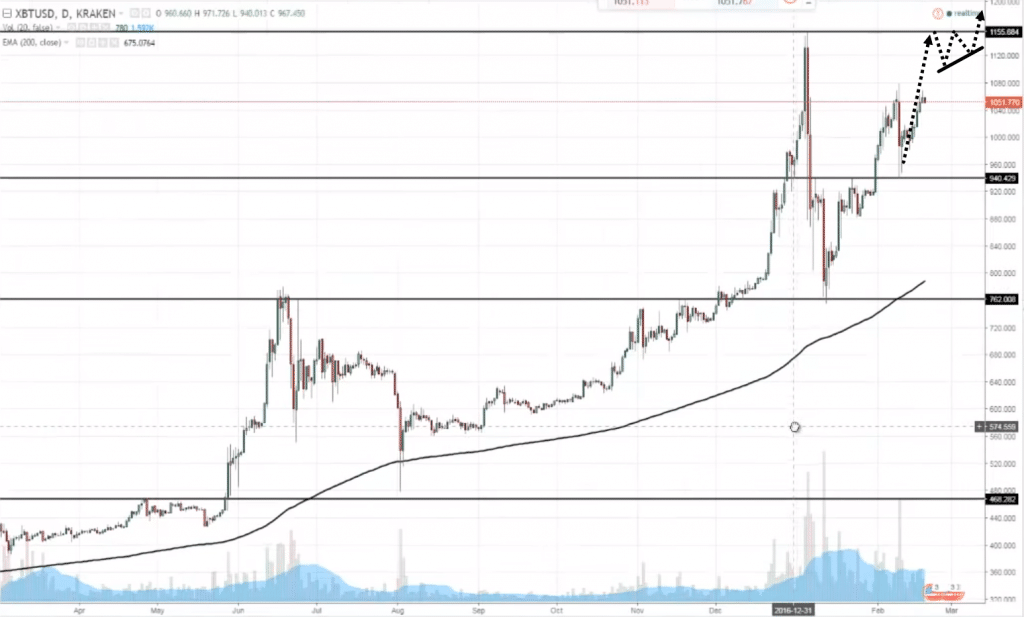
This is the Bitcoin daily timeframe, and let's apply the same technique that you've learned earlier:
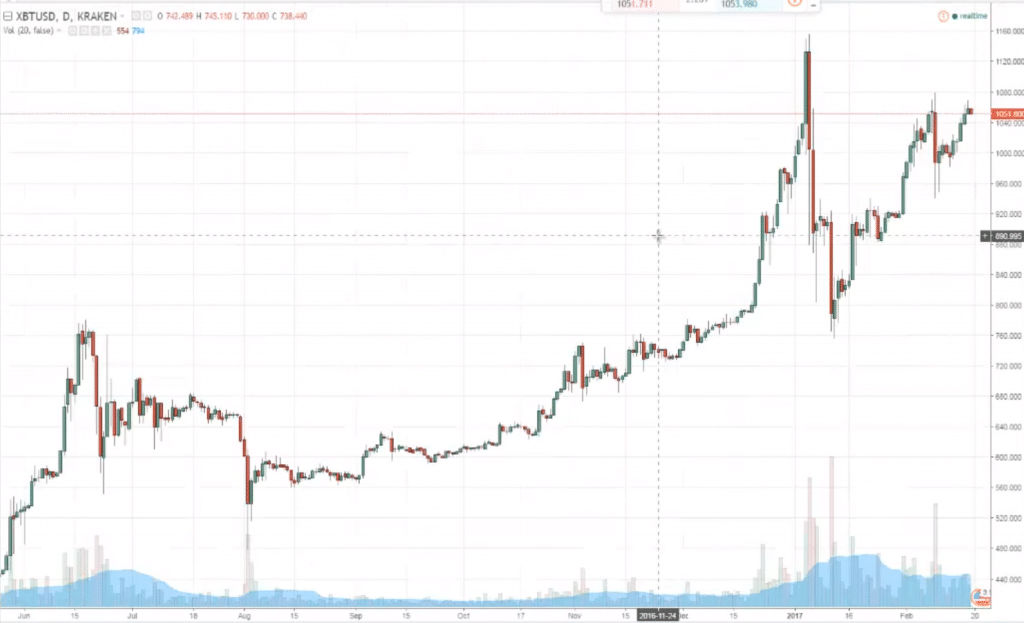
Looking at this blank chart, what should you be doing?
First and foremost, plot your support and resistance:
One thing immediately stands out is that this market tends to respect previous support and resistance.
Just look at this:
This is an ascending triangle.
When you see this pattern, usually it breaks out towards the upside.
Why is that?
Because you see a series of higher lows coming into resistance.
And this is a sign telling you that the bulls are clearly in control.
Because if the bears are in control, these higher lows shouldn't happen.
Because the bears will clearly try to push price lower with greater selling pressure.
But clearly, they couldn't.
And in fact, the bulls are the one in control, as it can push price higher even into resistance they can still hold around the 468 level.
This is definitely a strength from the buyers.
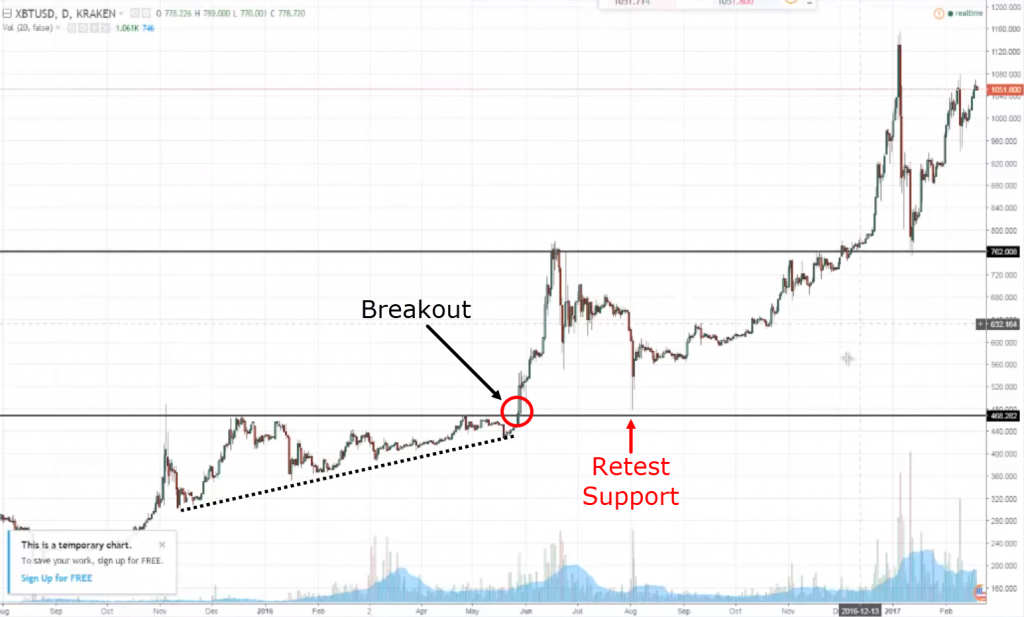
Price broke out of it, came back where did retest:
Back towards this area of previous resistance turned support.
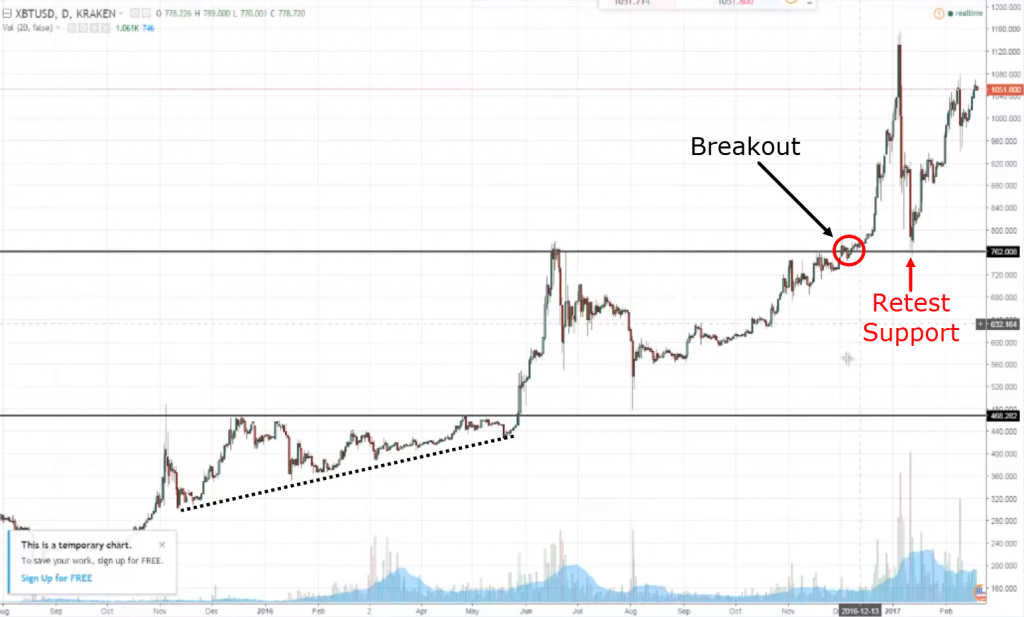
Same thing over here:
Price broke out of it, gone parabolic, came back retest where previous resistance turned into support.
This is definitely something that strikes out to me for this chart.
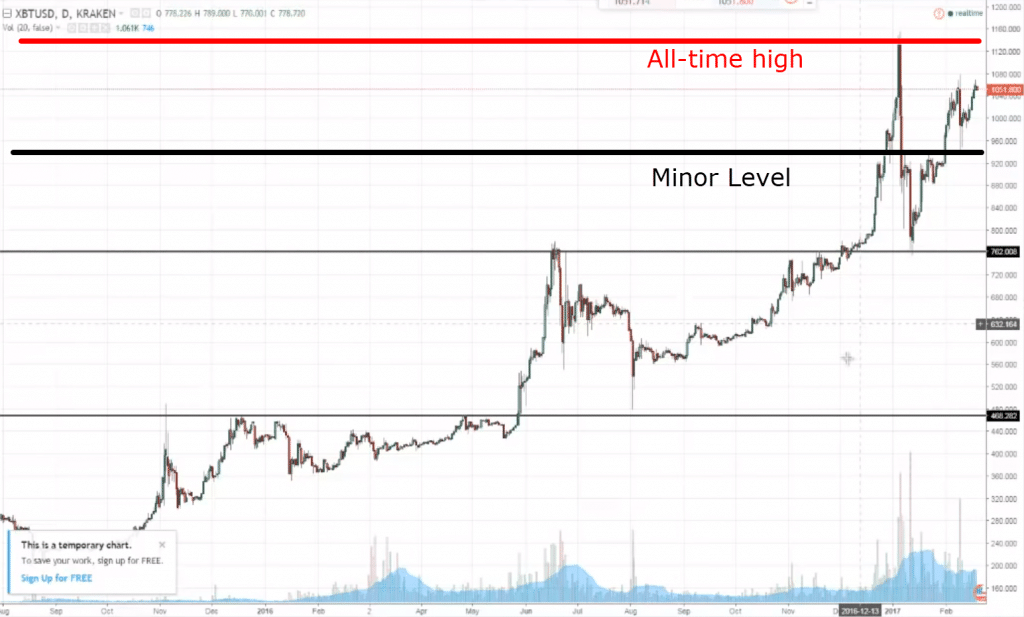
This over here is the all-time high:
This is definitely significant.
And there are some minor levels as you can see.
What about the moving average?
You can see the price is above the 200-period moving average:
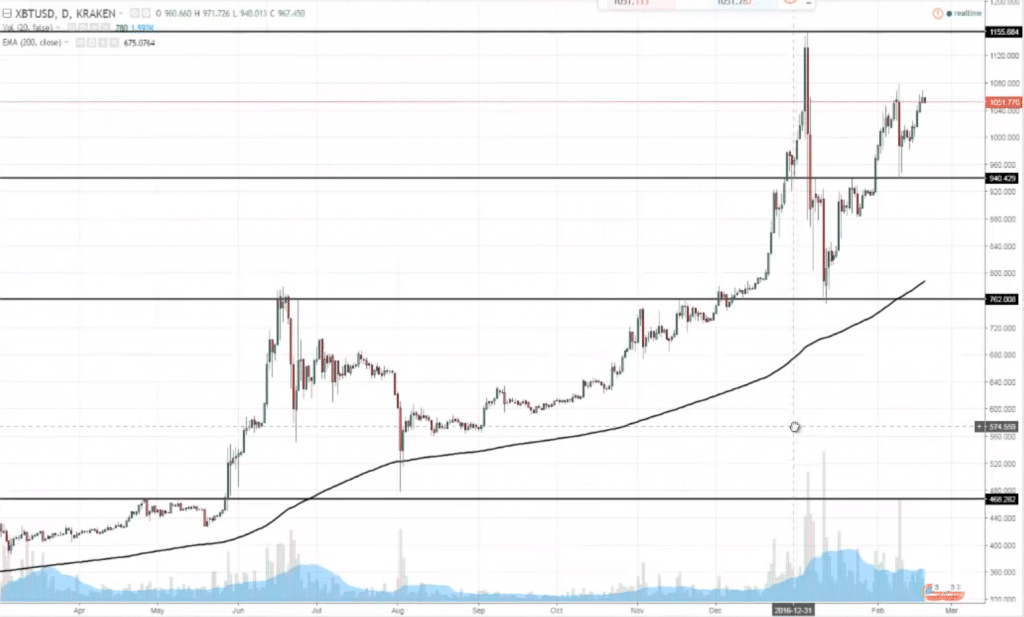
The support & resistance areas are drawn out.
What should you do?
Well, a few things that it should be, you can plan ahead.
If the price gets to these levels:
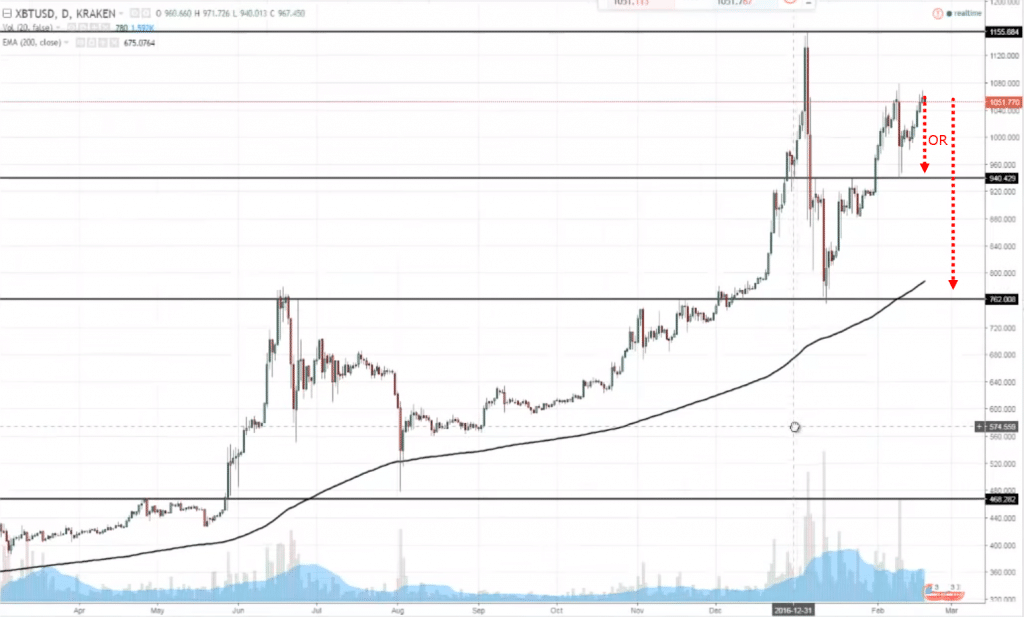
These are potential trading opportunities to get long.
Alternatively, if the price does what it has been doing previously, it comes to a key resistance level, starts hover, higher lows into it:
This could be a potential break out opportunity.
I don't trade it personally.
But for those of you who trade it, I would say these are some of the levels that I would pay attention to if I'm trading Bitcoin.
Before I end today's market analysis.
I didn't really cover a lot of markets.
But this time around it's very in-depth, very technical, how-to step-by-step.
I just want you to really think about this…
Often, traders, they have questions.
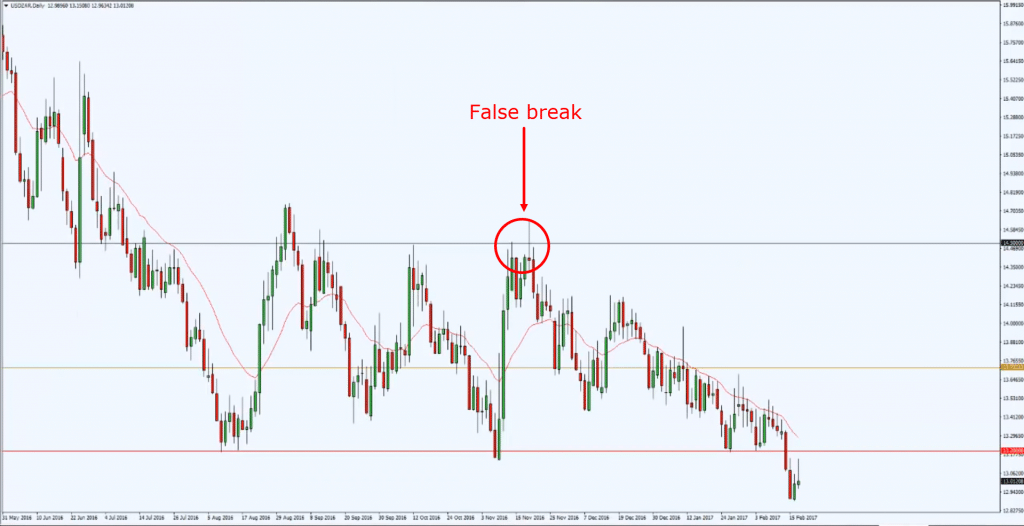
Like for example, let me share with you this chart:
As you know, I’ve actually shorted the USD/ZAR based on the false break based on the example.
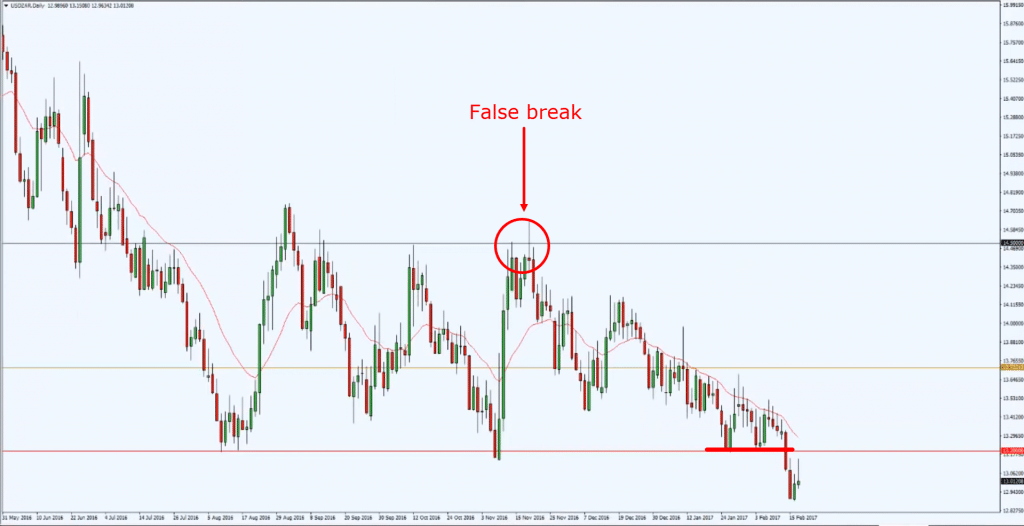
Some traders got short when they broke below this key support area:
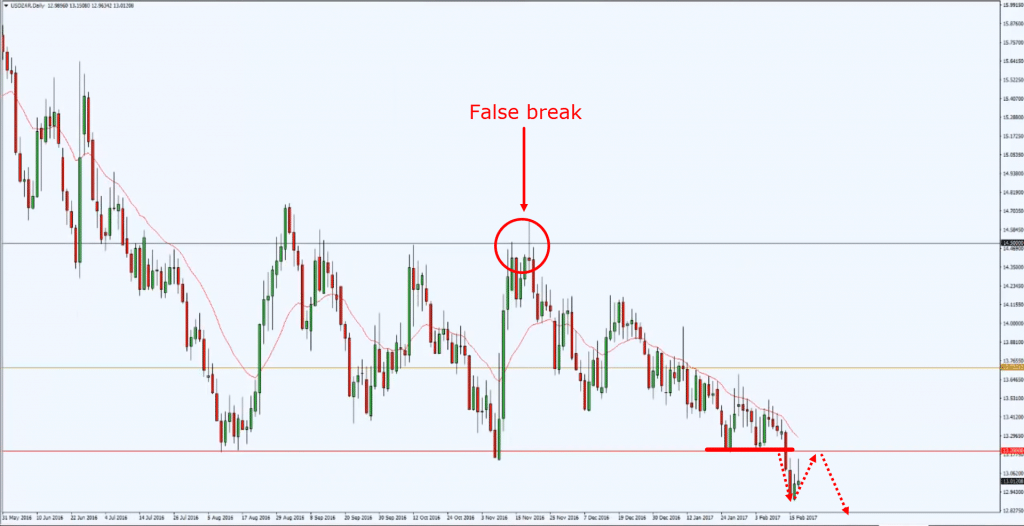
Price went in your favor, and then can you imagine it started trading against you.
At this point in time, at this candle over here, at one point in time, it was actually very bullish.
So a lot of times, what traders will do is that they see their profits evaporate.
Boom! Gone.
And they have this mindset that, “Man, I better take something off the table right now, because if I don't take something off the table right now, I may give back all my open profits.”
This is their mindset.
And so this is why most traders take profits as the market goes against them.
Here's the thing...
If you are a trend follower and you exit your trade as the market retraces against you, what happens is that if the market collapses lower:
You wouldn't be in this trend anymore!
Or rather maybe if you are still in this trend, you have a smaller position size going for you!
And this really doesn't make sense, because you're essentially cutting your winners.
I know you're facing this psychological difficulty.
I think most traders aside from trend followers, even if you're a swing trader, day trader.
As you see the market go against you, you would face this struggle.
So what do you do?
My suggestion is this…
Focus on the point system...
You have a trading plan that tells you which markets you're trading, your entries, your exits, your trade management.
And if you follow your trading plan from A to Z after the trade is over, give yourself one point.
Your goal as a trader now is not to make money.
You're not looking at your P and L.
Don't look at it.
After 100 trades, you want to have a point system of positive 100 points!
Meaning you followed your trading plan for the last hundred trades.
If you break your route or you don't follow your trading plan, that is minus one point.
What you're trying to aim for this time around is to get a net positive of 100 points to just follow your plan.
And trust me, when you hit a positive 100 points.
Your P and L more often than not would reflect a positive side if you follow your trading plan.
Look at it in terms of a point system.
Try to accumulate more points, and your points are achieved by following your trading plan.
Not by looking at your P and L, and as you see it go against you, you quickly exit the trade, or you bend your rules, you widen your stop loss, you average your losses.
Ignore your P and L for now.
Ignore it.
Focus on this point system.
Focus on following your trading plan, and every time you follow your trading plan, give yourself one point.
When you accumulate 100 points, your P and L more often than not would be on the positive side.
And even if it isn't a positive side, you are basically many steps ahead.
Because now you can look back and see...
Even though that you're following your trading plan, clearly you're not making money.
You can actually refine your existing trading plan to make improvements on it going forward.
You can you see it now you are now on a path towards improving yourself as a trader instead of going round and round in a circle, unable to find out, what is wrong, or how you can improve.
So, adopt this point system.
After 100 points, tell me how you're doing.
With that said, I've basically come to the end of today's market analysis.
Let's do a recap…
Recap
- We talked about how to actually analyze a blank chart. Plot out your support resistance, Use the 200 MA as a trend filter.
- We talked about the EUR/CAD, the EUR/AUD, and Bitcoin.
- Adopt a point system in your trading. If you follow your trading plan, give yourself one point. Every time you break your rules, negative one point. accumulate 100 points.

