#1: Pinbar Trading Strategy
Lesson 1
You’ve probably come across a pin bar trading strategy that goes something like this…
You wait for the price to come into an area of support.
You wait for the pin bar to form, then you get long.
Put your stop loss below the low of the pin bar, and aim for a minimum of 1:2 risk to reward.
So, this is what you do…
You start scanning your charts for this trading setup.
Waiting for the price to come into an area of support.
Waiting for the pin bar to form.
And the problem is this…
When the price comes into an area of support, it starts trading higher immediately without giving you a pin bar setup.
You miss the move because there wasn't a pin bar to start with!
Has this ever happened to you?
Because if it does, then this post is for you!
I will share with you what a pin bar really means, and how you can actually identify trading opportunities in the market without waiting for a pin bar.
Let’s get started…
What is a Pin bar
Let's have a brief run through and understand what is a pin bar:
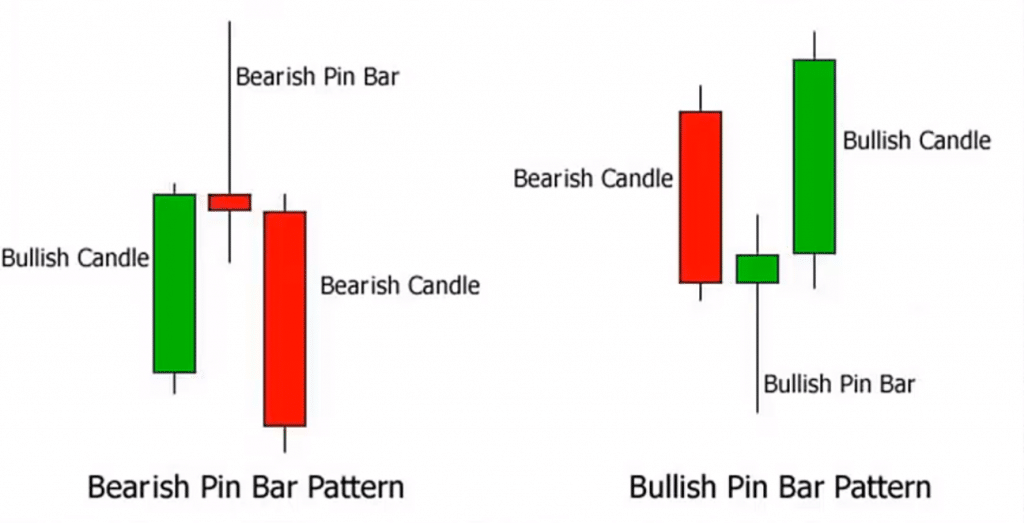
A pin bar, to me, represents price rejection.
I don't like to memorize candlestick patterns whatsoever.
Instead, I like to understand what the pattern is telling me, what the market is telling me!
In the example, what you have is that price opens, the bulls came in and took charge and pushed price higher.
And later the bears came in and say, "Uh-uh, that's as high as you're going to go my friend."
And they push price all the way back lower, closing at the lows.
So what you have over here at this wick is simply price rejection!
Rejection of higher prices!
And for the bullish pin bar, again, is just the same principle, but on the opposite end of the spectrum.
Price opens, the bears came in and took charge, pushed price lower.
And then the bulls came in and say, "No, no, no, my friend, that's as far as you're going to go."
And they push price all the way back up higher, and finally closing above!
What you have over here is just rejection of lower prices!
The thing I see with most traders is that they say, "Oh, Rayner, I see a bearish pin bar. I'm going short, place my stop loss above the high, and the price is going down."
So, they make this kind of assumptions in the market.
And let's look what happens if you do such thing:
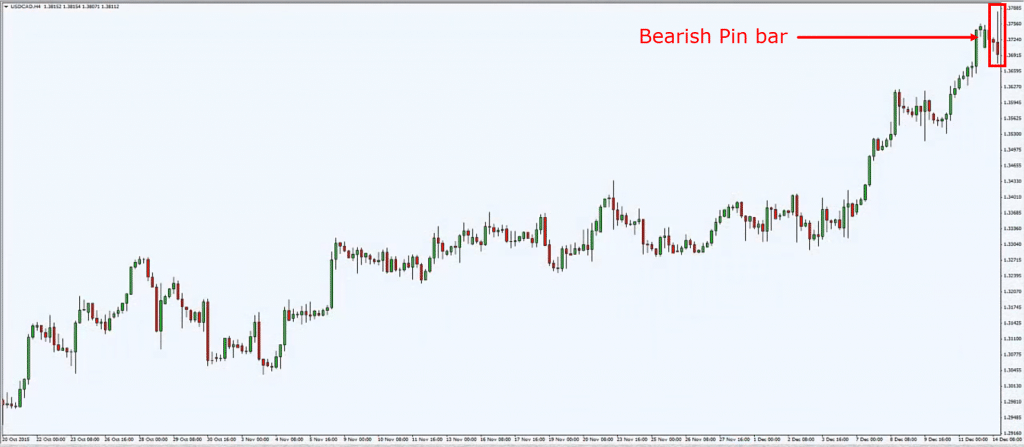
You can see on this chart over here, this 4-hour chart of the USD/CAD.
You have a bearish pin bar, rejection of higher prices.
So, what a trader will do is they'll go short, and place their stop loss above the high!
But the thing with this approach is that you are not looking at the big picture of the market.
You're not looking at what the market is trying to tell you!
You're just simply memorizing patterns and trading as it is!
And if you do that, that's a very low probability trade!
Because if we look at the chart, the trend is up, it's an uptrend.
And when you trade such patterns on the lower timeframe...
You realize that you are actually going against the trend as well!
If you look at this chart:
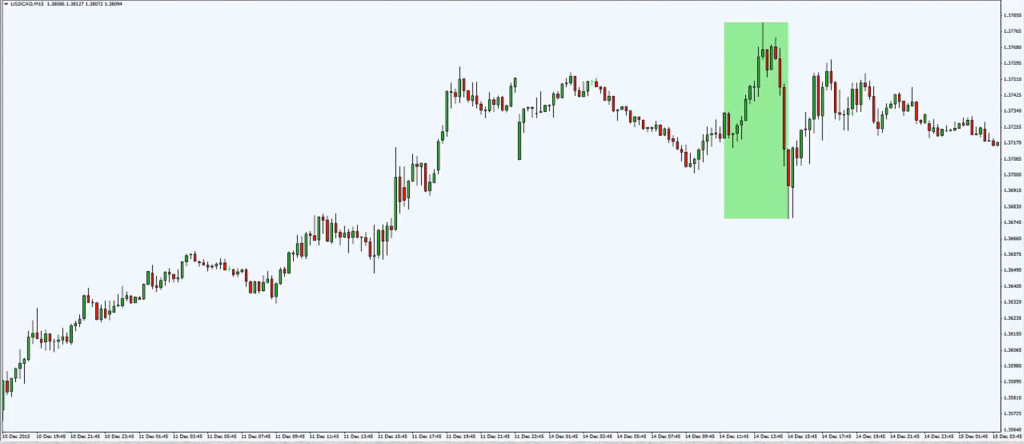
This is the same chart, USD/CAD, but the only difference is that it's on the 15-minute timeframe.
This green box over here is basically the same bearish pin bar you saw earlier.
You can see it opened above, and finally closed lower.
Giving you a bearish pin bar.
This is the rejection of higher prices!
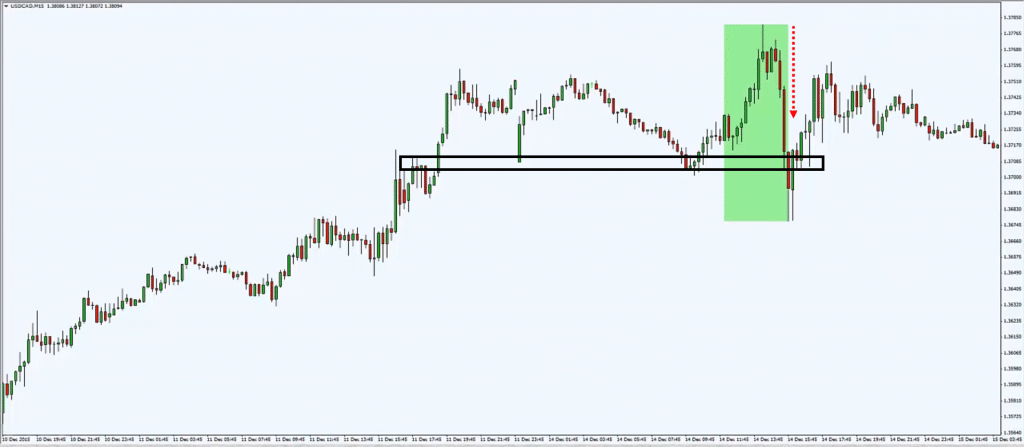
But if you were to take this trade, can you see what you are actually doing?
You're actually going short into an area of support on this lower timeframe:
You have two things going against you at the moment.
You are against the higher timeframe trend, and you're also against the lower timeframe trend.
You are basically a counter-trend trader on the higher timeframe and the lower timeframe!
So, what are the odds of this trade actually working out?
Just think about this.
Another example:
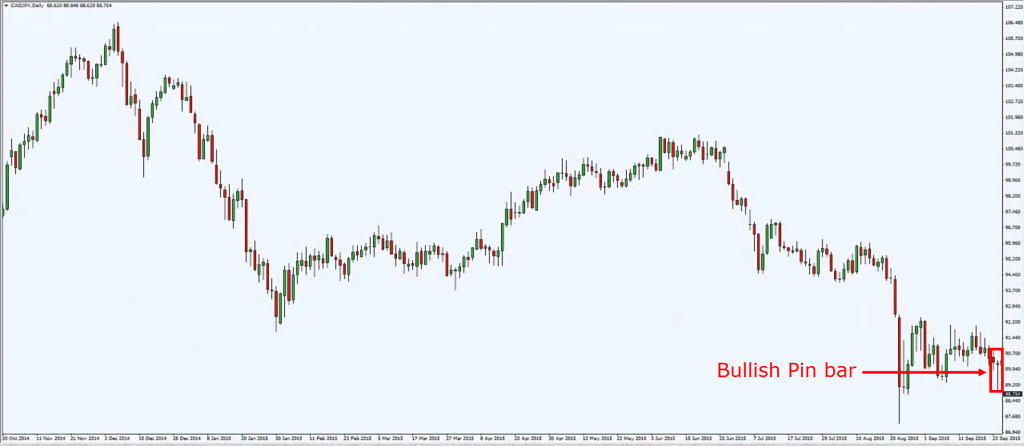
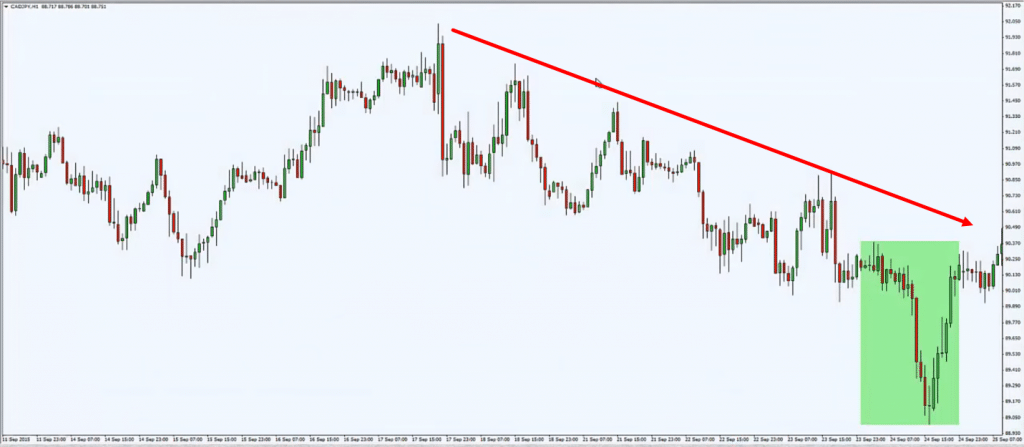
You can see over here this chart is the CAD/JPY daily chart.
And again, "Okay, Rayner, I see a bullish pin bar."
You go long on the bullish pin bar.
You put your stop-loss below the low.
Possibly maybe placing a buy stop order above the high of the pin bar.
As you can see, you're against the trend on the daily chart.
What about the lower timeframe?
The hourly chart, what does it look like?
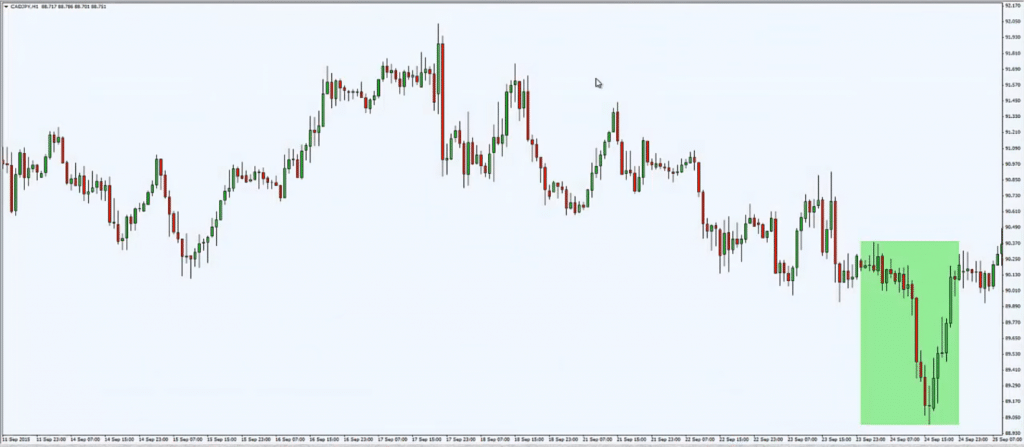
You can see the same pin bar we saw earlier is basically this green area!
Price opened, get rejected and finally closed almost at the same level.
So you have a rejection of lower prices here!
But if you look at this chart, does this look bullish to you?
In fact, if you draw a trend line:
Chances are you're going long into this area of resistance!
Again, you're against the higher timeframe, and you're against the lower timeframe.
And this is definitely something that I call a very low probability trade!
So, what can you do about it?
Well, what I would encourage you to do is to trade with the trend on the higher time frame.
Because for most pin bar or engulfing patterns that you actually see on your charts, on the lower timeframe, they are usually a retracement on the lower timeframe.
So you can't really do much about it!
But what you can do to improve your odds is to trade with the trend on the higher time frame!
And to look for confluence factors, like support and resistance.
This will greatly increase the odds of this pin bar and engulfing patterns to work out.
So I'll share with you a few examples:
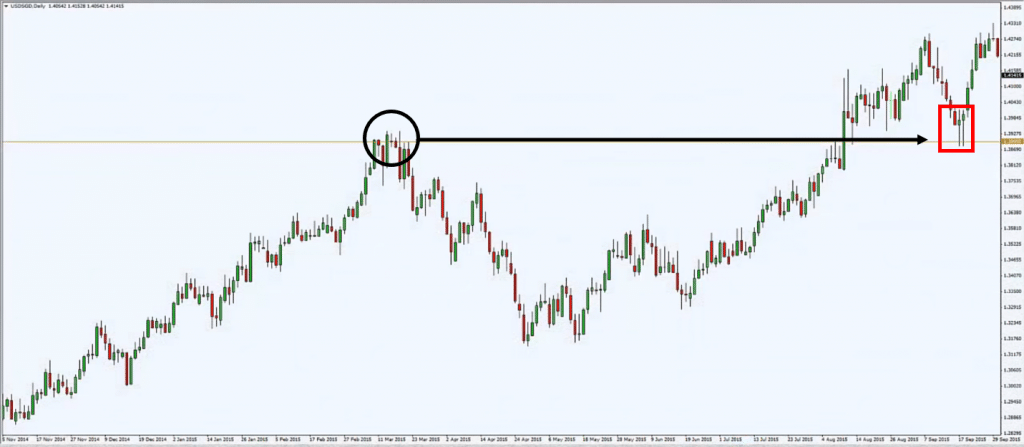
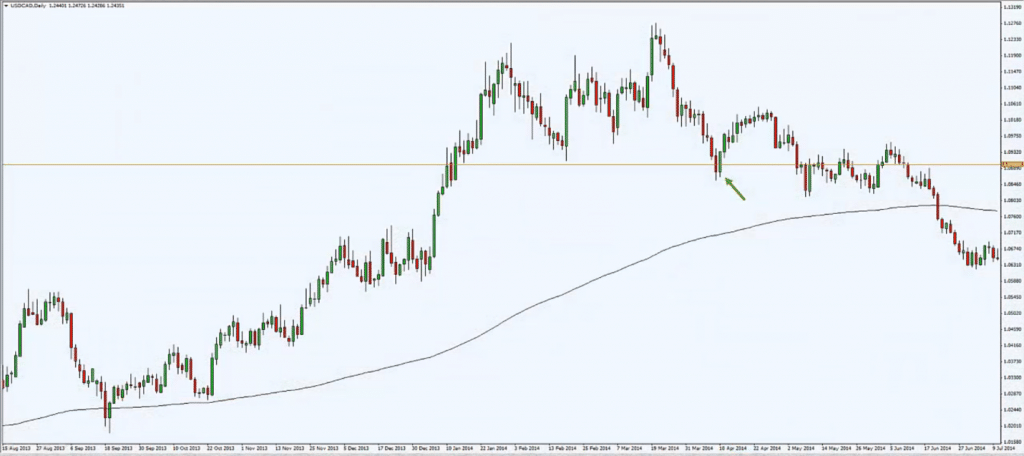
You can see this is clearly an uptrend.
Price coming to an area of previous resistance, now into support.
Then you got a rejection of lower prices!
Now, is this a much higher probability trade?
You have the trend with you, and you are trading in an area of support where potentially there are buyers who will come in and push the price higher!
Can you see the difference right now?
Between trading the pin bar randomly on the chart?
And trading it in the context of the market structure.
Another example:
Resistance in a downtrend.
This is a resistance that you can see.
Then you have this pin bar over here, or maybe an engulfing pattern, whatever you call it.
Again, can you see the difference between this pattern and the previous example I shared with you.
Where you are just going long just because it's green, and going short just because it's red.
No, no, no, no.
That's not the way, alright?
Look at the big picture.
Now you may think, "Oh, wow, Rayner, this is exciting stuff. Oh, so I just look for this kind of patterns in the market."
But let me share with you another example:
This is not the holy grail.
There will be failed trades in this example.
Again, it's an uptrend, coming to an area of support.
This is what I call a bullish engulfing pattern.
It's possibly a failed trade because price trade higher before coming down lower once again!
So it's not the holy grail.
Nothing is...
Trading is all about probabilities.
It's all a numbers game.
But if you can find an edge.
You can find something that gives you positive expectancy in the long run, then all you need to do is to manage your risk, and execute your trades consistently!
I just want you to know that pin bar itself, you don't want to trade it in isolation.
You want to trade it in the context of the big picture or the trend.
This will greatly increase the odds of your trade working out.
And now this is a solution for you...
But this solution does not come without its own, what I call, drawbacks.
Because a lot of the times I see traders just focusing on these pin bars.
They look for pin bars in an uptrend and support area, like what I just shared with you.
And here's the thing...
If you only focus or try to memorize these kinds of patterns in the market, it's not wrong!
But what's going to happen is that you're going to miss a lot of trading opportunities.
What do I mean by that?
Because right now I just shared with you, "Okay, Rayner, I know."
In an uptrend, the price comes back to an area of support.
I wait for a pin bar to form, I go long and expect higher prices.
That is fine. You can wait for that.
But if you're just solely waiting for this kind of pin bar patterns.
You're going to miss a lot of trading opportunities in the market.
Why do I say that?
Because, recall earlier, in an earlier example...
I don't like to memorize candlestick patterns.
I like to understand the structure of the markets.
I shared with you earlier that a pin bar is just a form of price rejection!
That's all that there is to a pin bar or engulfing pattern.
They are just showing you price rejection in the markets.
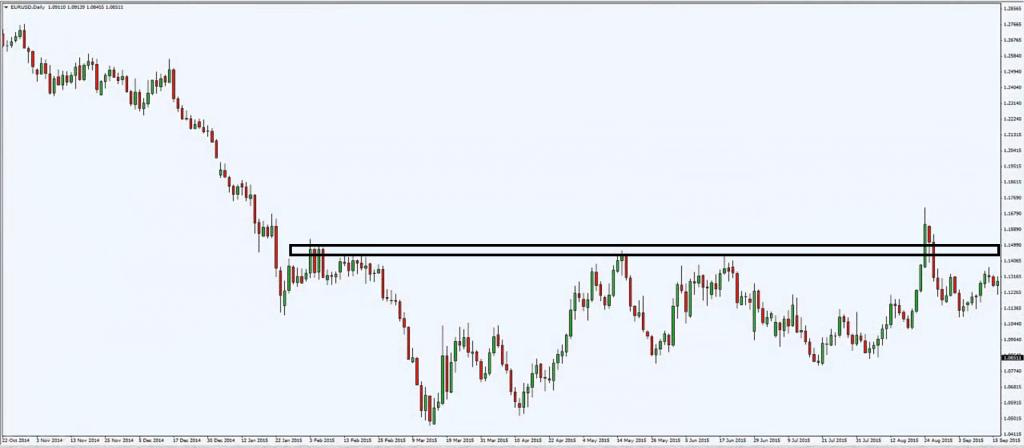
So you look at this chart of EUR/USD over here:
It's in a downtrend at an area of resistance.
And you come to an area of resistance, you wait for that pin bar, waiting for the bearish pin bar, waiting for it to happen.
But it didn't!
And then you just say, "Oh, okay, I don't have a bearish pin bar. Okay, let's move on. There's no trade down here."
But think about this...
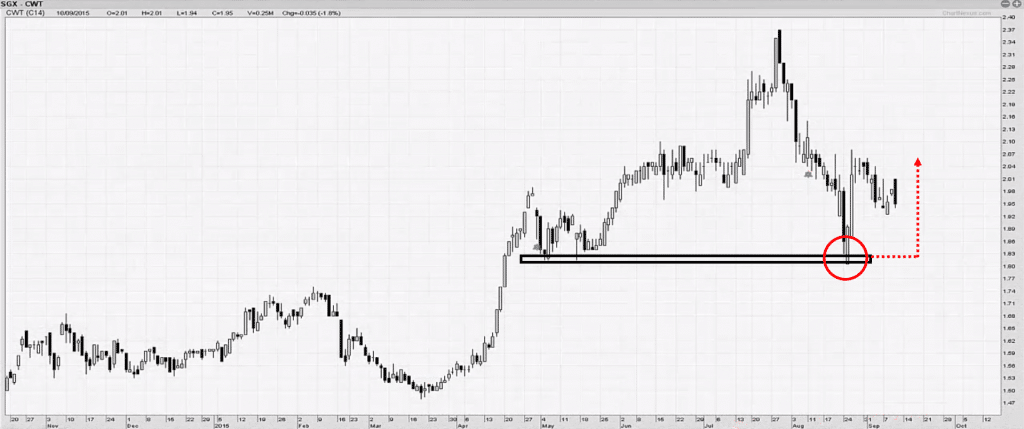
The bearish pin bar is just showing you rejection of higher prices.
Is there a sign that price is rejecting higher prices on this chart?
There is!
Look at this:
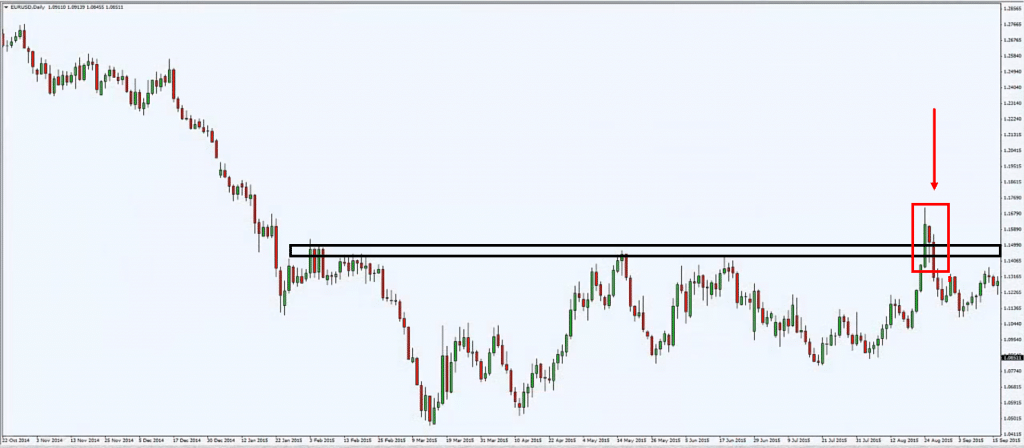
Isn't this a sign of rejection of higher prices?
You can see over here, price rallied up higher, then it closed lower with a wick showing some buying pressure.
And the third candle price closed lower all the way down.
You can see that the three candles are telling you that there is a rejection of higher prices!
There is no pin bar down here.
There is no engulfing pattern down here.
But there is a rejection of higher prices!
If you can interpret this message from the markets, you'll find that you have more trading opportunities.
Instead of just memorizing certain patterns in the market, and wait for it to unfold.
You're just sitting on your hands all the time, with not much trading opportunities.
Another example you see over here:
It's an uptrend.
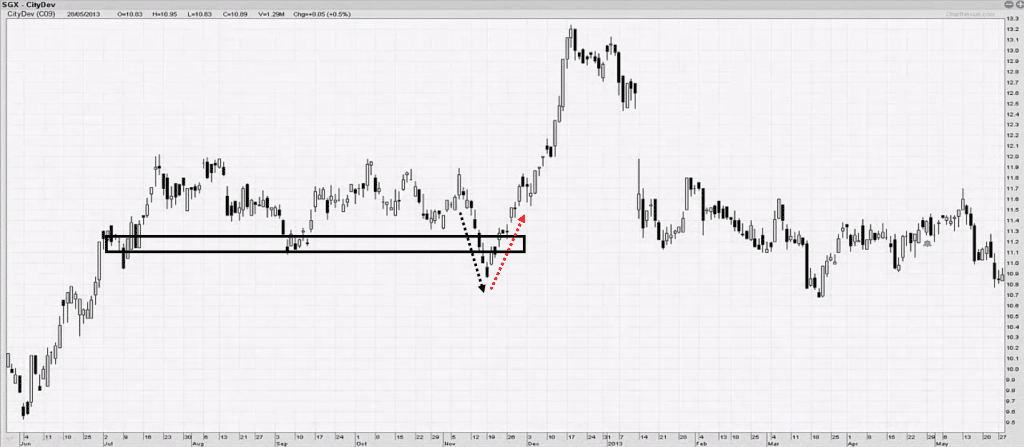
This is a previous or swing low support area.
Price then came into this area, this bearish bar comes in.
And then the next bar you have a gap lower, and then it closed higher!
There is no bullish pin bar here.
There is no bullish engulfing pattern here.
But what you have is a rejection of lower prices!
Again!
These are trades that you have to be taking...
If you are taking pin bar and engulfing set-ups, then these are trades that you should be taking as well!
Because you believe in price rejection.
And this is another way of showing you price rejection on your charts.
So let's do another example:
So again, it's at the area of support.
Price came into the area of support, and then what?
It made a gap higher and finally closed higher.
What is the message of the market telling you?
It's rejecting lower prices, am I right?
You can see over here the last few examples I shared with you...
There isn't any pin bar.
There isn't any engulfing pattern.
Because if you were to focus only on these two patterns, you would have very little trades.
So my point is this…
It's fine to trade pin bar and engulfing patterns.
It's perfectly fine!
But you have to understand what these patterns are telling you.
What is the message of the markets?
Don't memorize it pattern-for-pattern.
Instead, look at the structure of the market as a whole, and then spot areas of price rejection.
Recap
- To increase the odds of your pin bar pattern working out, I will prefer that you trade in the direction of the trend.
- Know that you're not trading pin bar. You're actually trading price rejection. Sometime price rejection will not come in the form of a pin bar.
- The pin bar and engulfing pattern represent price rejection.
So, think about this...
I hope this video is actually something that lets you think about how your trading is like, and how whether you can actually improve on it.
Especially those who are actually trading pin bar and engulfing pattern. Okay?
If you have any questions, any comments, don't hesitate to let me know. With that, I wish you good luck and good trading.
I'll talk to you soon.

