#6: Moving Average Trading Secrets
Lesson 6
In my early days of trading...
I was like a lost wandering soul.
I was around trading forum, blogs, and websites trying to learn more about trading!
Naturally, one of the first few indicators that I came across is Moving Average.
And with moving averages...
I was taught that to use this indicator "properly"
I should wait for the fast moving average to cross above the slow moving average, that's when I buy.
When the fast moving average crosses below the slow moving average, that's when I sell.
It looks something like this.
I tried this and well...
I lost money.
I couldn't find success with it and I decided to conclude that moving average is useless.
That was the conclusion that I had for a few years!
But as I matured as a trader, I realized ...
Hey, moving average is not as useless as it seems!
I was too naive and I came up with such a simple conclusion based on the failed moving average cross over strategy!
Let me explain...
For example, you have witnessed a car race: a Ferrari against a Toyota Vios.
When they go and race together, naturally we can agree that the Ferrari is going to beat the Toyota Vios, hands down.
It has the stronger horsepower, bigger engine, bigger cc and stuff like that.
But are you going to conclude that Toyota Vios is a useless car?
Well, no!
It really depends on how you look at it.
Because a Toyota Vios can fit a family or five to six people.
A Ferrari can't do that.
A Toyota Vios is more fuel economy.
It will help save more money on fuel in the long run!
So, you can see that even if a Toyota Vios can't beat a Ferrari head on...
It's not useless, there are other uses to it and this is the same as moving average!
This is the same concept I'm trying to bring across.
Just because the moving average crossover doesn't work, doesn't mean that this indicator is useless.
Because in today's video...
I'm going to share with you moving average trading secrets that I have learned over the last few years of trading.
Here's what you'll discover...
- How to identify the strongest markets to trade and increase your winning rate
- How to better time your entries
- How to trade along the path of least resistance
- How to use the moving average to ride massive trends in the market
There's a lot we're going to cover in today's video so let's begin...
So, what is the moving average indicator?
Before we talk about the specific strategies of moving average.
I want to share with you and explain to you how moving average works.
Because if you don't understand how an indicator works, whatever strategies whatever techniques or tactics you use in the future...
You will be executing them with blind faith without really understanding the core idea or concept.
So, the moving average is just an indicator that takes the past prices and summarizes it.
Let's say we have a 5-period moving average and a price score something like $1, $2, $3, $4, $5.
What the 5-period moving average is going to do is it's going to take the total value of the prices and divide by 5 because it's a 5-period moving average!
The total value of the last 5 prices is $15, and divide it by 5...
The moving average that's going to appear on your chart is the value of $3.
Now, let's say another number forms up.
And this time around, the number is $10.
Again, it is going to take the last 5 prices which is $10 (recent), $5, $4, $3 and $2.
Add everything and you get $24.
So, $24 divided by 5, you're going to get the value of $4.8
Your moving average will appear a value of $4.8 on your chart!
This is the core idea behind the moving average.
It simply takes the past prices and divides it according to whichever moving average parameter that you've chosen.
In this case, this is a 5-period moving average.
If you take a 3-period moving average, it's just going to look at the last 3 numbers and then divide by 3.
Of course, there are different ways moving average are being calculated.
We have exponential moving average, simple moving average, weighted moving average, and etc.
Just some slight nuances behind the way they're being calculated, but the core concept is pretty much what I've just shared with you.
Now that you've understanding moving average, how it works, why the number moves up and down...
Let's look at the first secret about moving average that I want to share with you...
How to find the strongest markets to trade
Here's the thing...
The first market that breaks out first tends to be the stronger markets and you can expect the move to last longer.
This is a concept that we call relative strength.
Identify who are actually the stronger ones and who are the weaker ones.
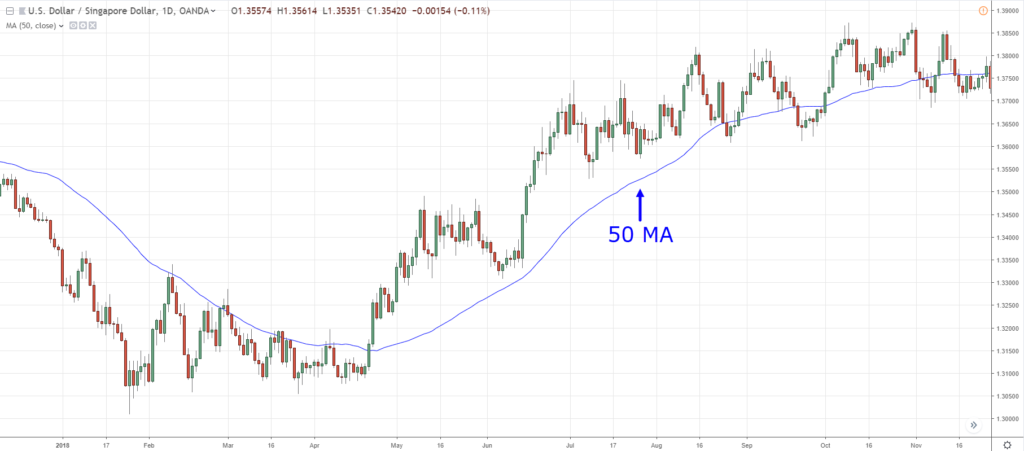
Right now, this is the chart of USD/SGD:
What you can do is to just pull out a moving average.
For example, we are going to use is the 50-period moving average.
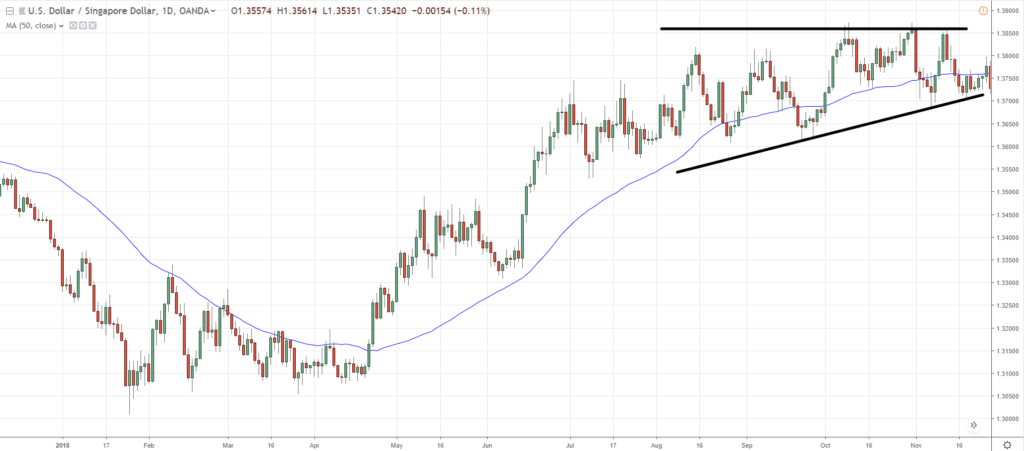
Notice that this market is forming an ascending triangle:
Notice the higher lows into the area of resistance.
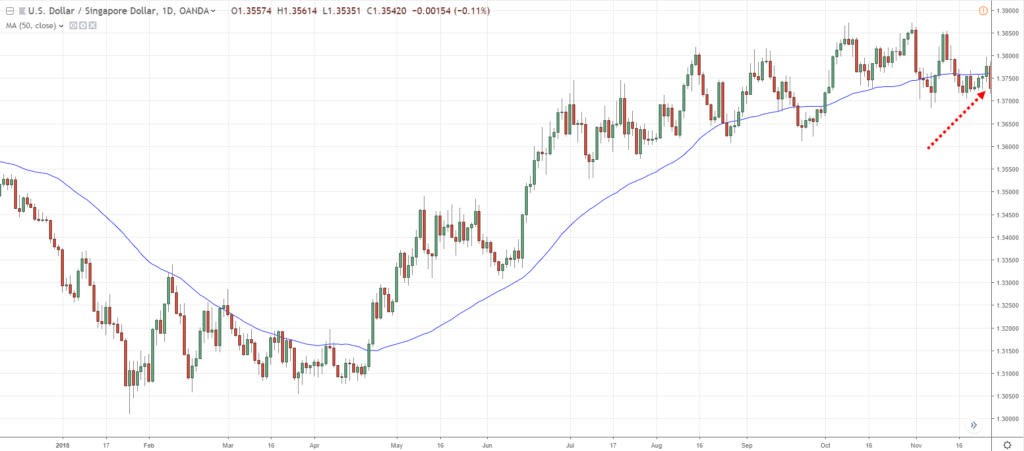
And notice right that the price is somewhat below the 50-period moving average!
Let's say you are deciding to take the trade between USD/SGD and USD/CNH.
You can't decide which market to go long.
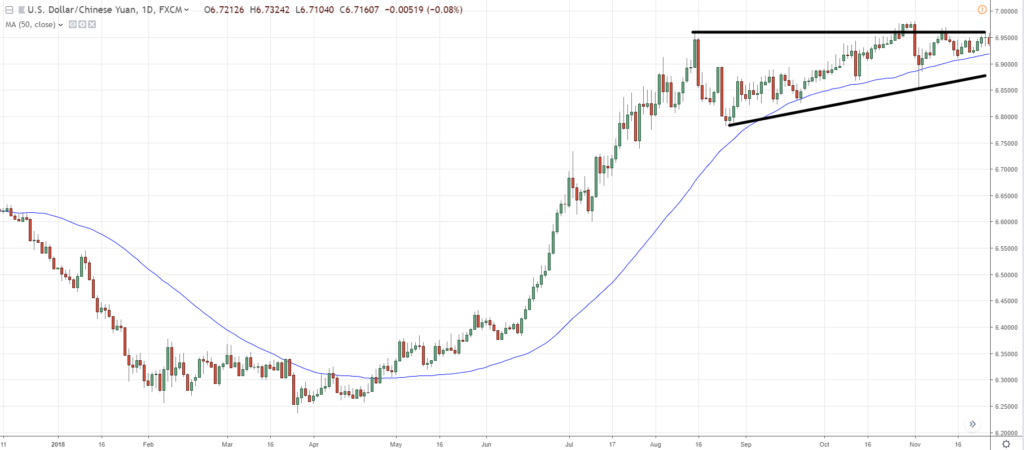
And you noticed that the USD/CNH is similar to the price action as USD/SGD as you've seen earlier, another ascending triangle:
This time around, you noticed that the price is actually above the 50-period moving average.
Whereas the USD/SGD that you've seen earlier:
The price is actually below it!
Whereas the USD/CNH, the price is above it.
So, what this is telling you is that if you are deciding to buy USD/CNH or USD/SGD...
You want to be going with the USD/CNH because it's showing you a sign of strength.
There's a good chance that if USD/CNH breaks out, the move will be stronger and will last longer compared to USD/SGD.
This is one way you can use relative strength to help you identify which are the stronger markets to trade and to avoid the weaker ones.
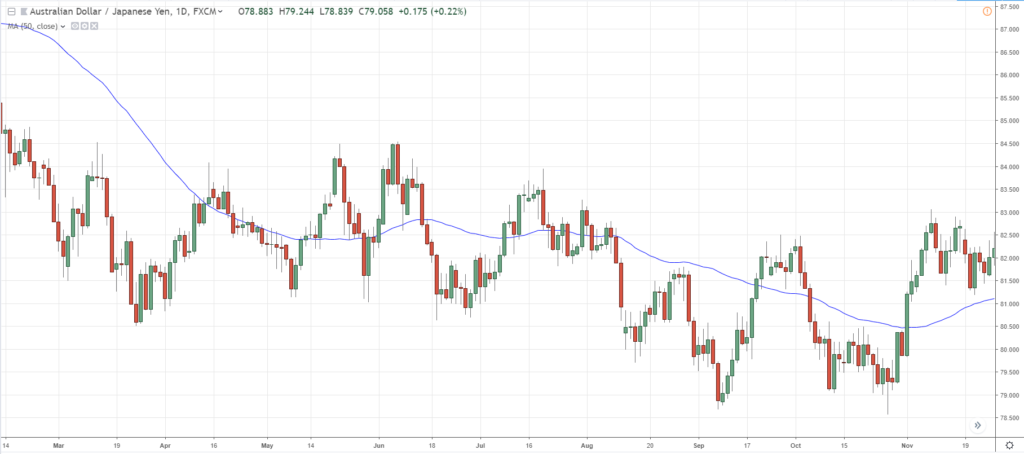
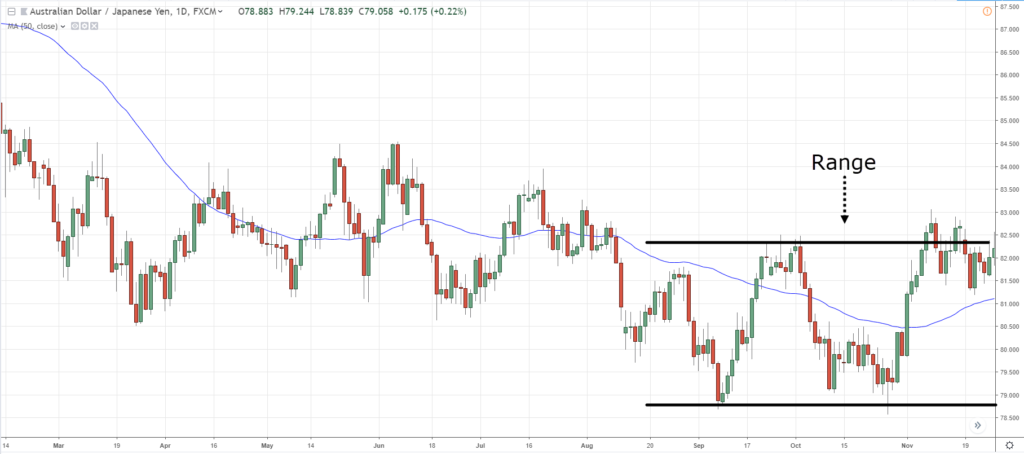
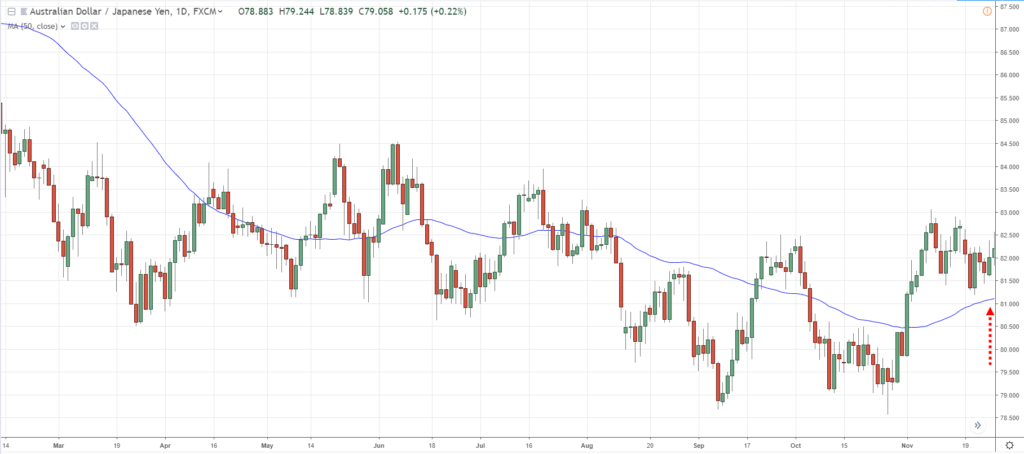
Another example to share with you is AUD/JPY:
For whatever reason, let's say you are bullish on this market.
The price has broken above the swing high and right now it's consolidating:
And you think that the market has room to move higher.
At the same time...
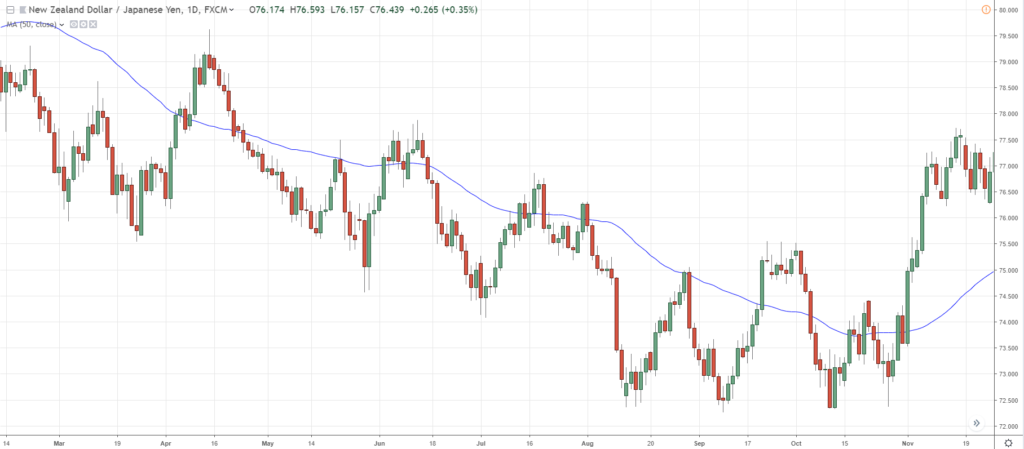
You notice that there's another market with similar price action in NZD/JPY:
And you can't decide which one to buy.
Should you buy NZD/JPY or the AUD/JPY?
This time, both markets are above the 50-period moving average.
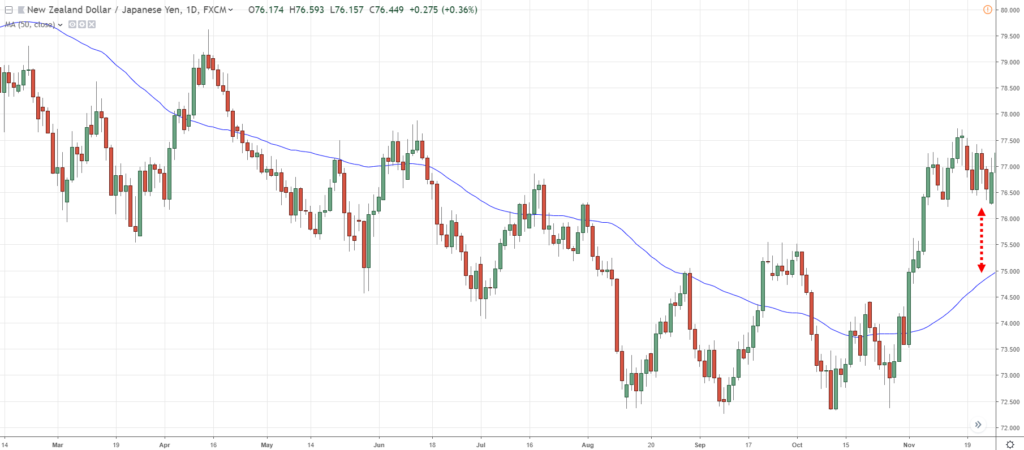
Another technique that you can use is to look at where the price is relative to the moving average.
Both of them are above the 50 MA but if you pay attention to the NZD/JPY:
It has a much wider distance away from the 50 MA showing you a sign of strength!
Whereas you compare with the AUD/JPY:
It's much closer to the 50-period moving average.
This tells you that the NZD/JPY is likely a stronger candidate and you want to be buying on that market.
This is how you can actually use relative strength in your trading to identify the strong markets and even the weak markets.
The concept is just the opposite.
Moving on...
How to time your entries with the moving average
I want to share with you a technique on how to actually better time your entries.
Because you don't want to be entering too late.
Now...
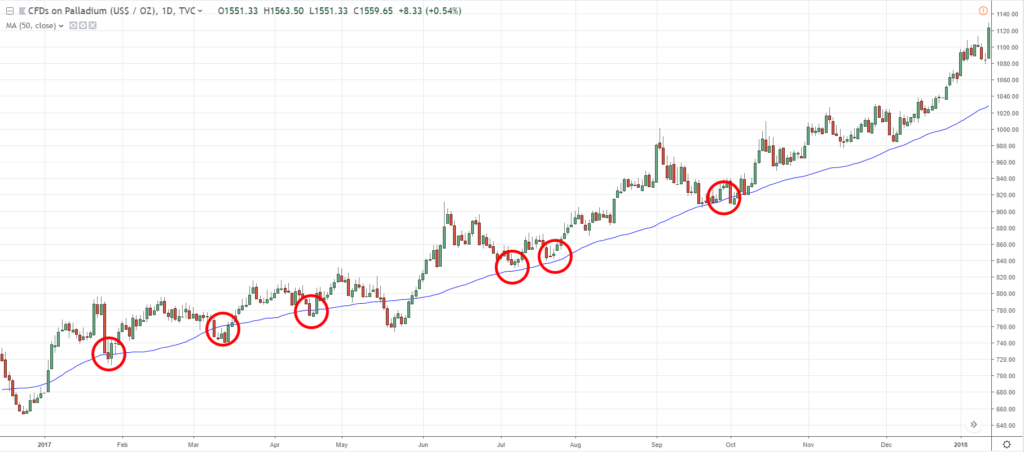
If you look at Palladium:
This market has respected the 50-period moving average more than 5 times.
This should tell you that the 50-period moving average is the area of value on the chart!
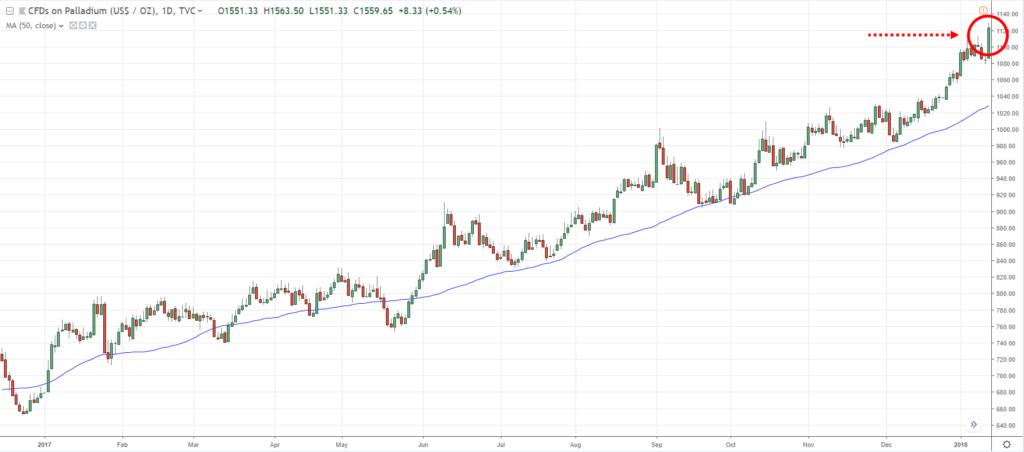
From a logical perspective, if you look at this market right now...
Many trades would think, "Oh! the market is breaking out, it's bullish, let's buy!"
You want to pause and think for a moment...
Why is that?
That's because, if you look at this price action of this market historically, it tends to mean revert back towards the 50-period moving average!
If you want to buy over here:
There's a good chance that this market could mean revert back towards the moving average.
And you would have to endure that draw down or you might even get stopped out off your trade if your stop loss is too tight.
From a risk to reward standpoint...
A much better time to enter your trades is when the market is near the 50-period moving average!
In this case, it is a matter of being patient and let the price come to you.
Eventually, the price did come to you:
So, this is a much more favorable trade location to enter your trade, as you enter from an area of value.
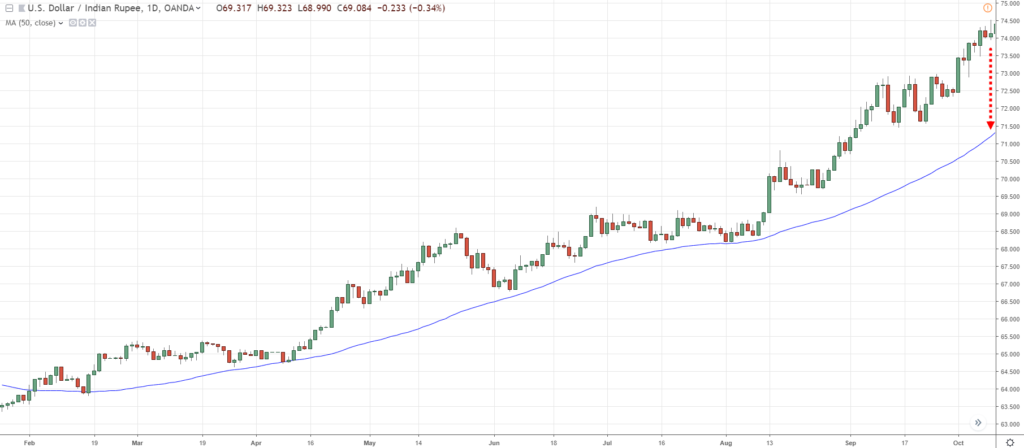
Another more example is USD/INR:
I'm just using the 50 MA here but again...
It can be a 30 or 40-period moving average, it doesn't really matter.
The concept is really what matters.
Now, USD/INR is a similar story to the previous examples.
You can notice that the market is making higher highs.
Again, at this point, you don't want to be buying or chasing the price at its current price level.
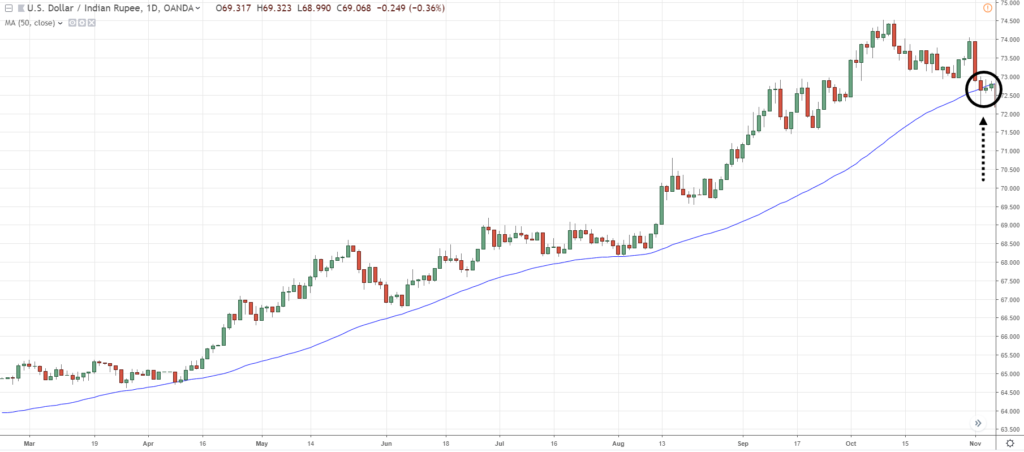
A much more favorable risk to reward is to wait for the market to retest the 50-period moving average:
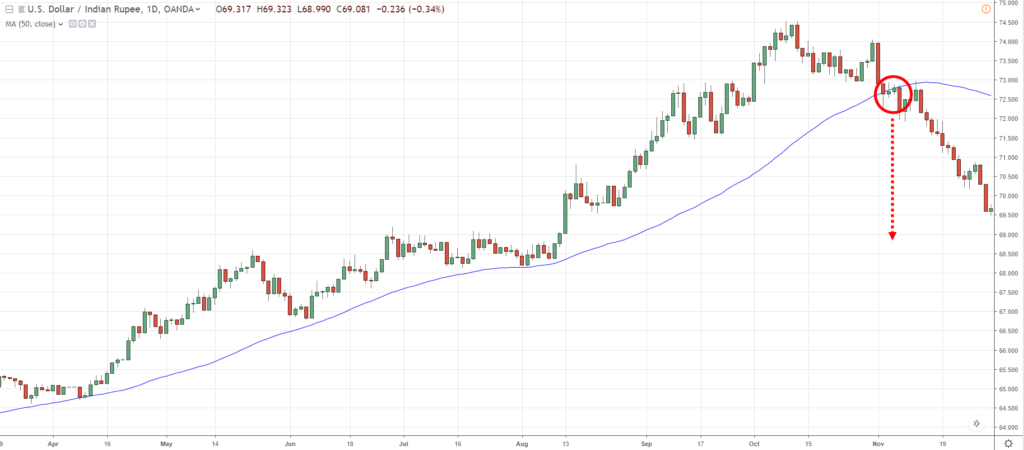
In this case, you can tell that we did miss the move until it broke down:
But the idea here is that in the long run...
You really want to be trading when the price is as close as possible to the moving average.
If not, you would see that often, the market makes a huge move then snaps back to the moving average and you get stopped out of your trades.
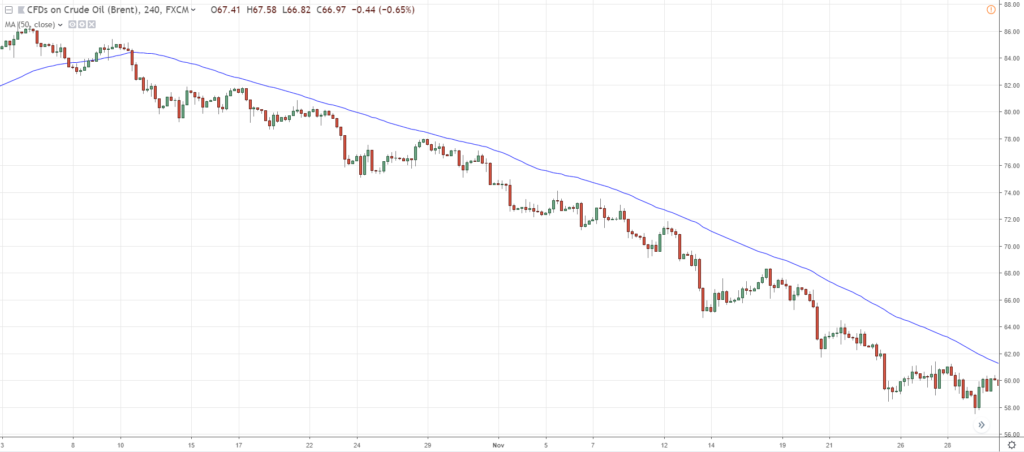
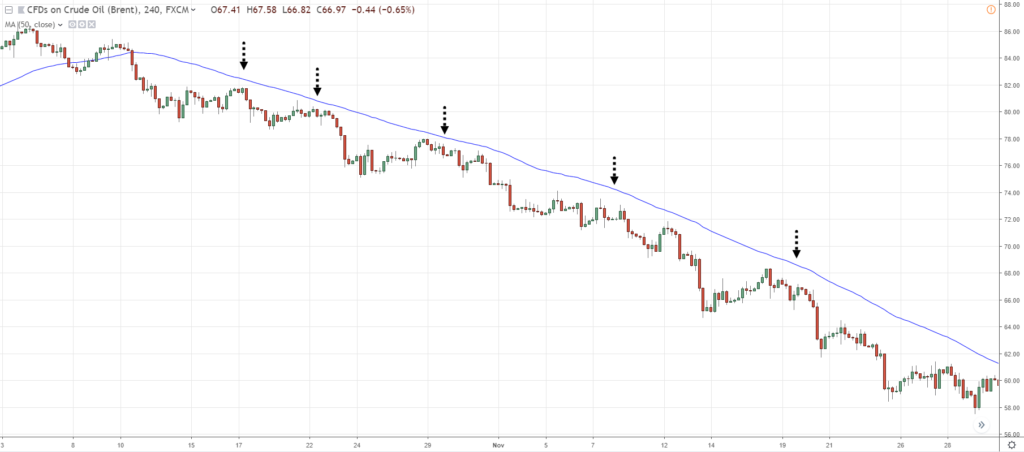
Another example is BCO (Brent Crude Oil):
Again, if you look at the 4-hour time frame...
Notice that this market tends to close towards the 50-period moving average:
Again, you don't want to be chasing the market over here.
The price is so far away from the 50-period moving average!
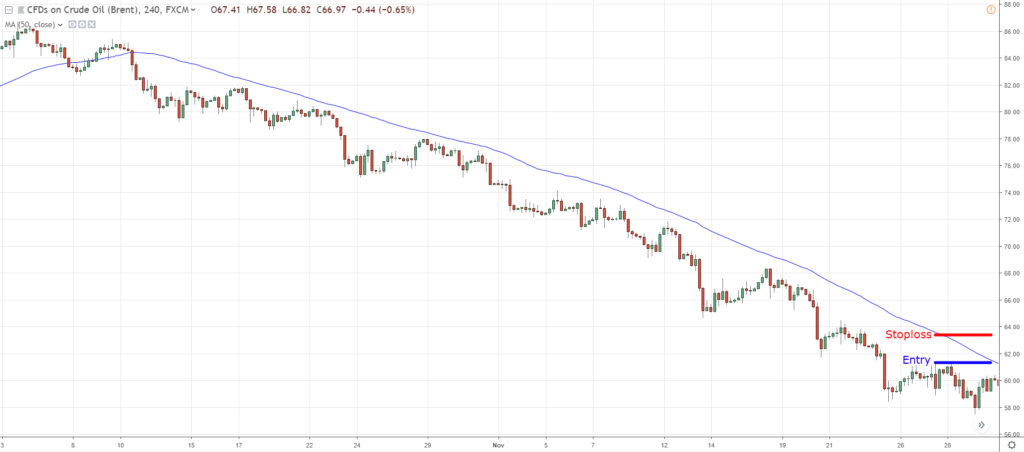
You have to wait for it to pullback and get a more favorable trade location.
It's a more favorable trade location there, don't just chase the market.
Look at where it is relative to its mean reversion area on the chart.
Sometimes, the price will respect the 30 or the 40-period moving average, but it doesn't really matter.
The concept is what matters.
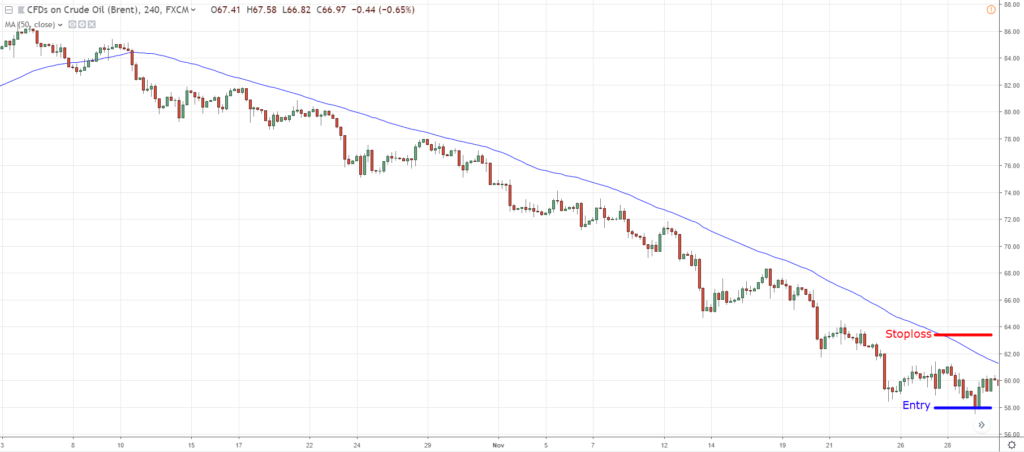
The beauty of it is that you can trade as close as possible towards the area of value somewhere here:
Your stop loss can be tight.
Compared to chasing the market, going short over here:
Your stop loss here is now wide.
Moving on...
How to use moving average to identify the path of least resistance
This is otherwise known as the trend!
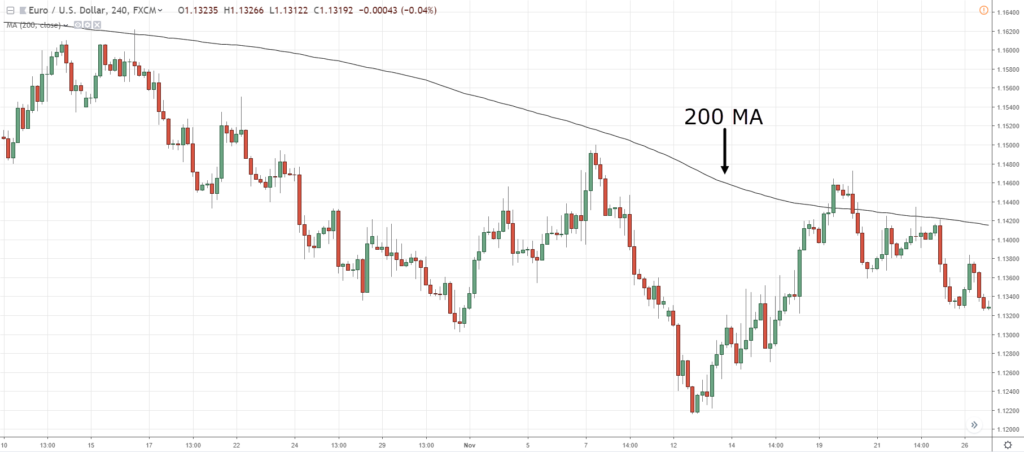
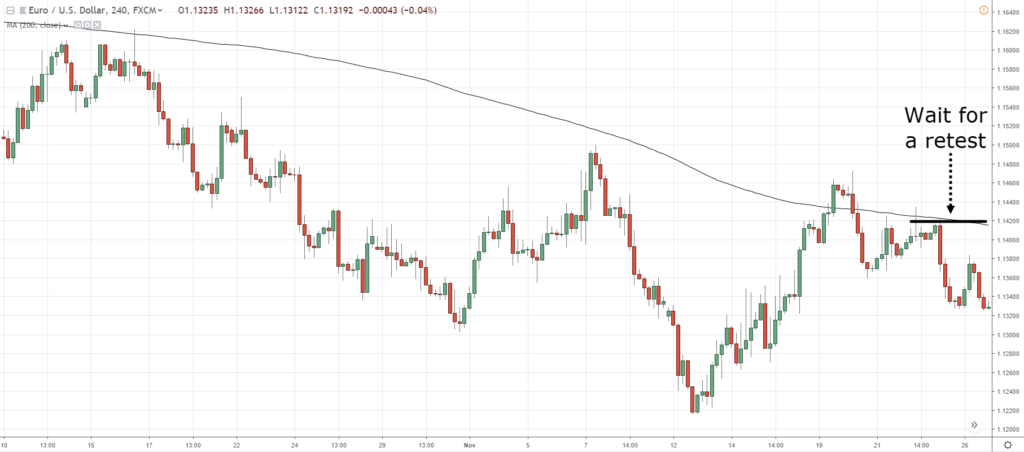
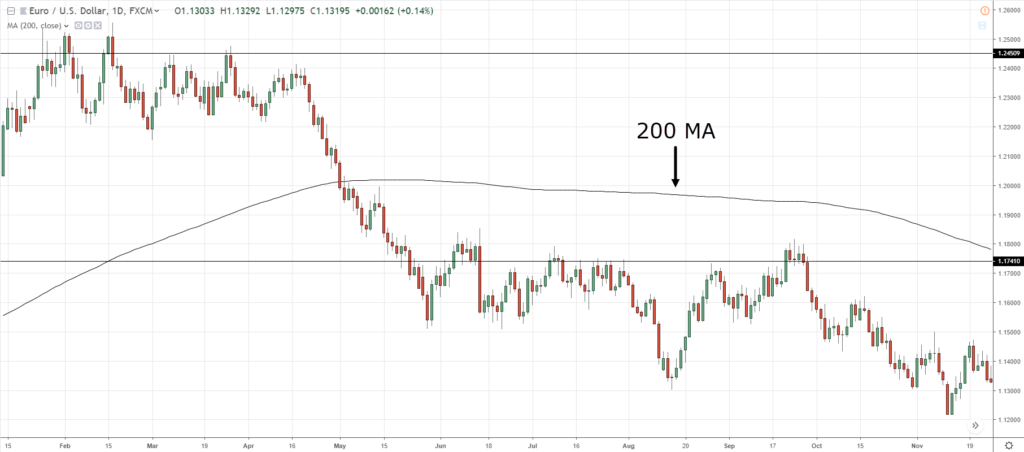
Let's have a look at an example on EUR/USD:
Notice that the price is below the 200 MA.
Every time I look at a trend, I like to use the 200 MA to see where the long-term trend is.
If you've seen my videos...
I plot my 200 MA on the daily time frame.
And I always say that if the price is below the 200 MA, look for short setups.
If the price is above the 200 MA, then look for opportunities to buy.
In this case, the price in EUR/USD right now is below the 200 MA
So, opportunities to short this market are when makes a retest of the swing high over here with the confluence of the 200-period moving average:
Again, this will help you trade along the path of least resistance and you will actually increase the probability of your trades.
Because you're now trading with the trend.
So, the 200 MA is a very useful guideline to knowing whether it should be long or short.
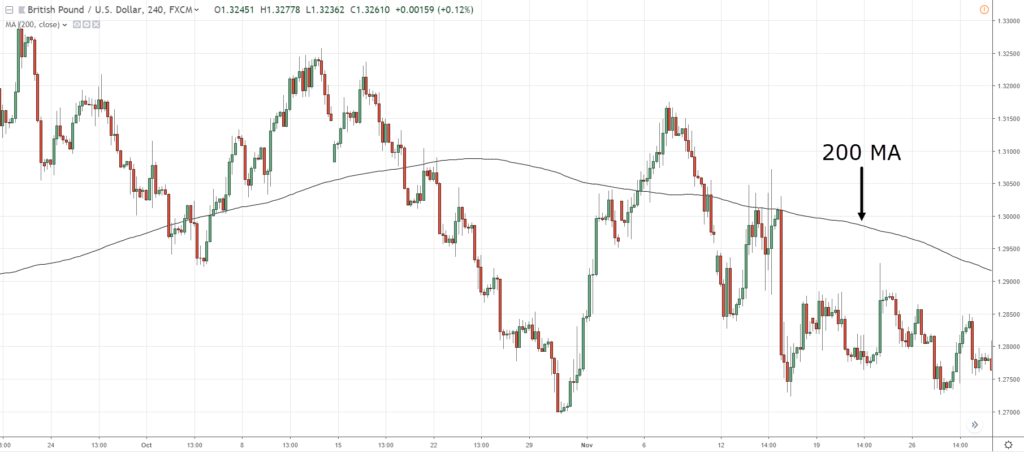
Another example is GBP/USD:
The concept again is the same.
As you can see, the price is below the 200 MA.
What should you be doing?
You want to be shorting the market.
You want to be selling!
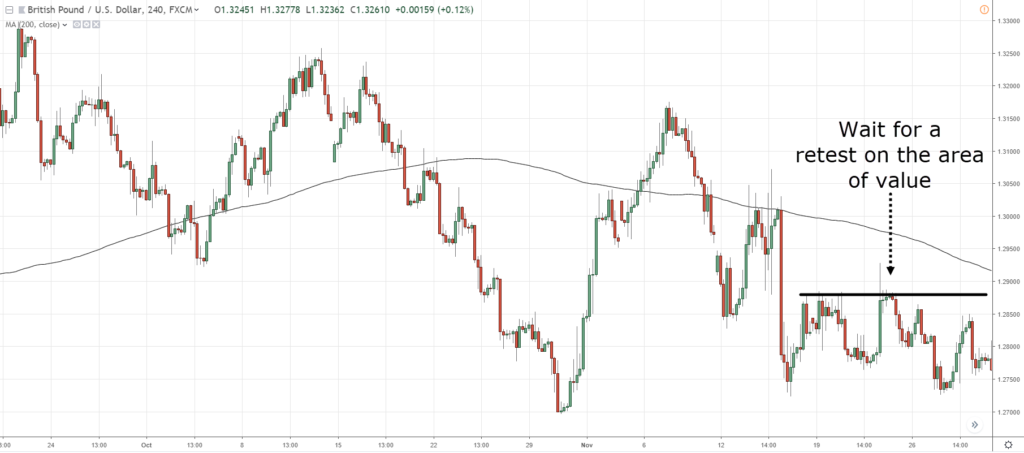
Again, where do you sell?
At the area of value like this swing high over here:
The market could retest higher and get a price rejection.
Okay?
This is a very simple barometer or guideline to know what direction you should be trading!
However, I also want to share with you that no indicator works perfectly.
There's always pros and cons to it, even the 50 MA that I shared earlier.
If you wait for an area of value, the price might move further in your favor and you're not in the trade.
That could happen as well and the same thing for the 200 MA.
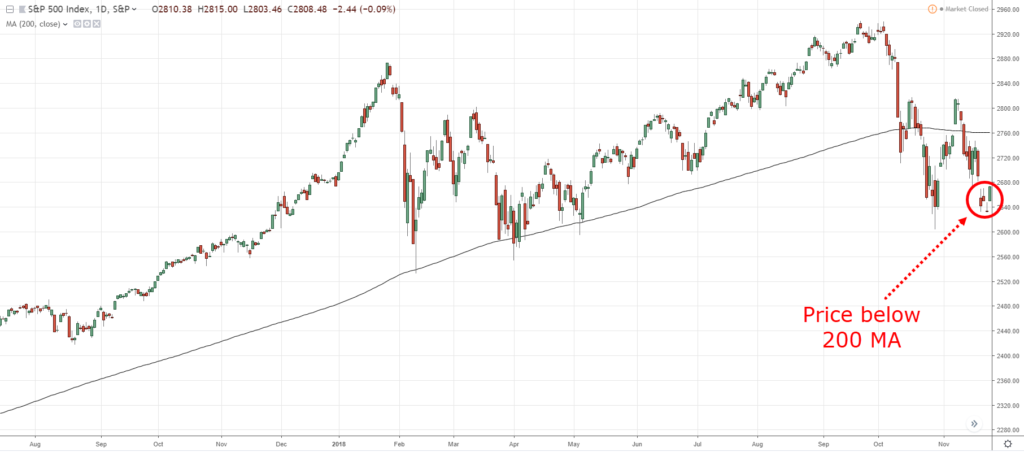
Right now, you can see that the price is below the 200 MA on the daily time frame:
What I'll do is buy.
However, if you think about this.
Right now, if the prices come back into this swing high:
The market is now back above the 200 MA!
So, you should be long!
You might face this confusion or conflict.
Because we are trading from an area of value but it's trading against the long-term moving average.
What now?
If you ask me, I would always give more weight to market price action, that comes first.
Because moving average, after all, is a lagging indicator.
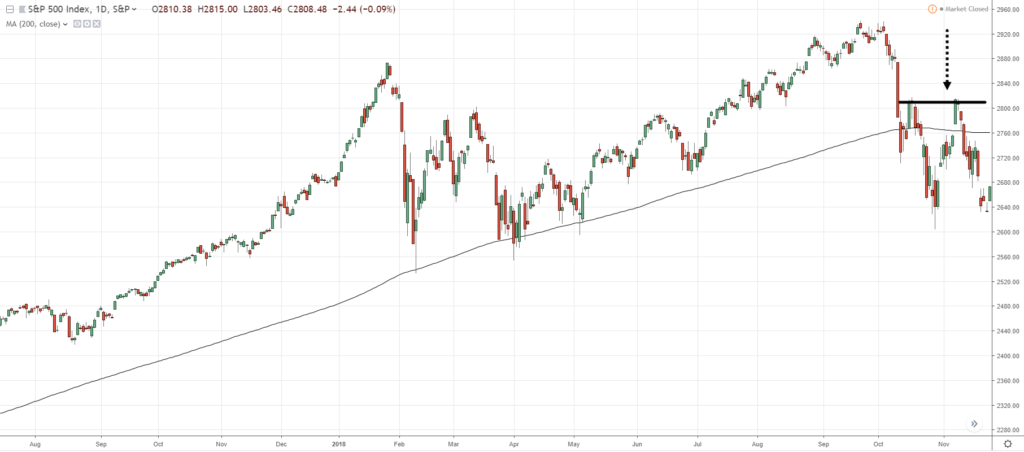
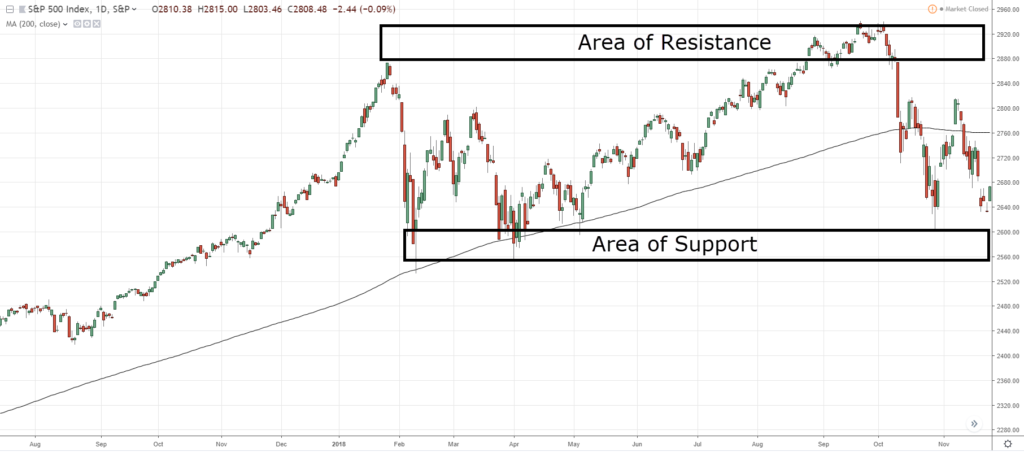
Now, from a price action perspective, you can see that this is an area of support and resistance:
Yes, the price is below the 200 MA on the daily time frame, so you should be short the markets.
But if the price were to come to this area of support, I'm not going to short just because the price is below the 200 MA.
This is where you have to use a bit of discretion, to know what comes first.
For me, price action always comes first.
As I've said, 200 MA is just a guideline for those of you who are new to trading and for those who don't know how to analyze the market yet.
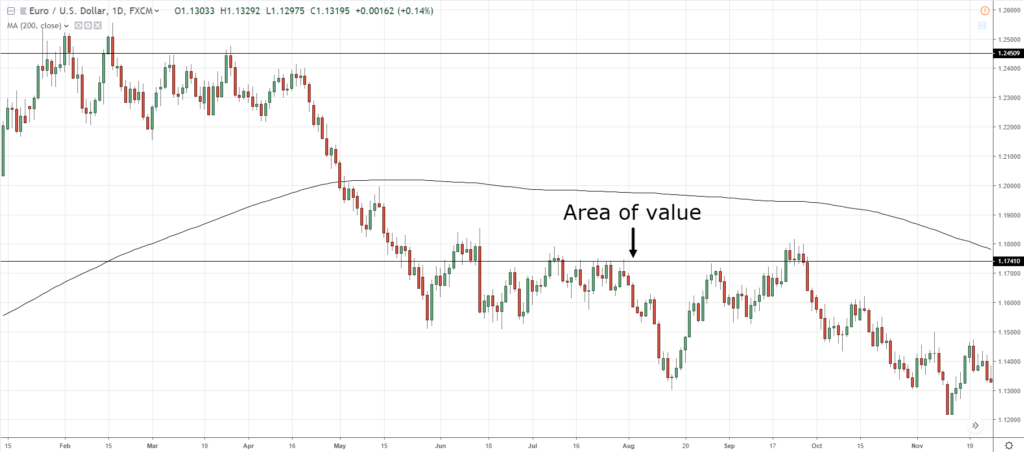
Going back to EUR/USD:
The daily price is below the 200 MA on the daily time frame.
The area of value on the daily time frame is somewhere here:
Somewhere towards the area of resistance which has a nice confluence with the 200 MA.
This is where I get my bias because I trade a lot of the daily time frame and the 4-hour time frame.
I always pay attention to where the trend is on the daily time frame and from then on, I would base my trading decisions!
But bear in mind, as I've shared earlier...
There is a very high possibility where you will face a conflict between market structure and the moving average.
For me, always go with market structure because moving average lags the market.
The final tip that I have for you for moving average is this...
How can you use the moving average to trail your stop loss
This is very powerful yet very simple.
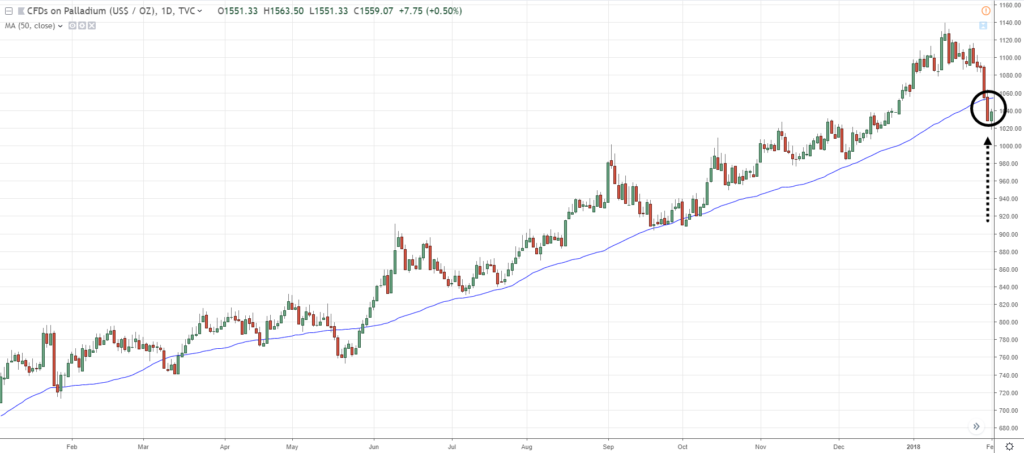
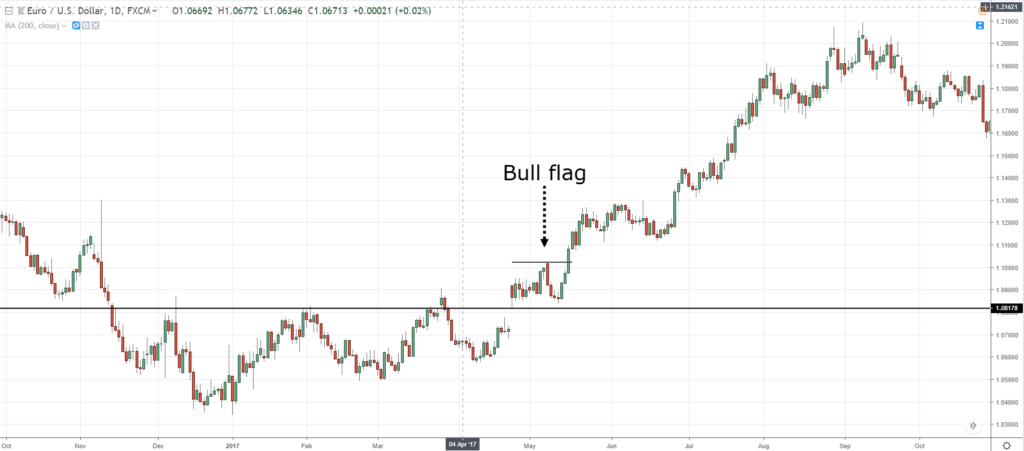
Let's say for whatever reason, you look back at this chart:
And see that it formed somewhat of a trend continuation or a bull flag pattern.
How could you have ridden the trend?
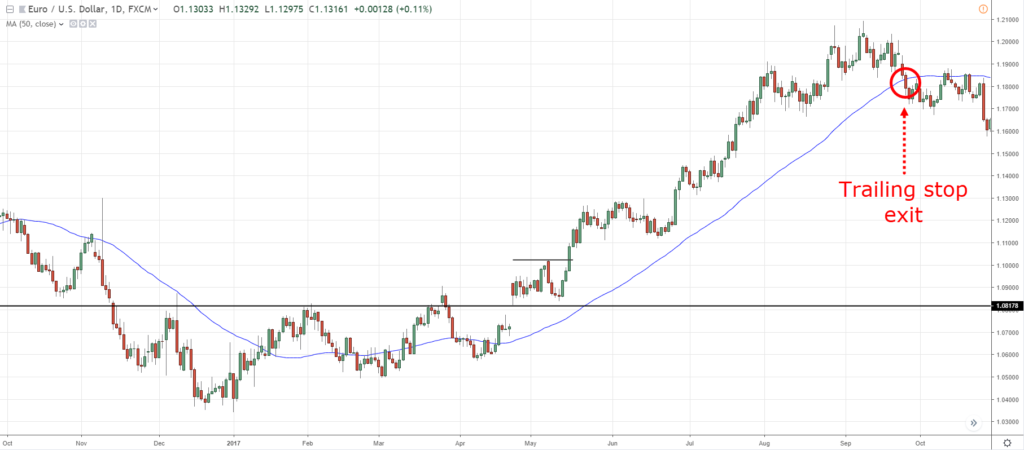
In this case, you can actually use the 50-period moving average.
Notice that the market only breaks and close at this level over here:
This means that you would have ridden a pretty huge move.
Ultimately, some of you might choose to be more long term.
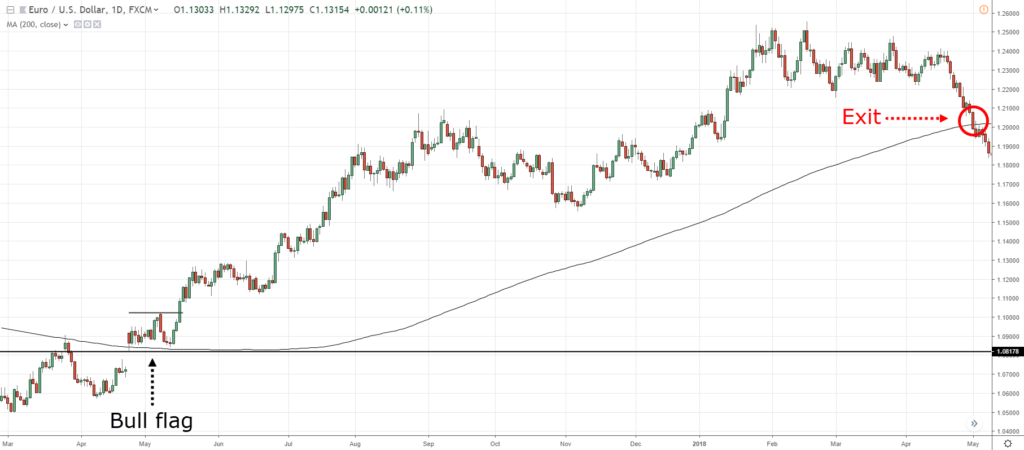
You can even trail with the 200 MA:
You can see that you would've stayed in the trade longer and exit where the price breaks in close over here:
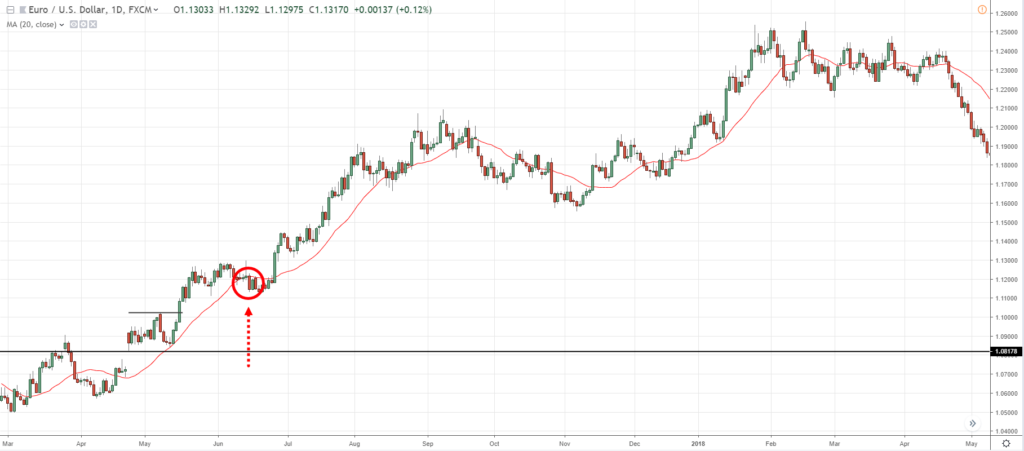
Alternatively, some you might choose to go with a shorter term like the 20-period moving average.
And you would have exited the trade earlier with a smaller profit here:
At this point, some of you might be thinking, "I guess I should go with the 50 or even the 200 MA because I get to ride longer-term trends."
Well, the answer is yes and no.
It really depends on your trading goals because in this example, even though you have a smaller profit with the 20 MA...
Your equity draw down would be less because you give back lesser open profits.
Whereas the 200 MA, you actually risk back giving even more profits.
However, the upside to the longer-term moving average is that you get to catch a longer-term trend.
You don't get shaken up easily.
So, there are real pros and cons when it comes to whether you want to use a shorter term moving average or a longer-term moving average.
There's a no better approach.
It really depends on what type of trends that you want to capture.
As a rough guideline, if you want to capture the short-term trend, use the 20-period moving average.
If you want to capture a medium-term trend, use between 50-period to the 100-period moving average.
If you want to ride a long term trend, use the 200-period moving average.
So, this is how you trail your stop loss with moving average.
There is no magical parameter.
Trades like to ask, "Hey Rayner, what is the best number that works all the time?"
There isn't.
Focus on the concept, something that I've been saying quite a number of times in this video.
That is really what's important in trading, the concept.
With that said, let's do a quick recap to what we have learned today...
Recap
- How to actually identify the strongest market to trade by using a concept called relative strength
- How you can actually better time your entries by using the moving average as a guideline to help you identify an area of value
- How to identify the path of least resistance by using the 200 MA to help you identify the long-term trend
- How you can actually go about using a moving average to ride massive trends

