#5: Golden Cross Explained
Lesson 5
Hey hey, what's up my friends!
In today's video, I want to share with you on how the golden cross can help you improve your trading results.
But first…
What is the golden cross
Some of you might have heard this term before on the news, media, et cetera...
Saying that the S&P just performed a golden cross, the markets are now bullish, yadda, yadda.
What is it?
The golden cross occurs when the 50-day moving average crosses above the 200-day moving average!
There's another phenomenon called the death cross, is when the 50-day moving average crosses below the 200-day moving average.
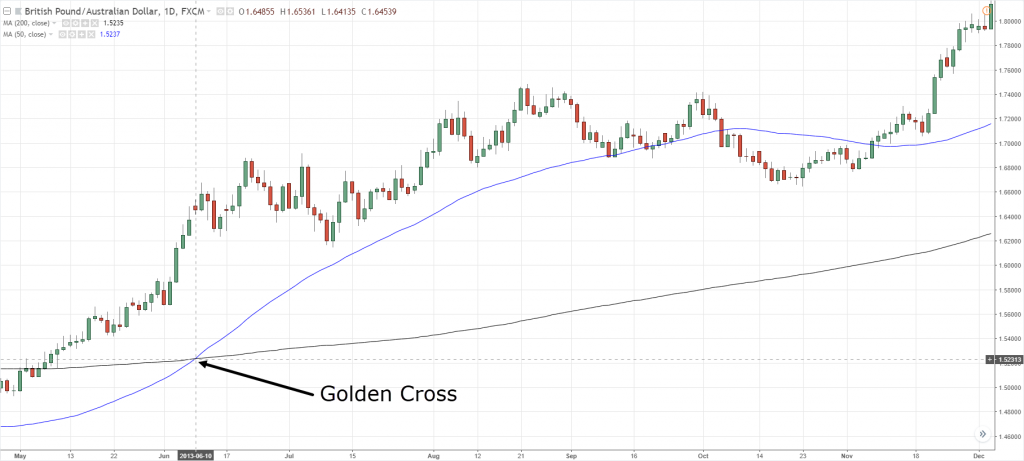
So just an example, you can see over here, this is a golden cross:
The blue line here is the 50 MA, this is the 200 MA.
This is where the 50 MA crosses above the 200-day moving average!
This is where we say the market has just performed a golden cross!
Here's the thing…
Does this golden cross have any validity?
Does it really work
Let's look at some of the findings since the 1930s:

Source: http://ritholz.com/2012/01/how-bullish-is-the-golden-cross/
Basically, this is where the number of times that a golden cross has occurred on the S&P!
During 1930, 1935, 1939, 1940, et cetera, until 2009!
You can see what they did is that whenever the market did perform a golden cross, what is the result one month later.
What is the result two months later?
What is the result three months later, and six months, and one year?
Generally, when you look at this as a whole…
We can see that whenever a golden cross has occurred six months to a year later, the market generally still remains bullish.
This is why you see there is more green than red in the source!
Because it tells you that generally, whenever a golden cross occurs...
You can expect that six months from now, or twelve months from now, the market will be higher than where it is right now.
So yes, there is some validity to the golden cross.
Moving on…
How NOT to trade it
Some of you now might be thinking…
“Okay, there is significance in the golden cross, so why not just buy when the 50 crosses above the 200-day moving average? That should be a winning strategy, right?”
Not so fast, my young padawan...
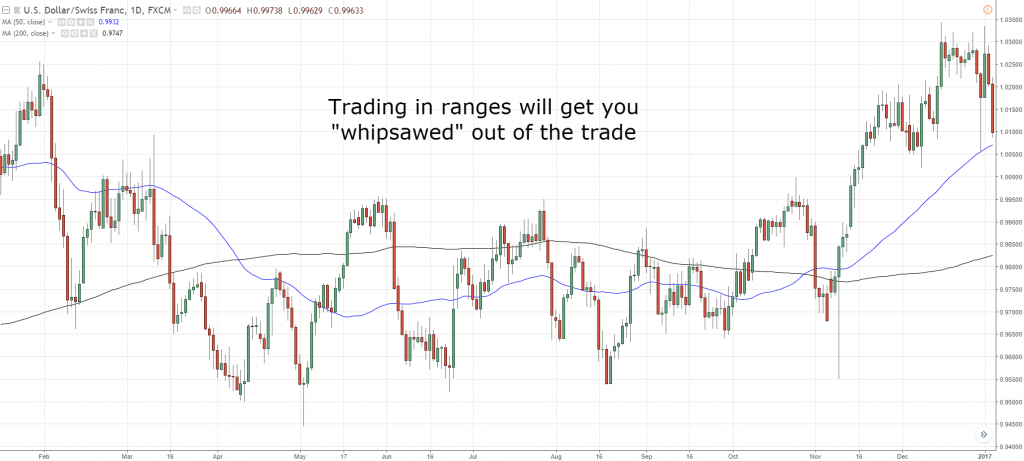
Because when the market is in a range, you'll get whipsawed pretty badly:
Now, I'm not saying that this strategy cannot work.
Because I've seen this type of strategy work for systematic trend followers.
But if you are not a systematic trend follower, don't try to trade the moving average crossover.
You'll probably get whipsawed to death, and it's really not something that I would suggest!
Be aware of blindly trading the golden cross, because when the market is in a range, you can be whipsawed to death.
How, then, you should trade the golden cross?
One suggestion is you can use it as a…
Trend filter
You know that when the market forms a golden cross looking at the data in the S&P.
Is that the market tends to remain bullish for six months to a year from now!
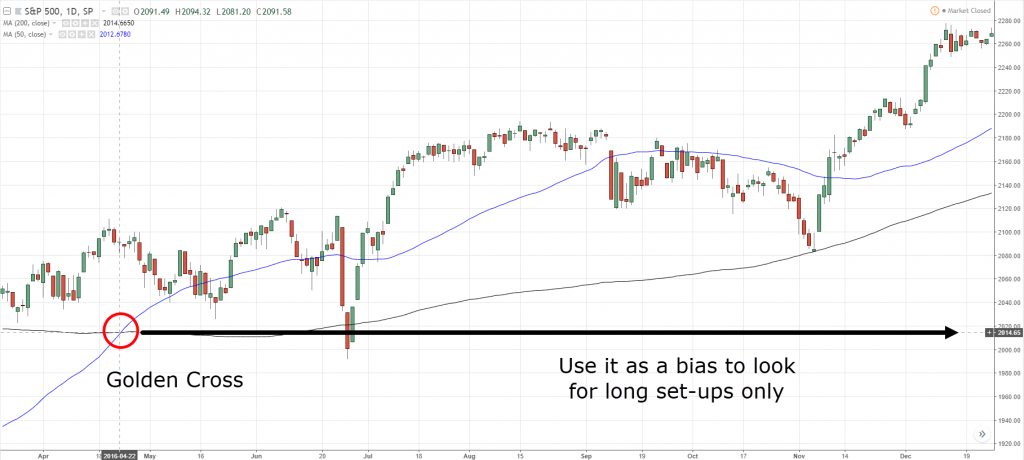
What you can do is use it as a trend filter.
Whenever the 50 crosses above the 200-day moving average, you would look for buy signals only:
It means you have permission to go long.
You can look for buy opportunities whenever a golden cross has occurred.
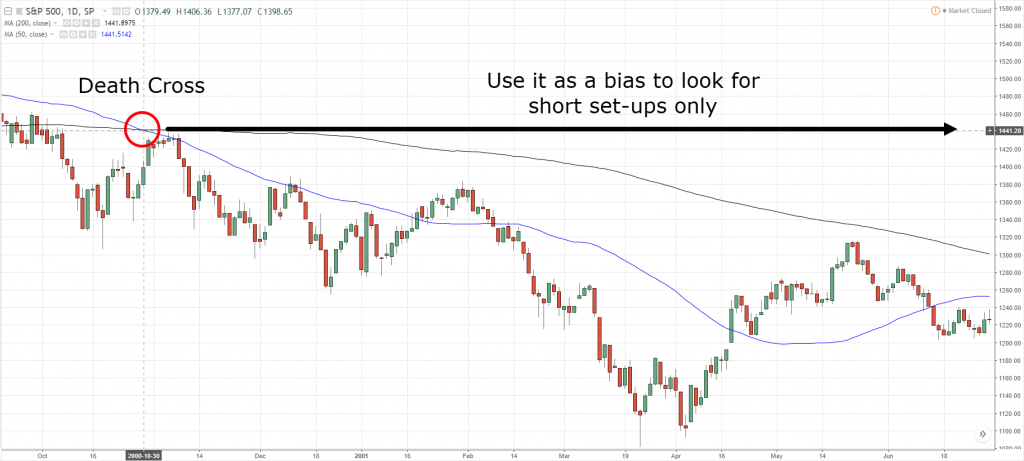
Likewise, if you are trading stocks and a death cross has occurred.
What you want to do is sell all your positions and remain in cash:
Because whenever a death cross occurs, there's a good chance that the market could be in for a correction or maybe even worse, a recession.
This could be a simple trend filter to keep you in cash.
To keep you in the defensive mode when the market is showing signs of weakness.
If you trade Forex or futures this can even be a permission for you to go short on the markets.
That's the first thing you can do!
Next…
How can you actually better time your entry trading with the Golden Cross
Here's an example...
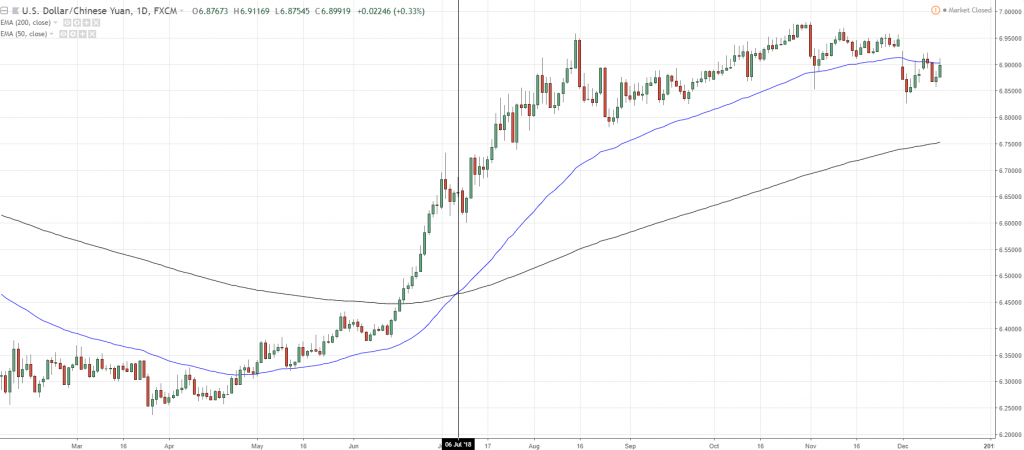
Over here, you can see that this is the USD/CNH:
You have this golden cross occurred somewhere around the 6th of July.
Where the blue line crosses above the black line; where the 50 crosses above the 200-day moving average!
What you can do is that now, you have the permission to go long, because the market is showing signs of strength.
It's bullish!
What you can is that you don't necessarily want to be trading over this particular time frame.
Because sometimes the market can be very overextended already.
If you're buying right after the golden cross just occurred, you're buying at very high prices.
What you can do is use multiple time frame analysis to help you better time your entry.
Again, this would firstly serve as a trend filter:
1. The golden cross just occurred on the daily time frame.
2. You go down to a lower time frame to better time our entry.
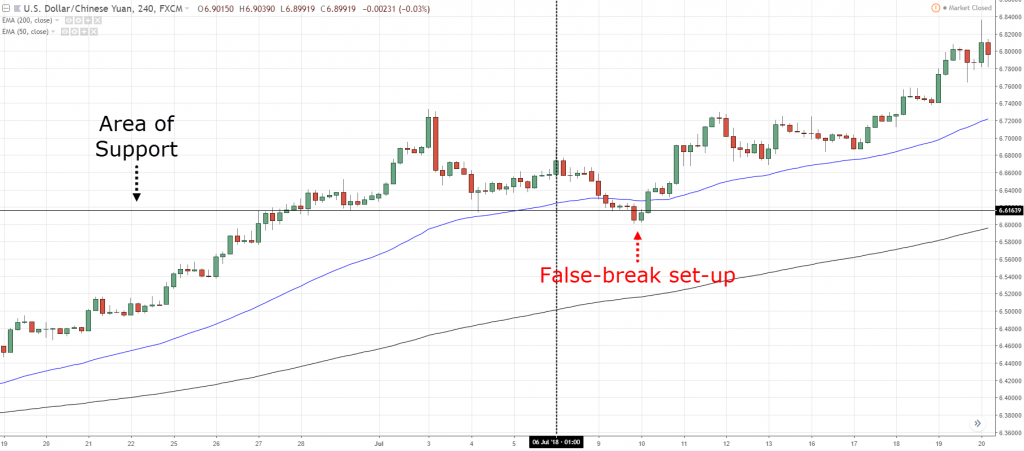
In this case, we can go down to the 4-hour time frame and look for a trading setup:
Earlier we saw that the 6th of July was where the golden cross occurred.
Looking at a 4-hour time frame you can see that there is actually trading opportunities that you can trade off using the bias you had on the higher time frame!
For example, you can see that there's an area of support.
And you can see that on the 4-hour time frame the price came into this area of support.
Then it did a false break.
Traded below support and then break and closed higher.
This is a valid false break setup that you can use to trade and go long.
On top it, you saw that on a higher time frame, the daily time frame, the market is in an up-trend.
We have a golden cross.
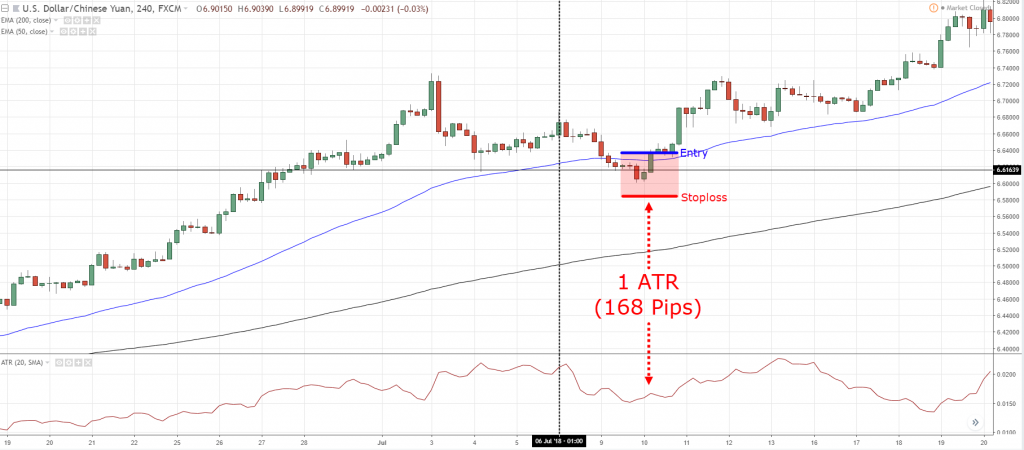
We can use this knowledge at the back of your head, and then go down to the 4-hour time frame to better time your entry.
This means that you can go long on the next candle and have your stop loss 1 ATR below this low:
Again, depending on what type of trading setup it is, whether you're going to ride a trend or capture a swing, that's entirely up to you.
You can see how you can actually use the golden cross to help you better time your entries using it as a trend filter.
This is just one example of using the golden cross and then using it on multiple time frames to help you better time your entries!
Moving on…
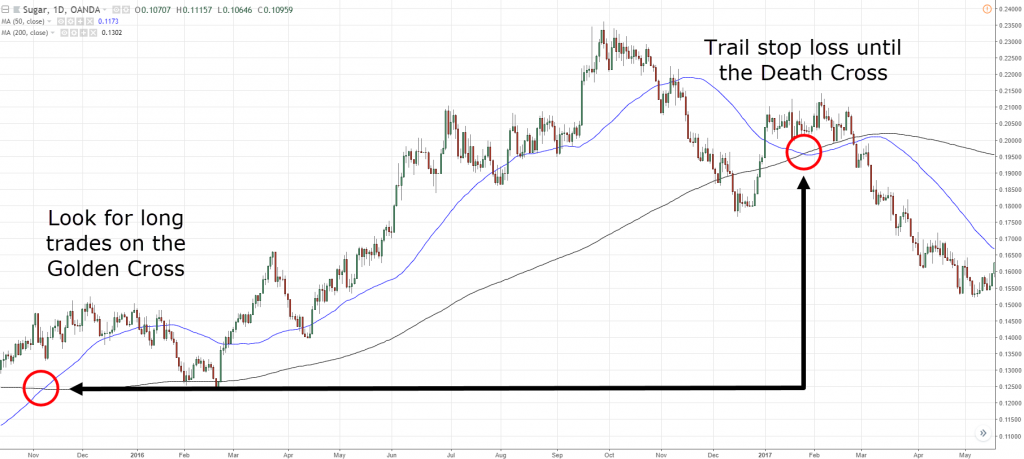
How can you use the golden cross to ride trends
Again, same concept…
You know that whenever the 50 crosses above the 200-day moving average, it's a sign of strength.
What you can do is that you can hold onto your position until the 50 crosses below the 200-day moving average:
Let's say for whatever example, you went long on a breakout set-up.
You can actually ride this trend until the death cross occurred where the 50 crosses below the 200-day moving average.
We can see that this golden cross concept can also help you ride massive trends in the markets.
All-in-all, this is a very versatile concept that you can use to time your entries, use it as a trend filter, or even help you ride massive trends in the markets.
Let's do a quick recap, shall we?
Recap
- A golden cross occurs when the 50-day MA crosses above the 200-day MA.
- The death cross is when the 50 crosses below the 200-day MA.
- Don't trade the crossover blindly, because you might get whipsawed in a range market. Instead, a better way to use the golden cross is to use it as a trend filter.
- You can also use the golden cross to help you ride massive trends in the market.
Well, that's it.
I have come towards the end of this video.
I hope you got value out of it.
If you've enjoyed this video, hit the Like button.
Subscribe to my YouTube channel, and if you have any questions, leave it below and I will do my best to help.
That's it, I wish you good luck and good trading. I'll talk to you soon.

