#5: 3 Powerful Trend Reversal Strategies
Lesson 5
Hey hey, what's up my friends!
In today's video, I'll share with you practical strategies and techniques that you can use to identify trend reversal in the markets.
I know often most of you are thinking of buying a stock or trying to go long.
And the market has moved up so much already.
When the pullback comes, you're wondering, "Is this for real? Is this a pullback or is this the reversal of the trend?"
I'm going to share with you three things that you can pay attention to look for to help you identify trend reversal in the market.
The first thing that I want to share with you is what I call the…
Break of structure
Think about this…
In a trending market, let's say an uptrend.
You know the price makes a series of higher highs and higher lows:

What do I mean by a break of structure?
The break of structure means that the first clue that the market is telling you that it's about to get weaker or it's about to reverse…
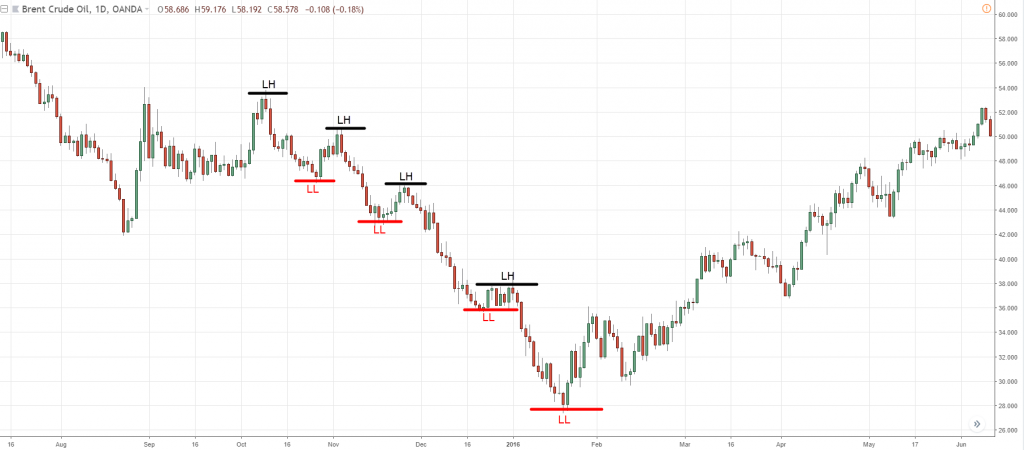
Is when you have a break of the structure where the price makes a new lower low and lower high:

In this case, you have a lower high and a lower low.
This is the first clue to you that the market is about to reverse lower.
There's no guarantee, but it's a clue given to you by the market that “hey, there is a break of structure, the price could potentially reverse lower.”
Let me share with you a few examples.
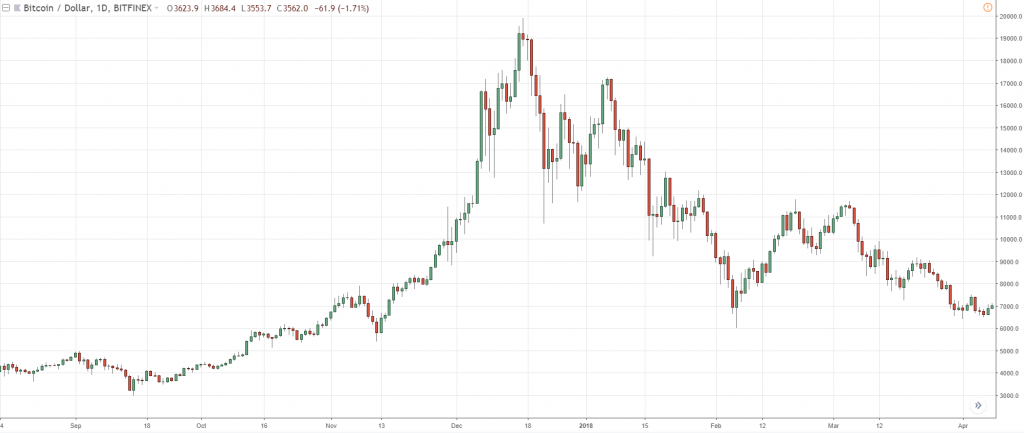
This is the Bitcoin:
If you're aware, in 2017 bitcoin had this meteoric rise to 20,000.
People are buying, going long.
You can see a strong parabolic move higher.
Now, at what point would you be alert that, "hey, this trend is about to reverse?"
Again, the concept I just shared with you, an uptrend, higher highs, and higher lows.
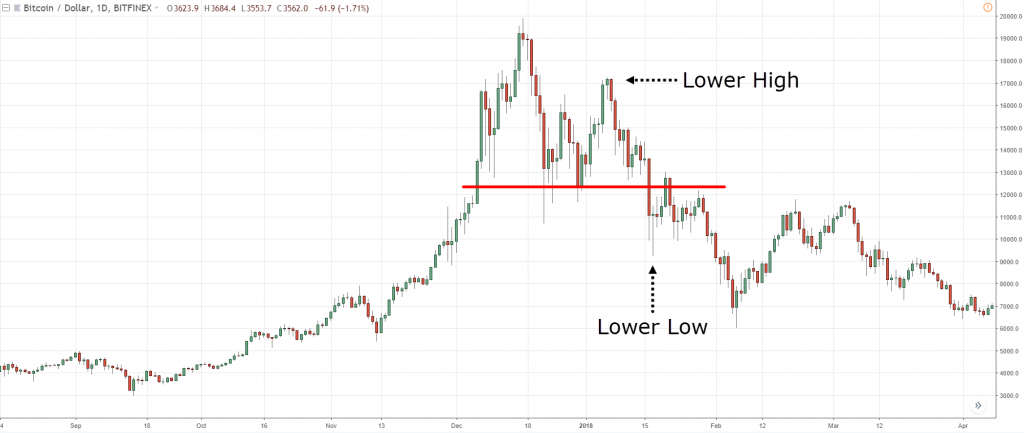
We are looking for a break of structure, what you are looking for is a lower high and a lower low.
At this point, you have actually got a lower high, and when price breaks below the area of support, you have a lower low:
This tells you that this trend could be weakening.
The trend could reverse.
You really want to be careful down here.
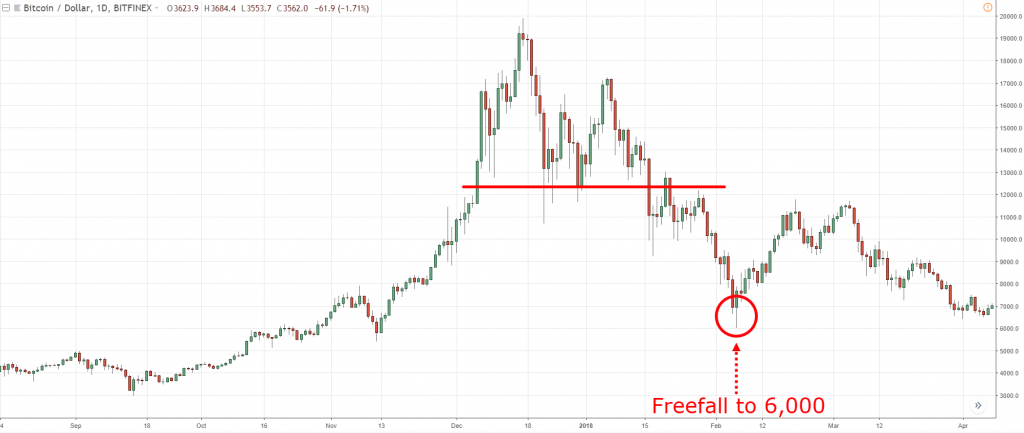
In fact, this pretty much sealed the deal as bitcoin went to the lows of 6,000 over here:
This would be a confirmation where it's telling you that the trend on bitcoin is about to end when you get a lower low and a lower high against the existing uptrend.
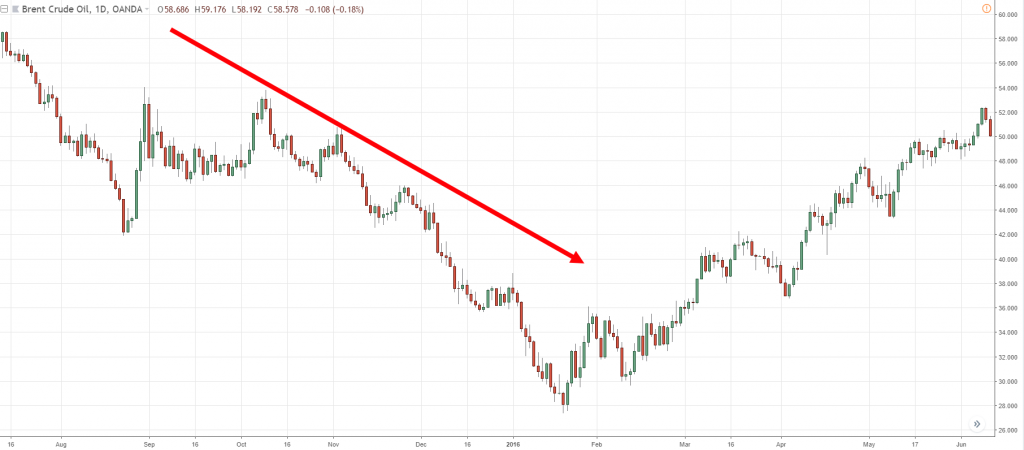
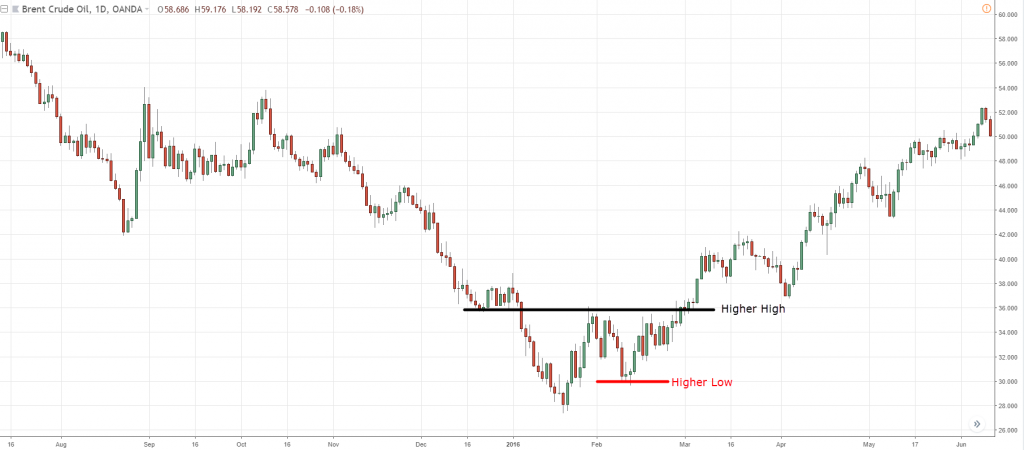
Another example, if you recall BCOUSD in 2015, 2014 had a very strong decline.
It declined to a low of about $20-$30:
Again, can we apply this concept, a break of structure?
We can see that previously the decline, a series of lower highs and lower lows:
Simple market structure.
At this point, this is where things got interesting!
Right now, you have a higher low:
When the price breaks above here...
You have a higher high, because the price broke this prior resistance.
This, again, should give you a strong clue that “hey, this downtrend could possibly have come to an end!”
You don't hear me using words like guarantees, confirm, bottom out or top out.
There is no such thing as a guarantee in trading or in technical analysis or whatsoever.
If anyone promises you guarantees, run far away.
This is why I like to use words like probably, likely, possibly.
There is always this element of non-guarantee behind it.
Anyway, this is another example of the break of structure.
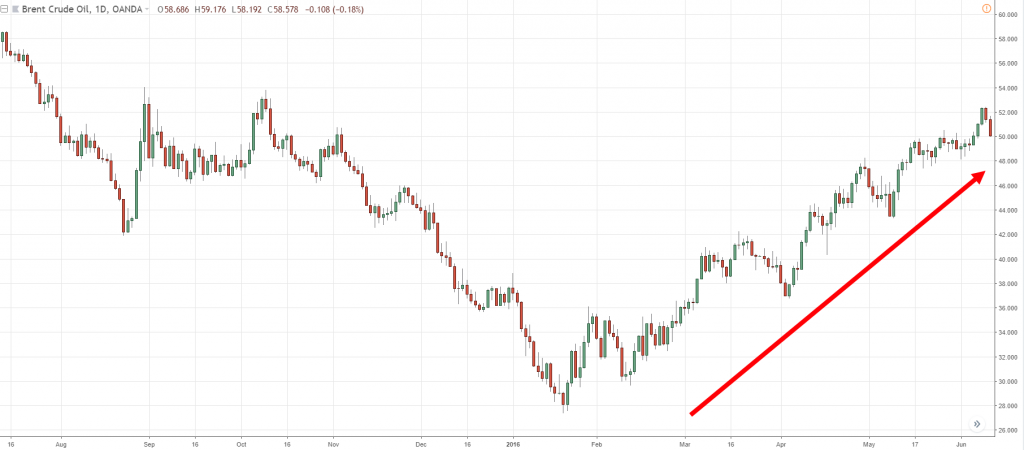
You can see the price did eventually rally up higher from here:
Another technique I want to share with you is what I call…
The higher time frame structure
It's important to pay attention to where you are in terms of the big picture.
This is why you often hear traders say, "Hey, you know you should pay attention to what higher time frame is doing."
That is so-called giving you the bird's eye view of where you are in the big picture.
This is why I want to share with you about the higher time frame structure.
Let's look at the first example.
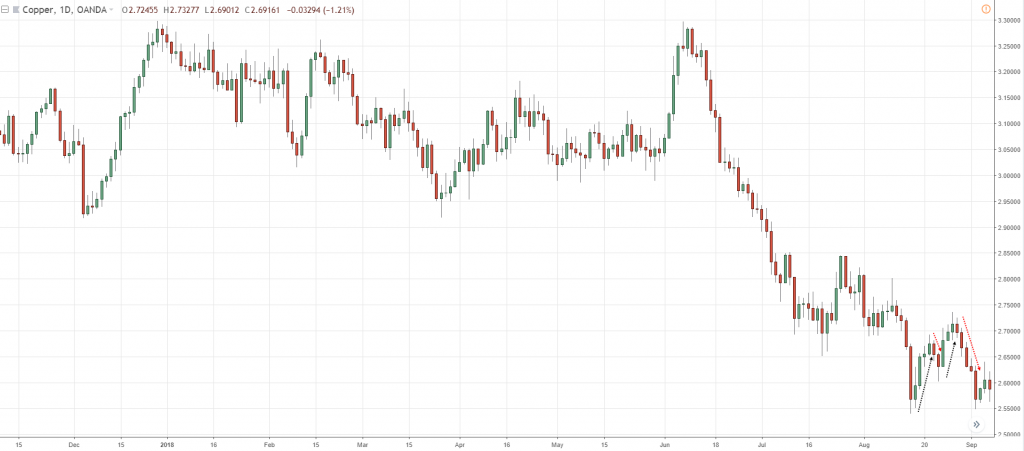
Over here, you might wonder and look at this chart, "Hey, Rayner, why did the price come up here and then decline? What's so magical about this area?"
Price apparently breaks above this swing high over here and then it collapses lower.
At this point, a lot of traders were unaware.
They buy the breakout, only to get caught on the wrong side.
Why is that?
Again, I mentioned something called the higher time frame structure.
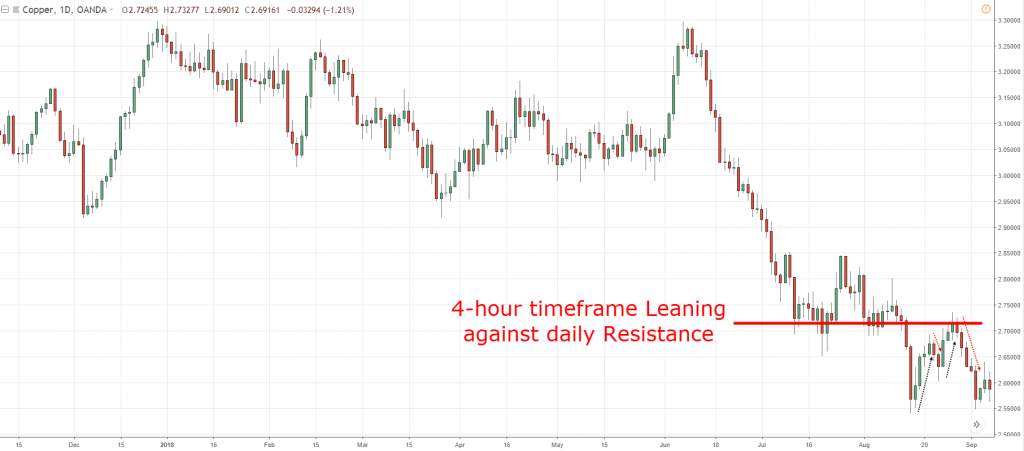
Let me point out to you, if you look at this chart over here, you can see the higher time frame.
This is the daily time frame:
What you've seen earlier is in the 4-hour time frame.
You see that over here on this higher time frame.
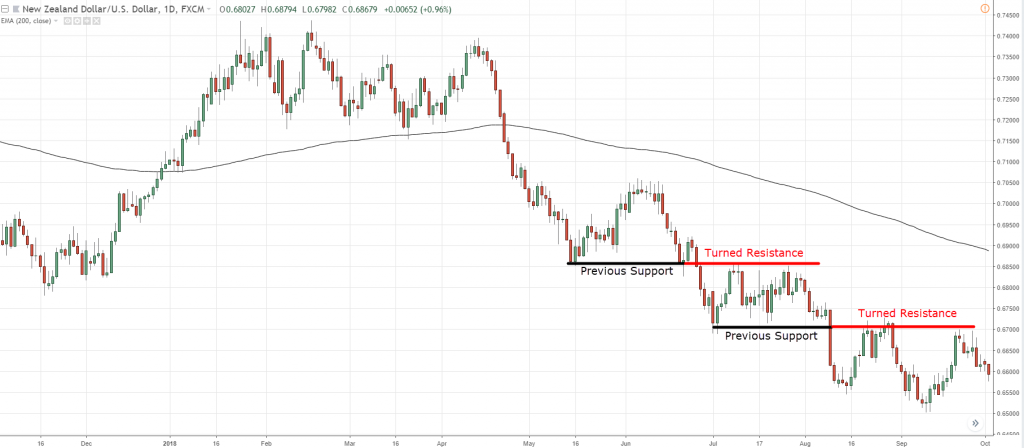
This is why you have previous support that could act as resistance.
The breakout that you've seen earlier is actually this portion over here:
You're buying the breakout into this previous support that could act as a resistance, which is a low probability breakout.
You are buying into huge selling pressure.
It's pretty much no wonder why this market reversed from here.
This is what I mean by the higher time frame structure.
You want to pay attention to where the price is coming into, especially if it's coming to any higher time frame structure, like support resistance, trendline, channel, et cetera.
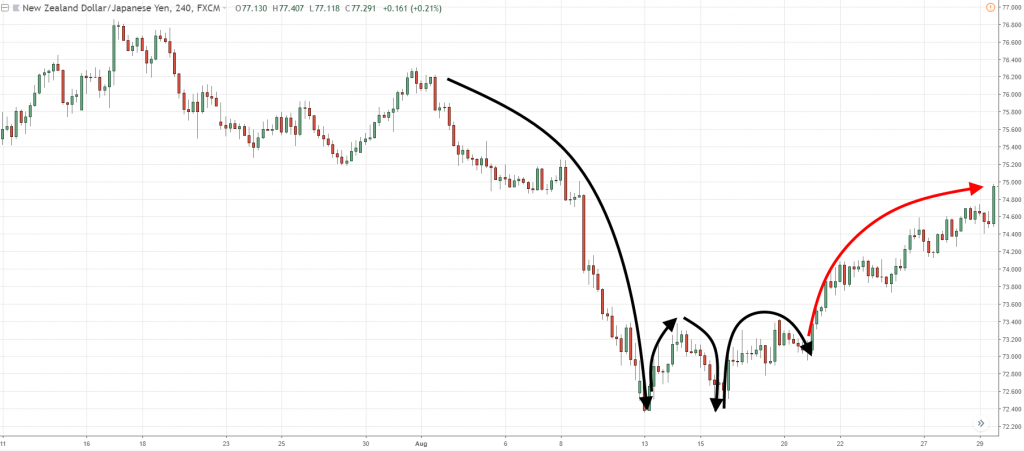
Another example over here, NZD/JPY on this 4-hour time frame…
Price comes down lower, bounce, doing, doing, and boom...rally:
“Hey what happened? What's going on?”
A clue right?
Higher time frame structure...
Although, I do agree that you have a series of higher lows and higher highs, as the price breakout of this resistance as well.
I do agree.
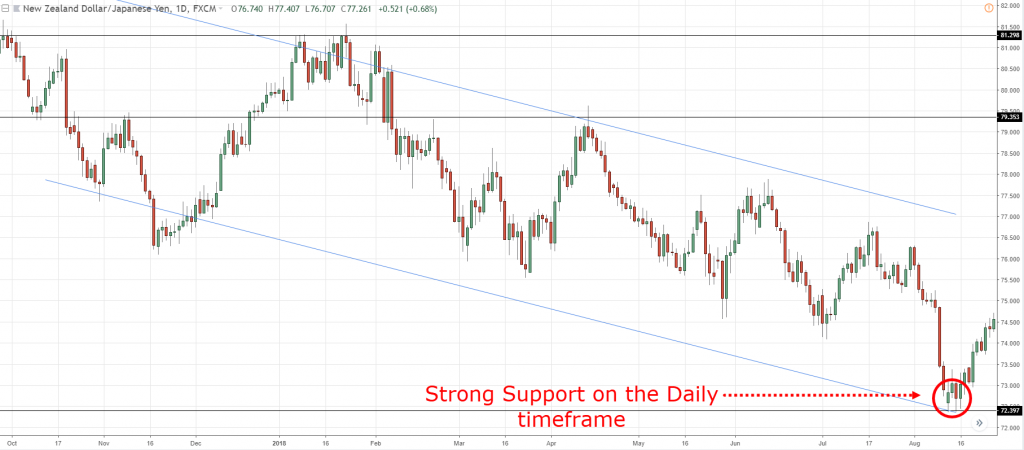
Another thing that I want to share with you to look out for is higher time frame structure!
Looking at the daily time frame:
You can see that over here I notice quite a bit of line over here.
But what I want you to pay attention to is the encircled portion.
It came into strong support on this daily time frame.
In fact, I think it's even obvious on the weekly time frame.
If you draw a trend channel, it has this confluence of this trend channel as well.
Again, no surprise that hey, you could expect a bounce or even a reversal of this area on your chart.
This is what I mean by the higher time frame structure.
The last thing that I want to share with you is to pay attention to the…
200-period moving average
For those of you who have been following me a while now, you know that I tend to say that if the price is above the 200 MA, try to stay long.
If the price is below the 200 MA, try to stay short!
The reason is quite simple actually...
If you think about this, the 200-period moving average, it summarizes the prices of the last 200 candles.
If the price right now is above the 200 MA, it is telling you the price has been trending higher!
That's why it's above the 200 MA.
If the price is below the 200 MA, it's telling you that the price has been trending lower.
This is a simple way to tell you what's the long-term trend of the particular chart that you are trading.
Notice that I use the word “long-term trend of the particular chart of your trading,” because it could be the 200 MA on the 5-minute time frame.
That isn't really a long-term trend, because it's a five minutes time frame.
Likewise, it can be a 200 MA on the daily time frame.
Then hey, that's a pretty long-term frame.
I would say it's the long-term trend of the chart that you are trading, depending on what time frame you are looking at.
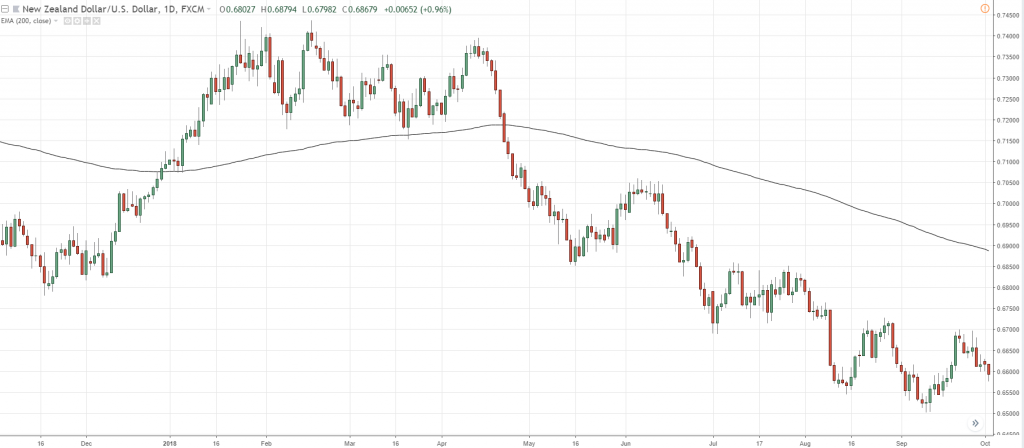
Anyway, let's have a look at the example. This is the 200 MA on the daily time frame:
How do we apply this technique?
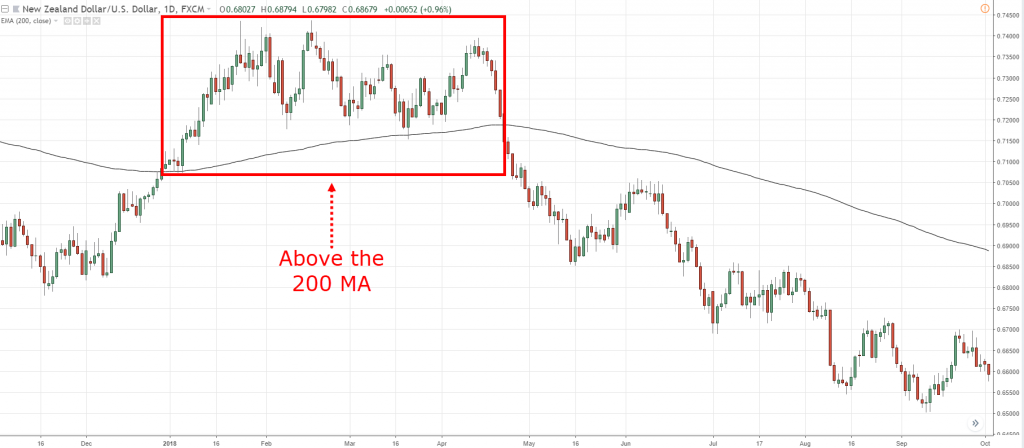
Again, at this point over here, the price is above the 200 MA:
I said half a long bias, I didn't say buy.
This means that you want to look for long opportunities.
You want to look for long opportunities to buy in this market condition.
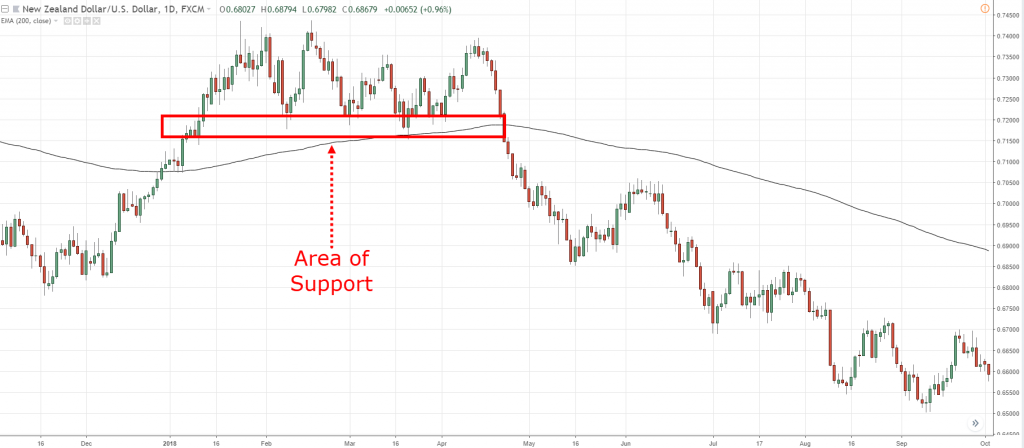
From the looks of it, I would say this is an area of support:
Every time the price comes into an area of support it forms a price rejection that is a valid trading set up.
On top of it, you know that you are trading together with the long-term trend, which is on the uptrend.
There are a couple of potential setups on this.
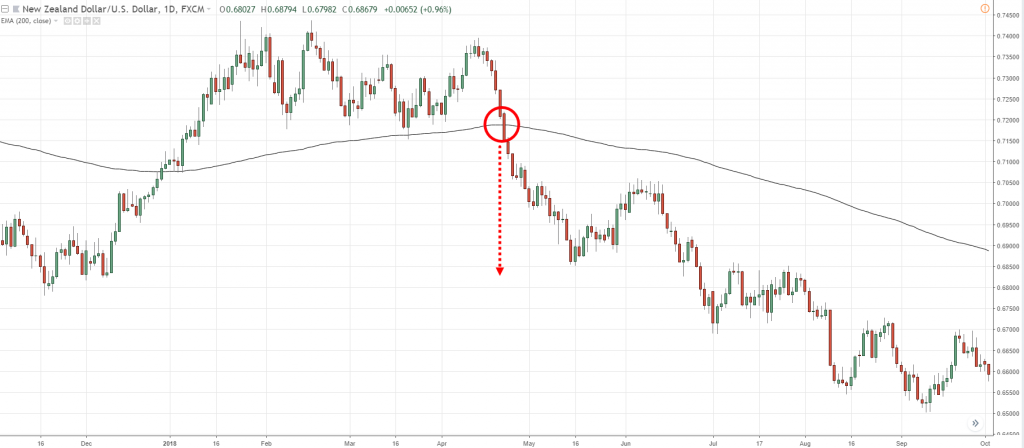
But this one, price just sliced through it:
There wasn't any price rejection of anything, for me, there is no reason to be long.
Now that the price has traded below the 200 MA ... You say to yourself, “Hey, I have a short bias.”
Now you can look for opportunities to go short!
You can look at previous support and resistance or right over here:
Now, this is how you can actually use the 200 MA to give you a bias to know whether it should be long or short.
Then, just reference to a market structure like support and resistance.
Or maybe moving average to kind of identify the area of value that you want to trade from.
This is how 200 MA could give you or alert to you that the trend may be about to reverse.
Another example, shall we?
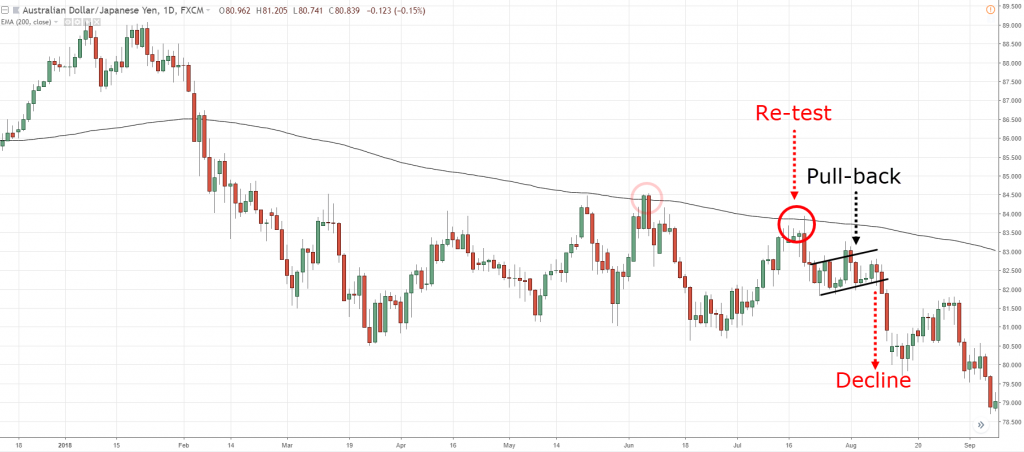
Aussie Dollar against the Japanese Yen.
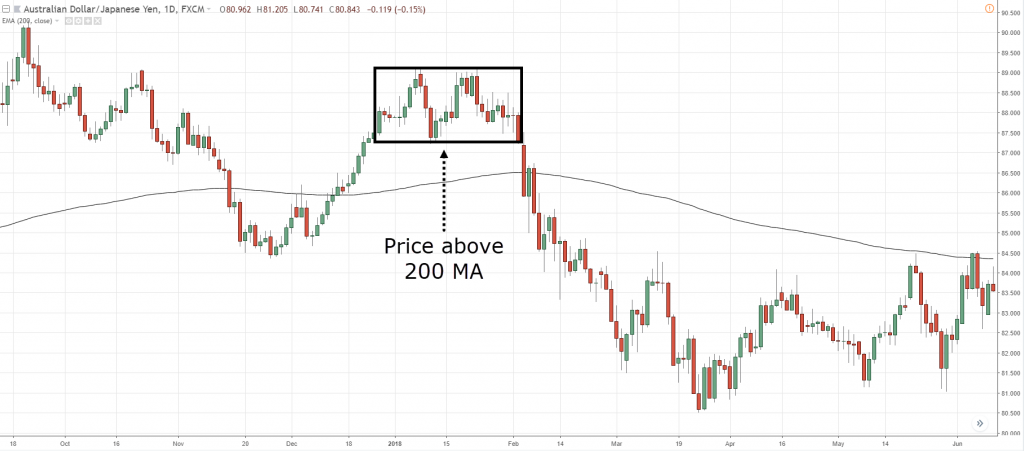
Again, the price at this point is above the 200 MA:
Again, you should have a long bias.
Another question is: “Do you have a long trading setup?
In this case, to me, there isn't.
Because there isn't any price rejection.
The price just pretty much went through it.
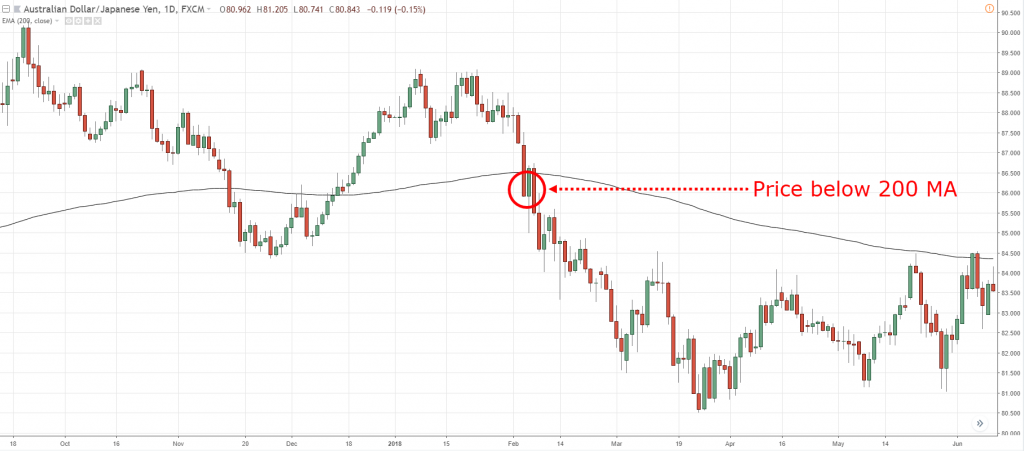
At this point now, the price is below the 200 MA:
My bias has gone from long to short.
Again, I ask myself…
“At what level on the chart do I want to trade?”
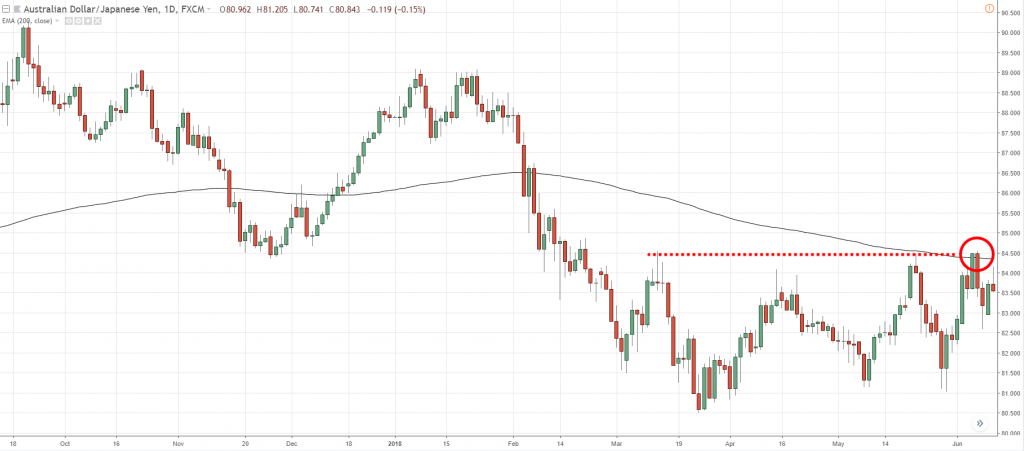
As the price heads lower, you can notice that there is a really significant level:
Because it tested the 200 MA and into the area of resistance.
And you have this false break of the highs.
The price did trigger above these highs, then collapse and reverse lower.
Then again...
Price re-tests the 200 MA, came down lower, did a pullback towards the previous swing low that could act as resistance, and then continued lower:
You can see that if you reference the 200 MA for your bias.
You can see that chances are you are, you are usually trading on the right side of the trend.
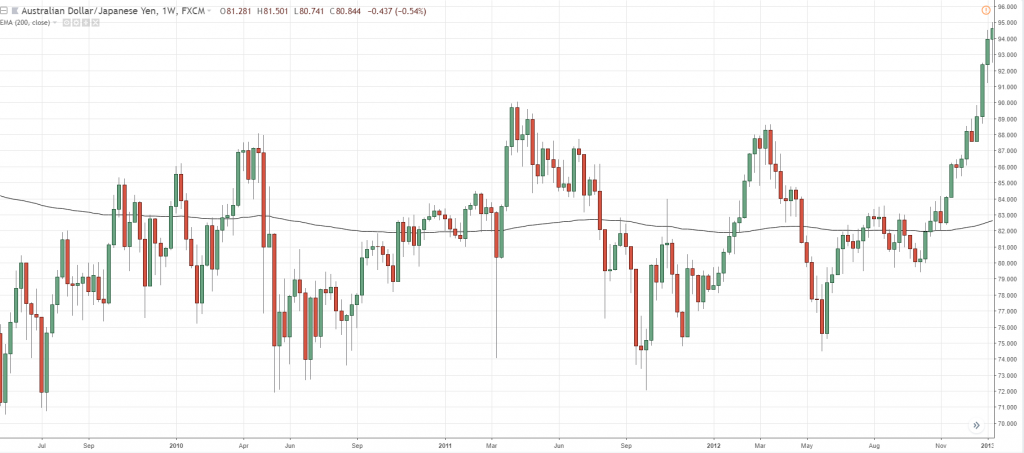
Of course, there are times where this totally breaks down.
Especially if the market goes into a long-term range.
Let's say a long-term range like this:
200 MA is pretty much in the center.
At this point in time, you might get a chop up a little bit.
But if just use a little bit of common sense and see that the market is in a long-term range, you can still adapt to it accordingly.
Anyway, this 200 MA is useful to help you identify the trend reversal and to help you trade on the right side of the trend.
Moving on, let's do a quick recap.
I like to do this to make sure the concepts and techniques go into your head…
Recap
- The first thing we spoke about the break of structure.
- I spoke about referencing it to the higher time frame structure. Where are you in the big picture. Are you coming into a long-term strong support resistance trendline, etc.?
- The third thing we spoke about is how you can use the 200 MA to identify trend reversal and to help you trade alongside the right side of the trend.

