#6: How to Avoid False Breakout
Lesson 6
So, this is a true story…
When I first got started in trading, I was new to it right?
I just learned about price action trading and I would look at a chart, a naked price chart.
And I see the market breaks out.
Strong bullish momentum.
I can imagine the candles, they're so large and I think to myself…
"Man, the breakout is real, it's time to go along, it's time to buy because I don't want to miss any more of the move, so I buy!"
And then what happens is that, shortly afterwards, the market reverses and I cut my trade and I suffered a loss.
I was stubborn!
I was an idiot!
I kept doing this a lot of times!
I lost track the number of times I did this...
Every time the market stages a strong rally, the stronger the momentum, the larger the candles, you can be sure I would buy that kind of breakout.
And I lost money consistently...
It's only after I've been in the trenches for years, I realized that "Hey, chasing this type of breakouts is a losing money proposition."
Now, the question is how do you actually avoid false breakout?
That's what today's video is all about!
Firstly…
How do you avoid false breakout?
The first thing to let you know is that there is no way you can avoid false breakouts completely.
There are certain times, a certain percentage that no matter how good the setup is…
You are still going to get caught on a false breakout, but you can minimize the chances of you getting caught in a false breakout.
The first tip that I have for you is…
Stop chasing parabolic moves
What are parabolic moves?
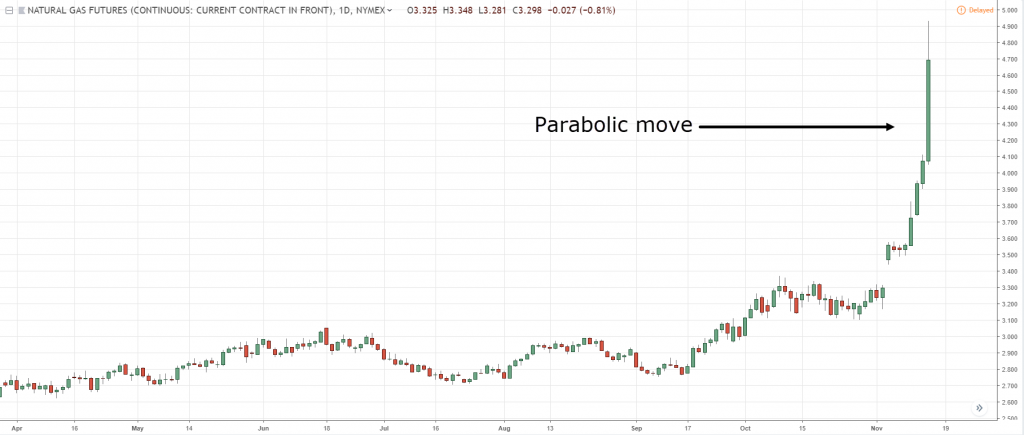
Parabolic moves, they are in essence what I've just described earlier.
The price moves up with little to no pullback and then it goes up higher:
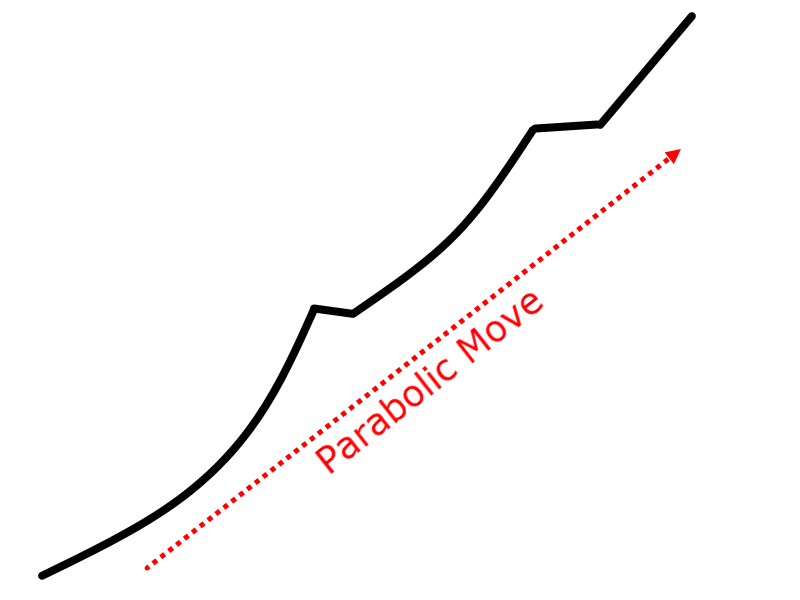
If you see a big ballistic strong momentum move like this...
Don’t chase this type of breakout, because more often than not, the market will reverse:
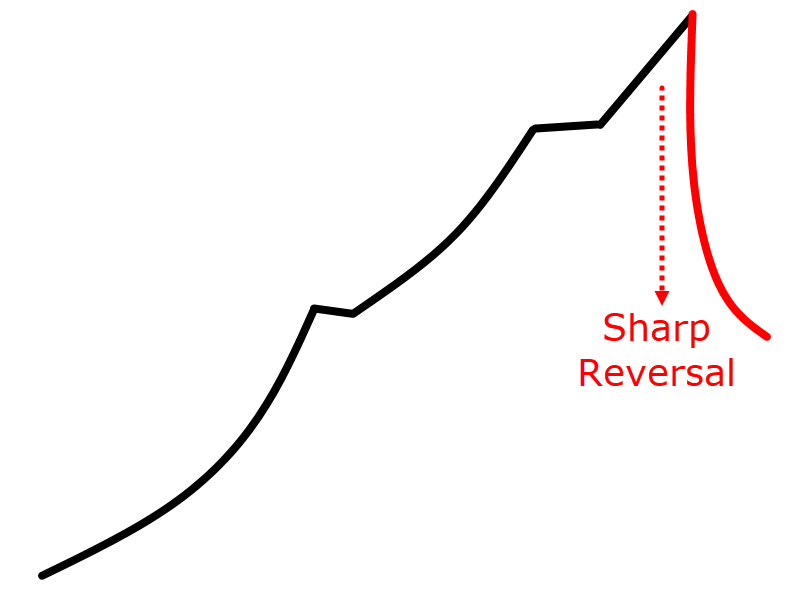
Why is that?
Let me give you a simple explanation why this usually occurs…
When you chase a market where it's making a strong move or a parabolic move, there is no floor to support these higher prices.
If you compare to markets that exhibit this type of price action that goes up and retraces…
This type of price action has levels like swing lows to support these higher prices:
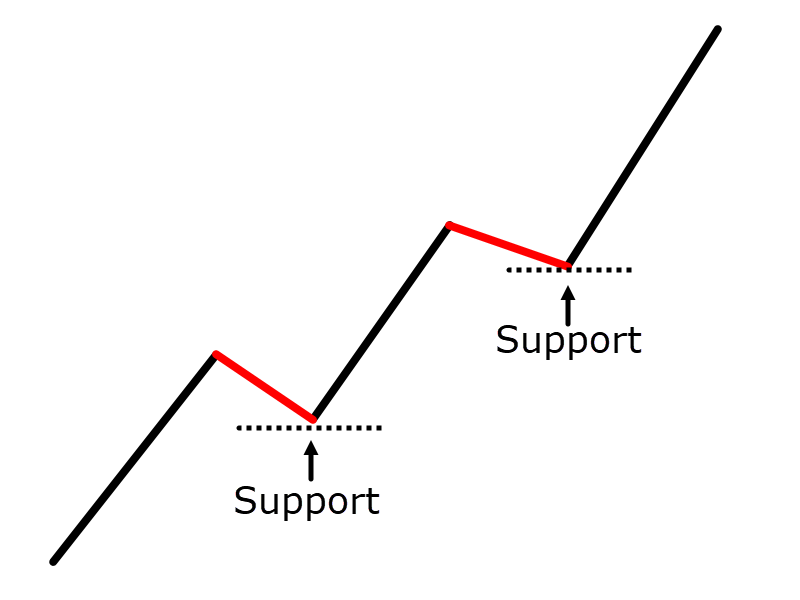
This means…
If the market were to reverse, it would find a floor or support, where potentially buying pressure could push the price higher.
These types of moves are more sustainable, because they are a series of higher floors along the way to support higher prices.
Unlike this type of strong parabolic move:
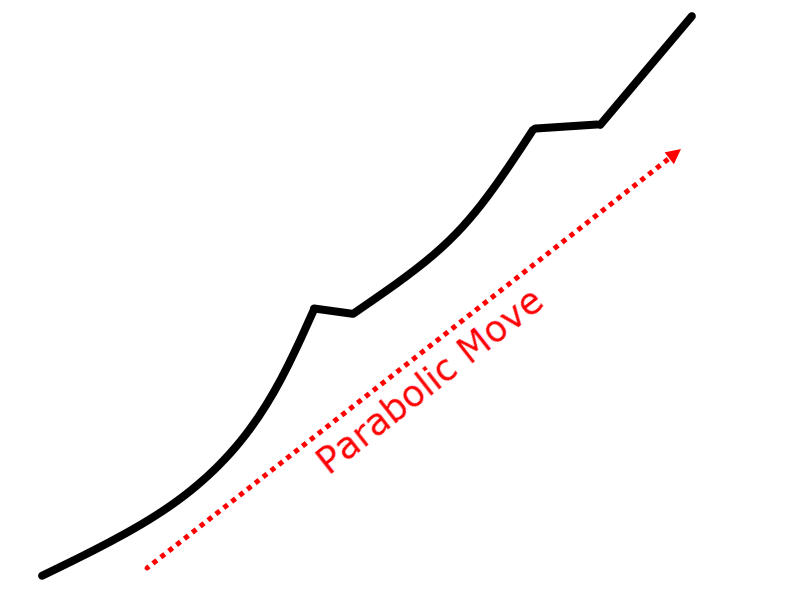
It goes straight to the moon, those are the type of breakout trades that are likely to fail.
Let me share with you a few examples...
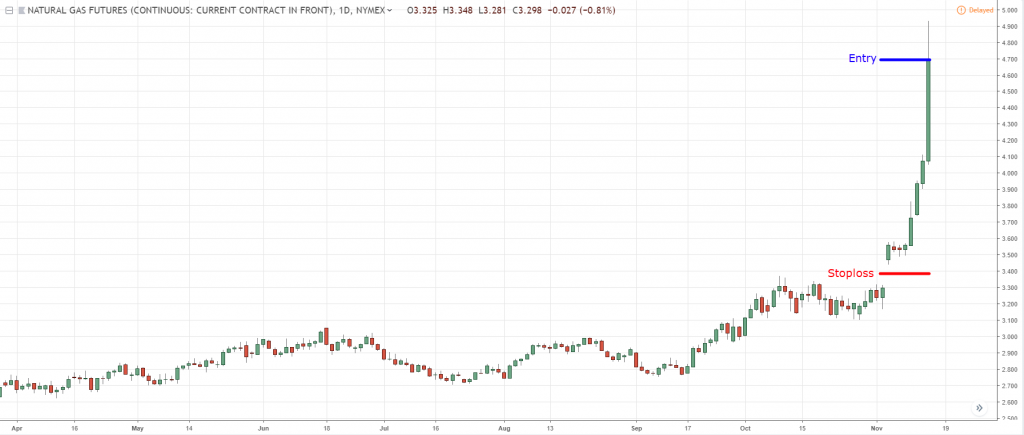
The first one that I want to share with you is a chart from NATGAS GAS FUTURES (NG1!):
If you look at this chart of natural gas…
Do you want to be buying at this point and time?
Well, you might be thinking, “Oh Rayner! right now you can be sure I would buy this market right now. After all, it's bullish! it's parabolic! look at the strength of the momentum!”
I need to slap myself and wake up because no…
I will not do it anymore…
Because in my experience based on my own trading account, I know that this in the long run, it is a losing proposition.
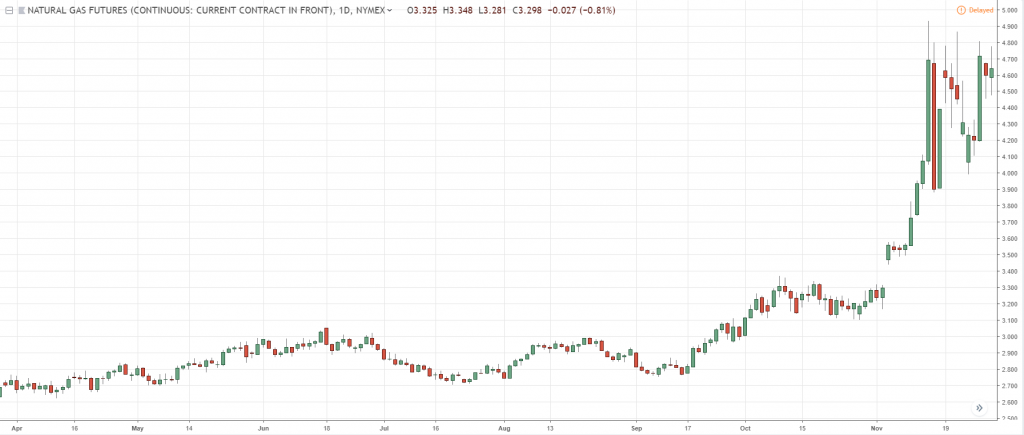
What happens is that the market has gone parabolic.
If you want to buy now, it's too late.
In fact, you want to stay away, stay on the sidelines.
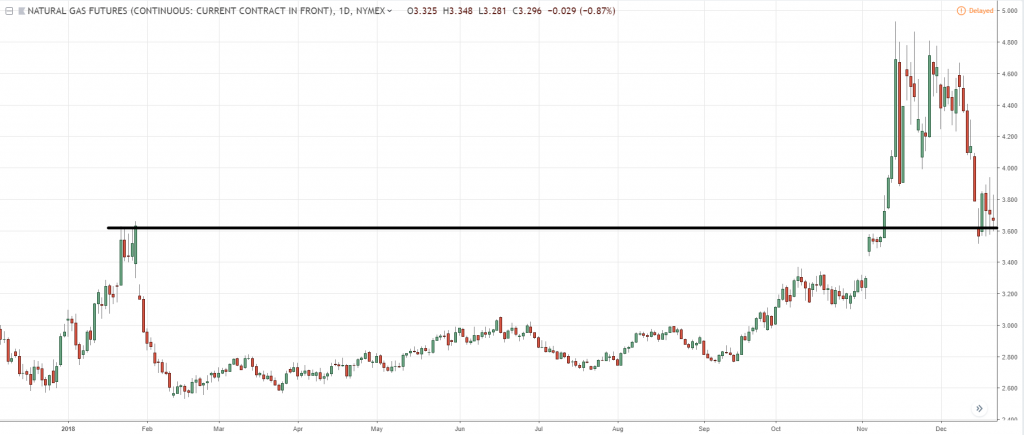
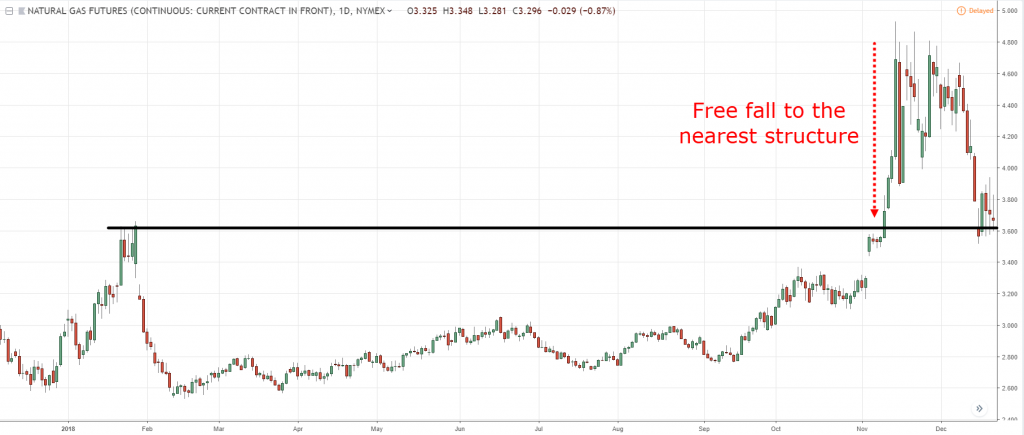
Because there's a good chance that if the reversal comes, it can be very swift towards the downside back to this nearest support or floor area where buyers could come in:
And the nearest area would possibly be somewhere here where previous resistance could act as support:
It's going to be a huge distance, where the reversal can only reverse quite a long way down:
Okay?
That's one.
Number two, if you were to buy a breakout at this point in time.
Ask yourself…
Where is a logical level to put a stop loss
If you ask me…
The nearest market structure or support is somewhere here:
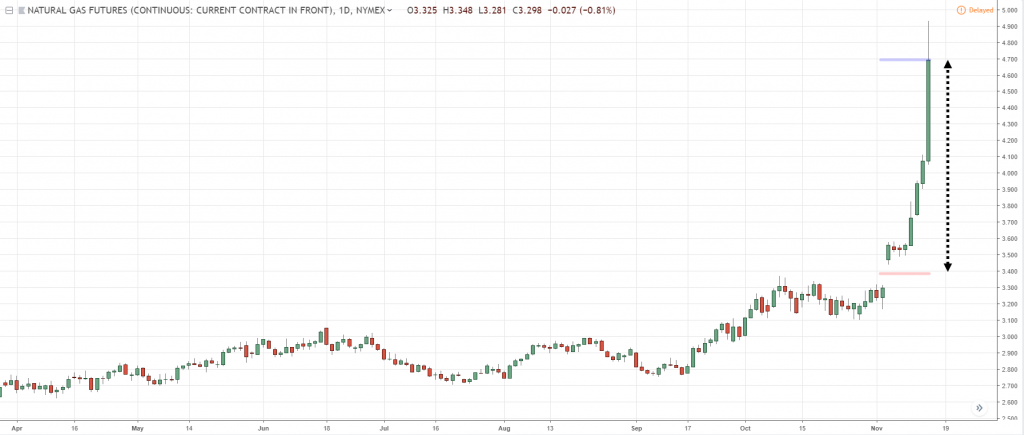
Your stop loss, in essence, would have to be this wide:
From a risk to reward perspective, it doesn't make sense.
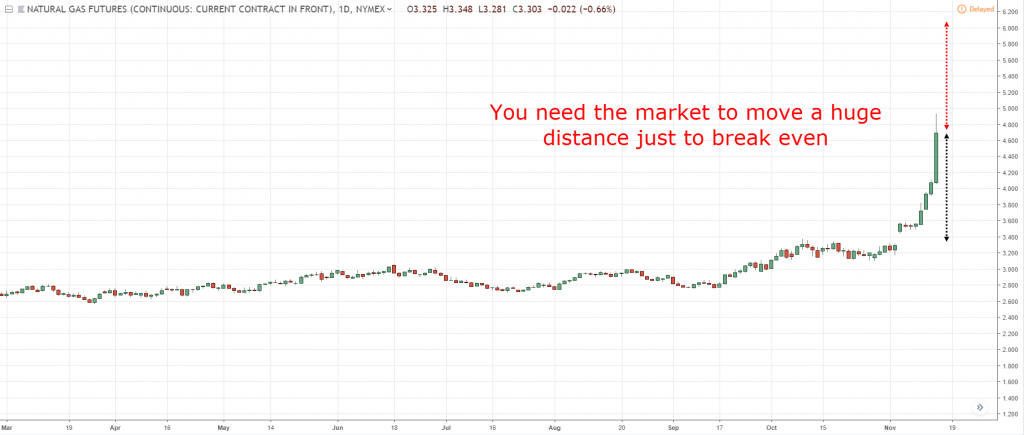
Because for you to earn your initial risk, the market has to move this much in your favor for you to earn 1R
Which is basically multiplied by one from your initial risk.
If you risk $500 on this wide distance as your stop loss, the market has to move this much just for you to make $500:
A wide stop loss, in essence, gives you a very unfavorable risk to reward.
This is one example of natural gas.
Stop chasing markets like this, because you will eventually thank yourself that you don't make these poor breakout choices in future!
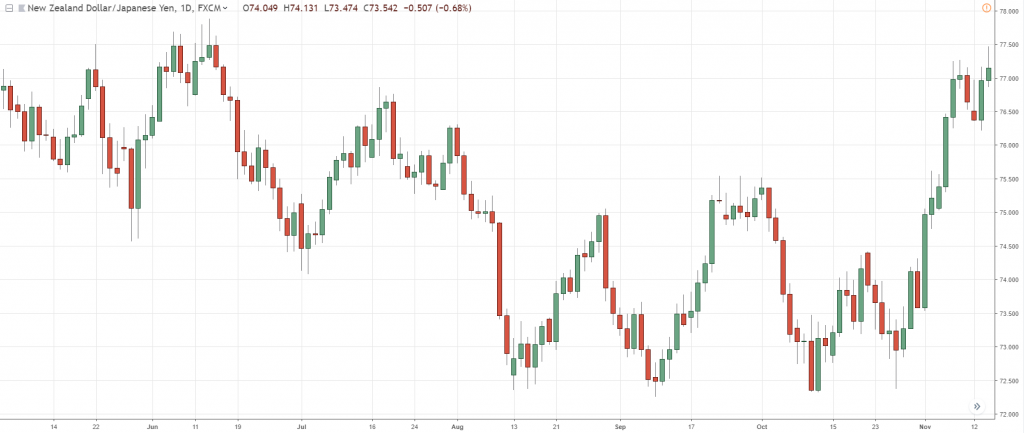
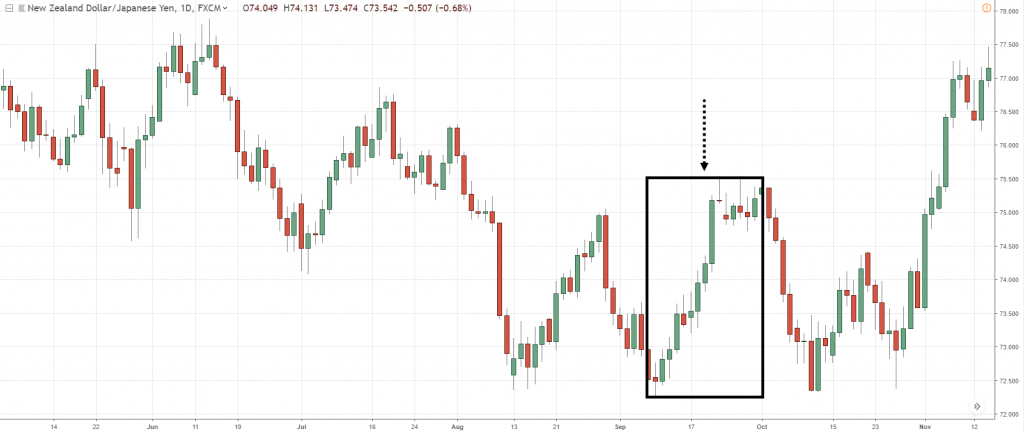
Another example that I want to share is the chart of NZD/JPY:
If you look at this, the magnitude is not as large but the concept is the same…
You don't want to be chasing breakouts after the market has made a strong momentum move.
For example, this one over here:
A strong momentum move towards the upside and breaks out.
If you see such breakouts, tell yourself, "I'm not going to chase it.”
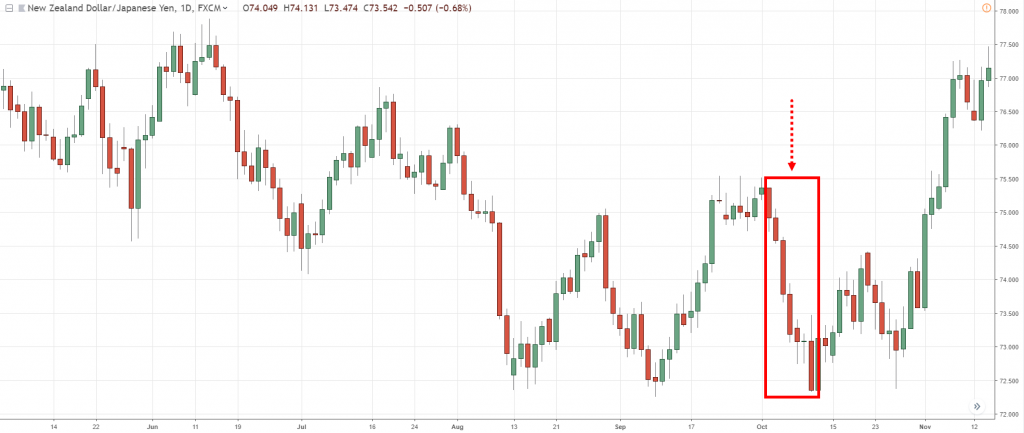
The market did eventually reversed down lower:
Again, look at the very strong momentum move towards the downside.
You don't want to be chasing these types of breakouts.
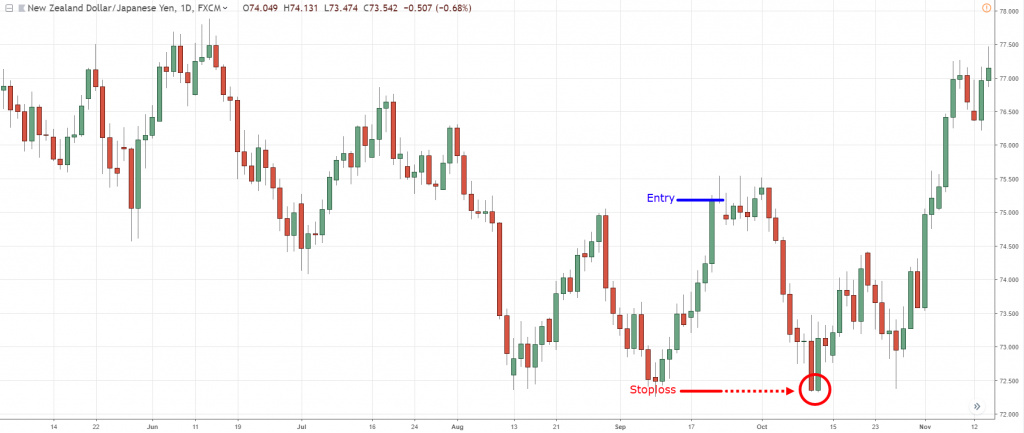
Again, as I mentioned, because if it reverses, it can reverse quickly towards the upside against your position!
And to set a stop loss on such a trade, it's going to be very wide.
Because your stop loss has to go above this market structure at this high which results in a very poor risk to reward on your trade:
If you just implement this one tip, I can assure you your breakout trades will be much more profitable going forward.
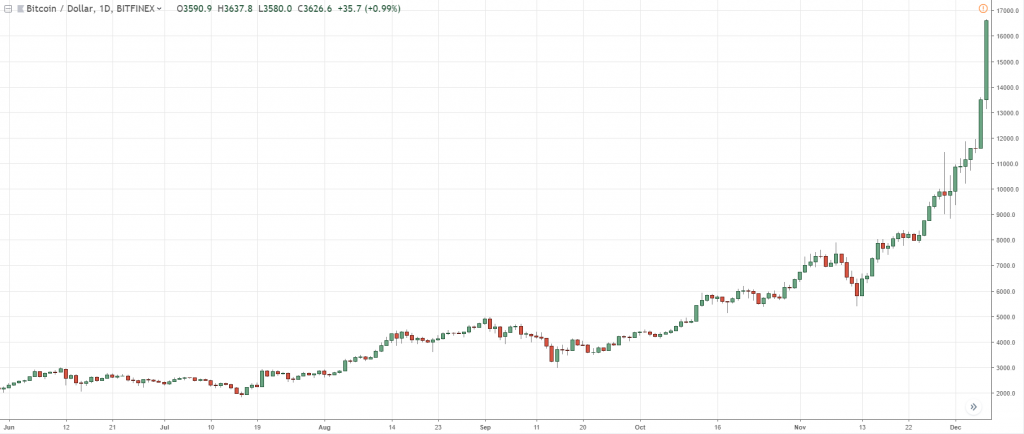
The last example that I want to share is BTC/USD:
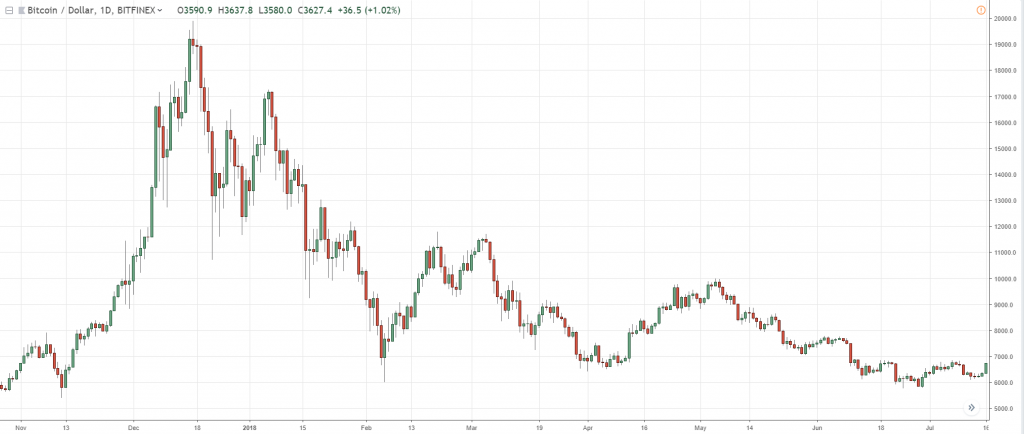
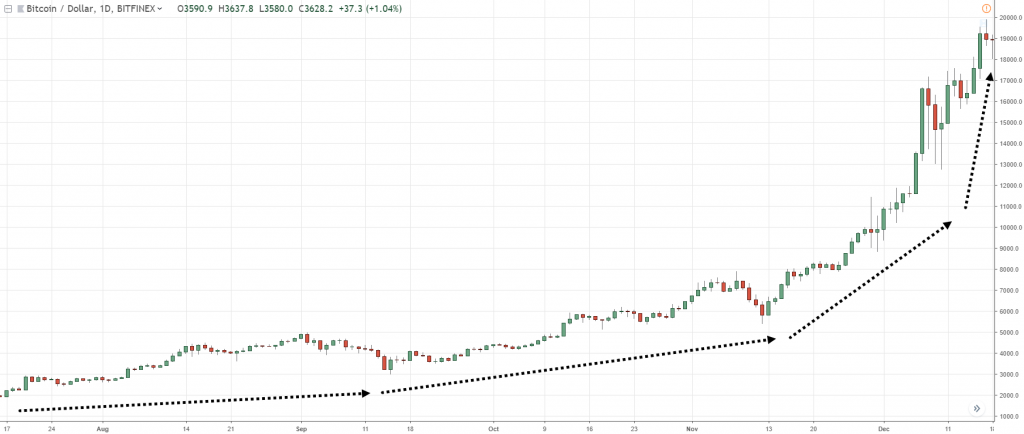
Bitcoin, if you recall the mania up to 20,000, again, if you look at the chart, it is very similar to natural gas.
If you see this type of price action with big, bullish candles…
Stop chasing the market, it's too late to enter…
And true enough, in this case, the market went up a little bit higher.
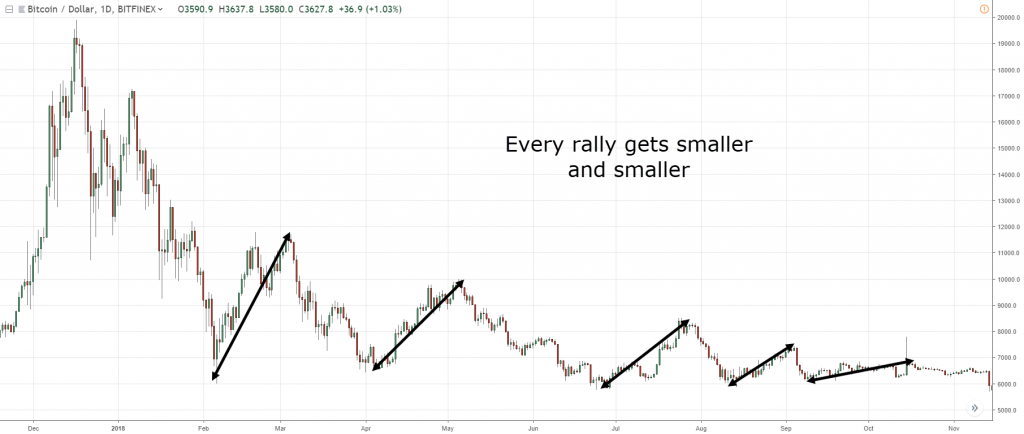
You might see a few profits on your trade before it collapses all the way down to like $6,500 at this point of doing this video:
This is the first tip that I have for you, don't chase breakouts.
Now some of you might be wondering, "Hey Rayner, okay, I won't chase breakouts. So, how do I trade breakouts?"
I got one tip for you…
Trade breakouts with a buildup
What is a build up?
A build-up means the market is in consolidation and it can be identified in three ways:
- It can be a series of higher lows into resistance, looking somewhat like ascending triangle.
- It can be a lower high coming into support, looking like a descending triangle.
- Or it can be a tight consolidation at a market structure like support and resistance.
I'm going to share with you a few examples of how you can trade breakouts with a build-up.
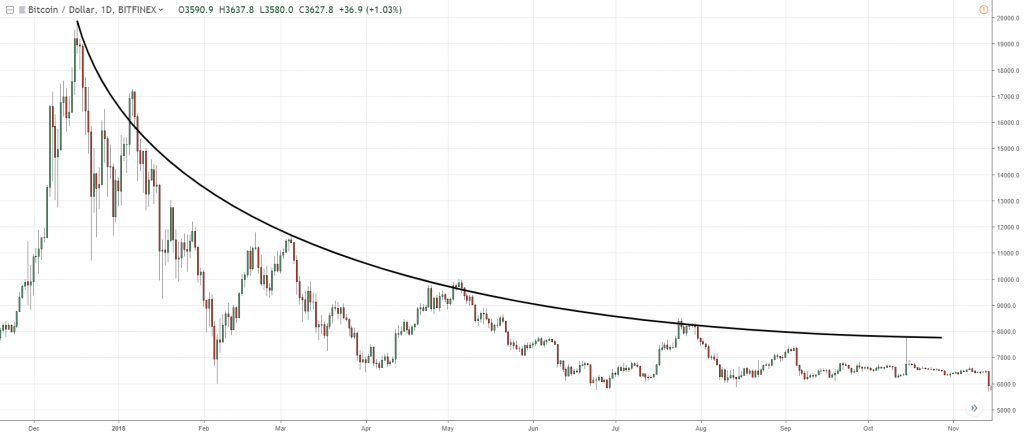
If we zoom out on BTC/USD, you can see that this market is actually forming a descending triangle, a form of a build-up:
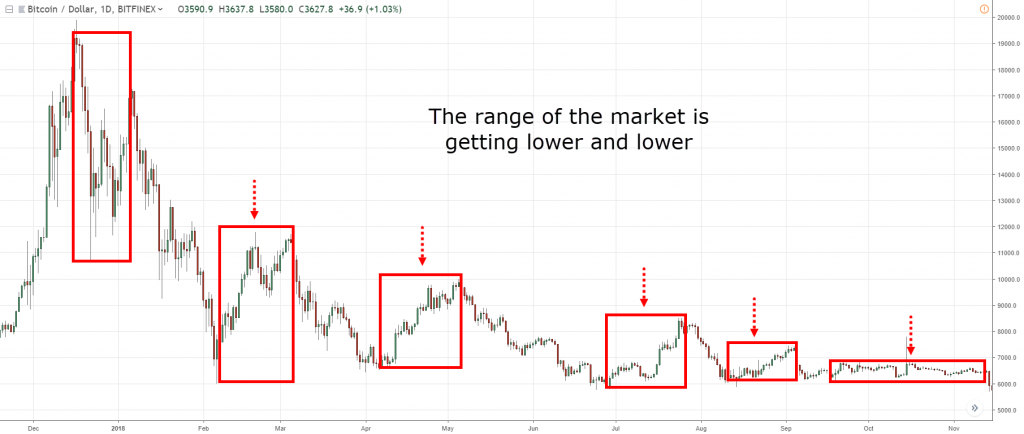
Notice the range of this market is getting tighter and tighter.
The build-up is forming!
If you look at the range of this market over here:
You'll see that the range or the size of these candles in this market are getting smaller!
Up to a point where it's not even moving any more like a dead patient.
You can see that when you trade breakouts, you want to see this phenomenon, you want to see the range of the candles getting tighter.
In fact, this is actually the opposite of what I just said earlier…
Which is to avoid trading breakouts when there's a large bullish momentum.
In fact, you want to be trading breakouts when there is a buildup, where the range of the candle is getting smaller and smaller.
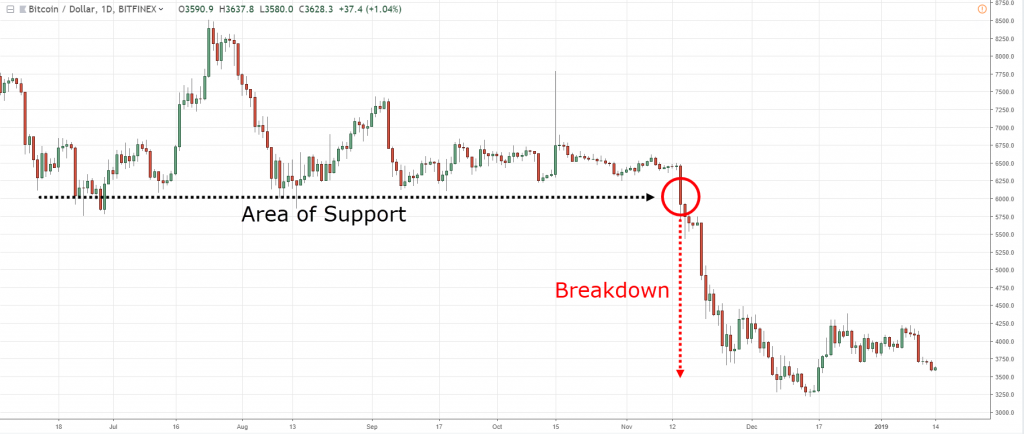
In this case, you can see on Bitcoin, we had the breakdown over here on this area of support:
This is what I call a build-up.
In this case, it's in the form of a descending triangle, lower highs coming into support.
Also, from a price action perspective, just to add on a little bit of a tip, notice the buyers are getting weak, right?
At first, the buyers are very strong, they have no problem, pushing the price from this low all the way to these highs:
Then…
Notice that each time the buyers try to push the price higher, the distance that they have moved is getting smaller and smaller:
Telling me that they are getting weak.
Whereas the sellers on the other hand…
They're able to push the price lower and lower.
And that's where you get your descending triangle.
Okay?
That's one example of a build-up.
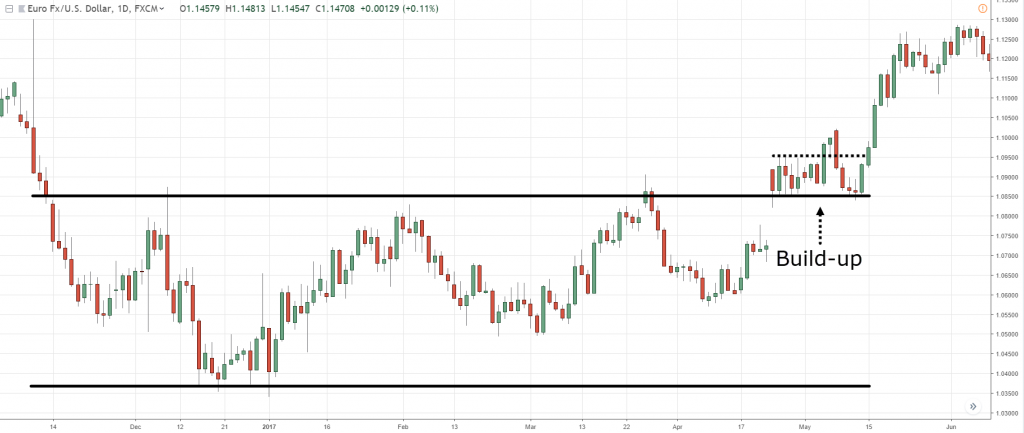
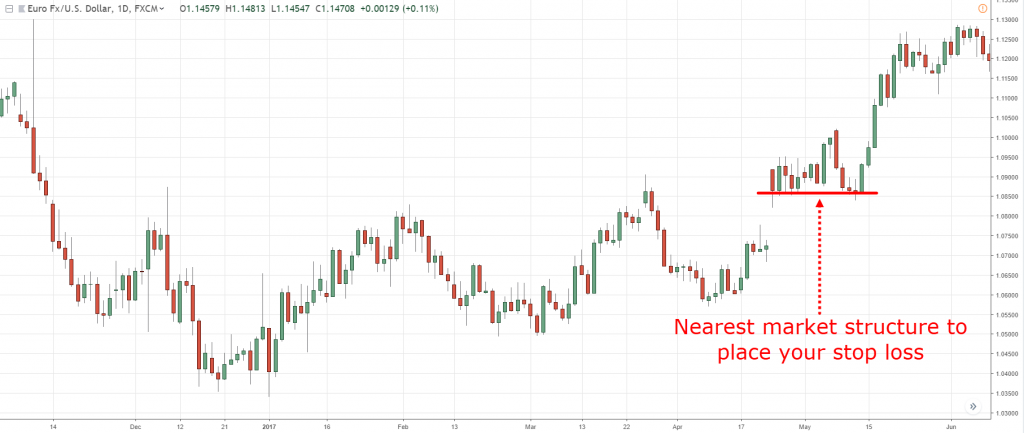
Let me share with you another example from EUR/USD where you can see that we have another build up that's formed:
Notice the consolidation is nice and tight, this is a sign of strength.
Why is that?
Because when the price is at resistance, there’s a potential selling pressure to push the price lower.
The fact that the market can hold up at resistance is telling you that:
- There is no selling pressure around .
- There are strong buyers that are willing to buy at higher prices.
Whatever the case is, this is a sign of strength!
In this case, you can see that there is a build up.
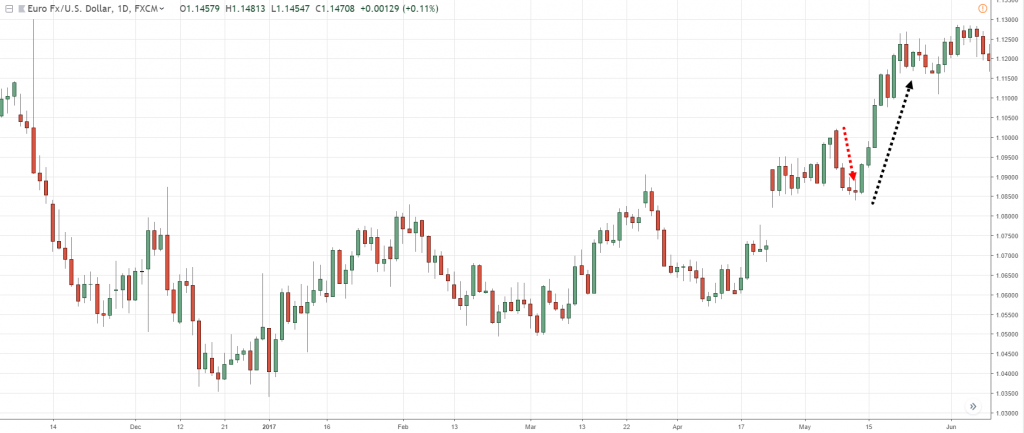
The market didn't break out, it did reverse, and finally breaks out higher again:
When you have a build-up…
You can actually reference the market structure nearby to set your stop loss, like this swing low:
You can set your stop loss one ATR below it.
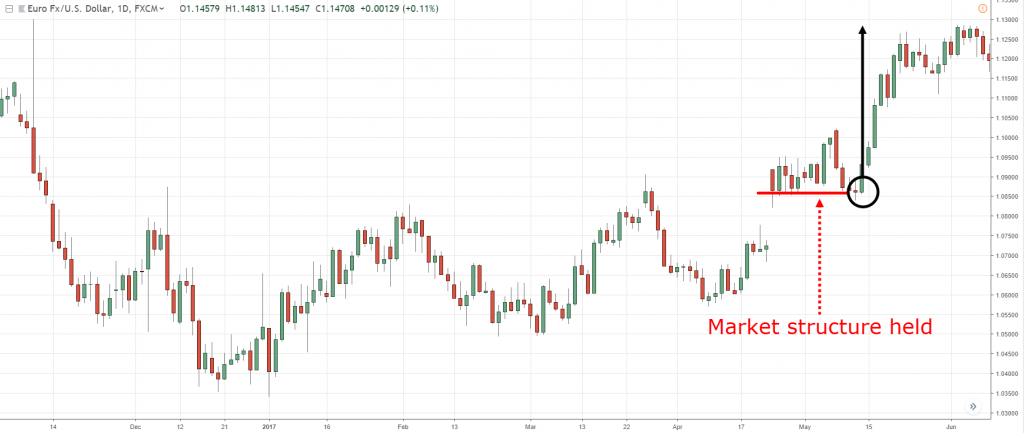
This market structure is like a barrier to prevent the reversal from having an easy passage to go through.
You can see that in this case, the market structure held up, and bias came in again to push the price higher:
This is what a build-up can do...
You have a tight stop loss and you have a nearby market structure to hold up the reversal or the pullback should it come.
Compared to trading without a buildup, when a market reverses, there is no floor, there is no level to support the higher prices.
This is why it's common to see the market reverse all the way down to the nearest market structure, which is the area of support.
Right now, I hope you can see the lesson behind it, this is powerful stuff.
Let's have a look at a few more examples.
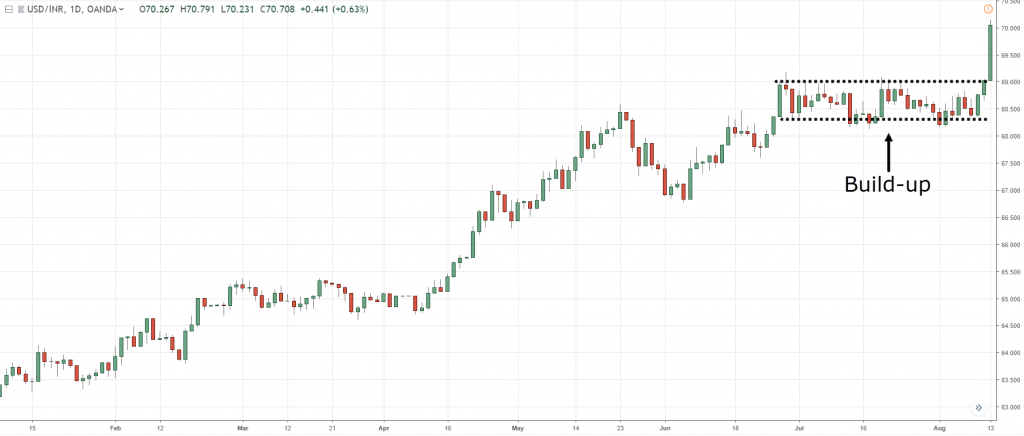
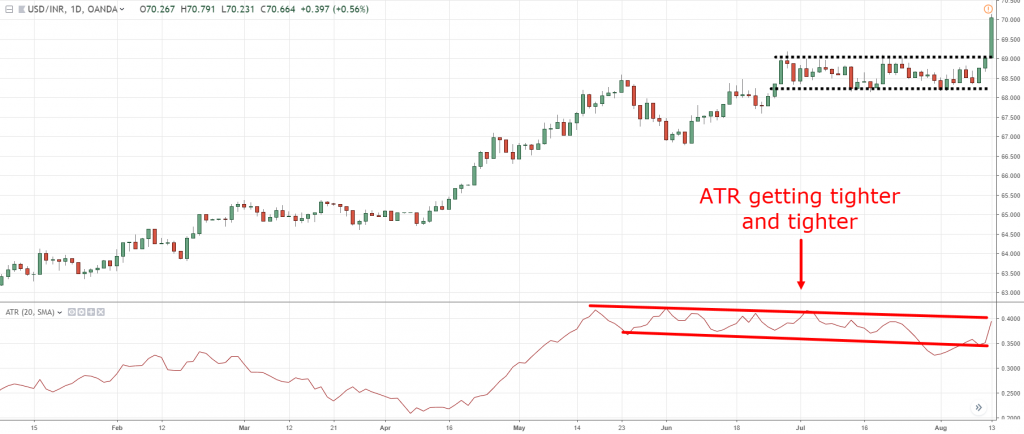
In USD/INR, the same concept, build up and then break out:
You can see over here…
This market is in an uptrend, and then it went and formed a build-up.
Some people might say this is a bull flag, but whatever the case is, the naming of the pattern isn't important.
The understanding of the price action is what matters.
Notice the range of the candles are getting tighter and tighter on the build-up like they're running out of space to breathe.
Usually, when that happens, it's a sign that the market is about to break out.
I understand that some of you who are new to trading…
You might have difficulty trying to spot these tight consolidations.
Moving on…
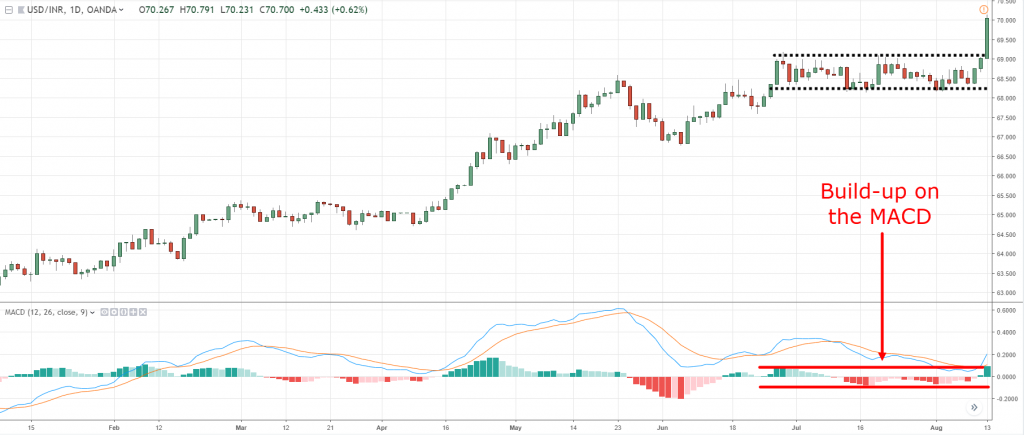
How to easily detect build-ups using the MACD Indicator
One tip that I can share with you is that you can use an indicator like the MACD.
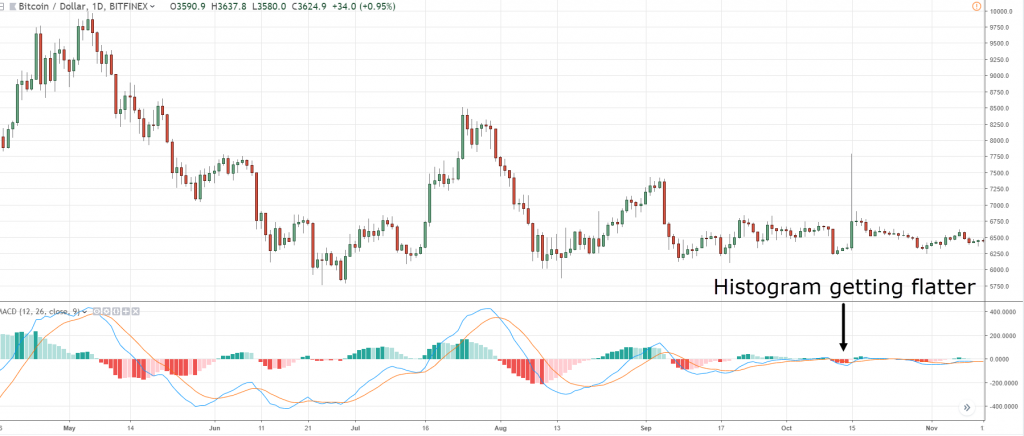
You want to see the histogram getting flatter and flatter.
This is a sign that the volatility of the market is shrinking:
If you don't want to use the MACD, you can also use the Average True Range indicator.
The concept is the same.
What you're looking for at this point, is for the ATR values to be declining, telling you that the range of the market is getting tighter and tighter:
Whichever you use is truly up to you.
But I think that visually, the MACD indicator makes build-ups easier to spot.
Of course, there are other indicators to help you identify the reduction in the volatility of the market.
So, go with whichever that you prefer.
If you are a price action trader, you can actually see these through your naked eye.
If you look at Bitcoin with the MACD, it’s even more obvious:
You can see that prior to the breakdown, the range of this histogram is getting flatter.
When there's volatility, the histogram has peaks and troughs.
But when volatility has shrunk, notice that it becomes like a dead ER patient.
And that's where you want to be trading the breakout, not trading a breakout when volatility is high, not when momentum is strong.
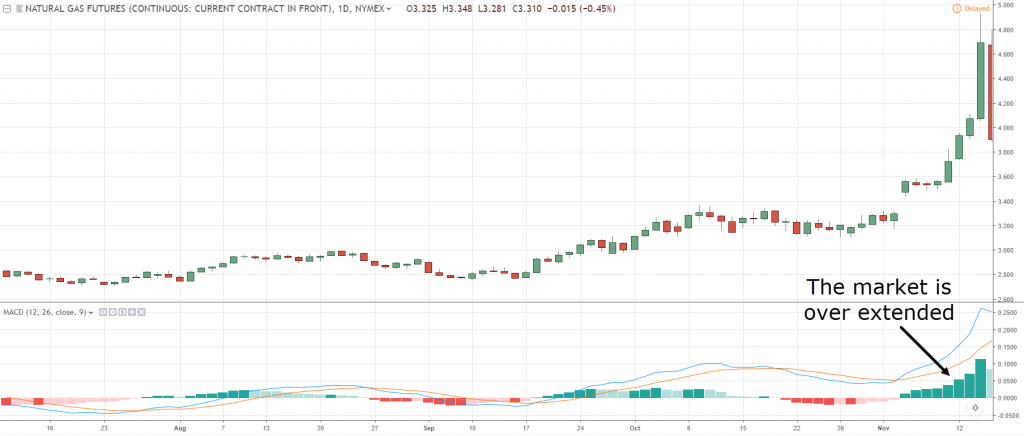
Another tip to share with you is that whenever the market breaks out and you see such strong momentum where the histogram is at its peak...
It's a sign to you that you want to stay away from the market.
If you look at the MACD in Natural Gas, you can see that there is a strong momentum over here:
Your MACD histogram is at its peak.
This is a sign that you don't want to be chasing the breakout.
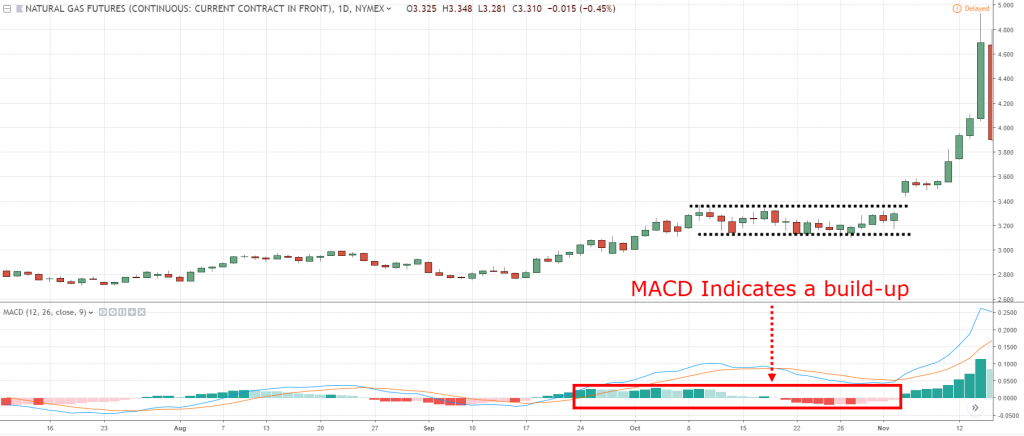
In fact, if you just go back a little bit in time…
You can notice the MACD is getting flat before it finally breaks out:
You can use the MACD to help you identify build ups and identify momentum so you can enter high probability breakout trades.
Let’s just have a look at one more example before we conclude this video.
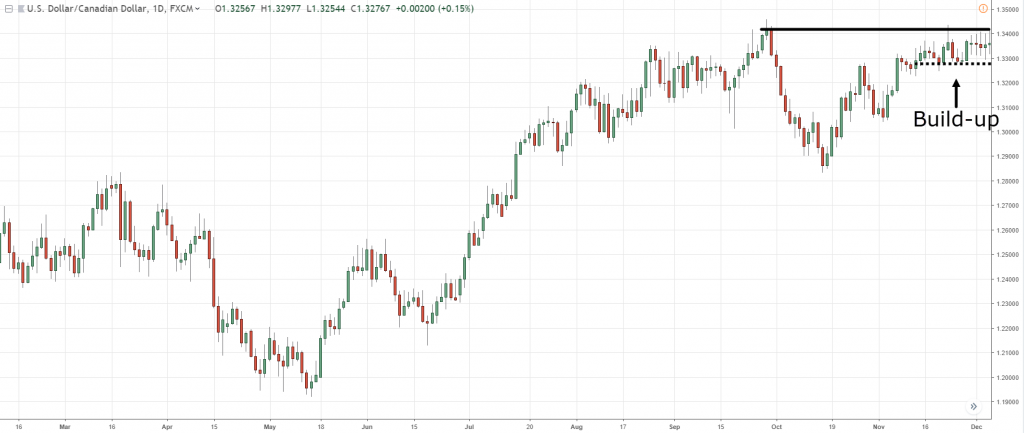
One last example is the USD/CAD, another example of a buildup at the area of resistance:
This is a sign of strength, telling you that buyers are willing to buy at these higher prices.
Notice the range of the candles getting smaller and smaller.
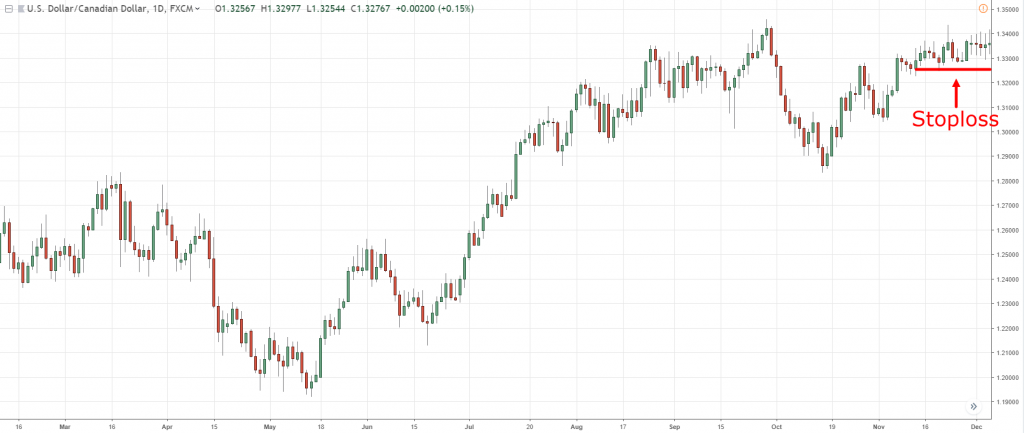
Then, you want to set your stop loss at a nearby market structure to lean against, which is this swing low over here:
The market did break out in this case and it happened to be a winning trade.
Of course, it's a winning trade because I cherry-picked a few of these charts to illustrate my point!
Okay?
So, let's do a quick recap, on what we've learned today…
Recap
- Stop chasing parabolic moves. If you see strong bullish momentum and you see the candles are getting larger, don't chase the parabolic move
- You want to trade and breakouts with a build-up
This is how you would want to trade breakouts.
And I promise you, if you follow these two tips that I have just shared with you, you'll find that your breakout trading will improve dramatically.

