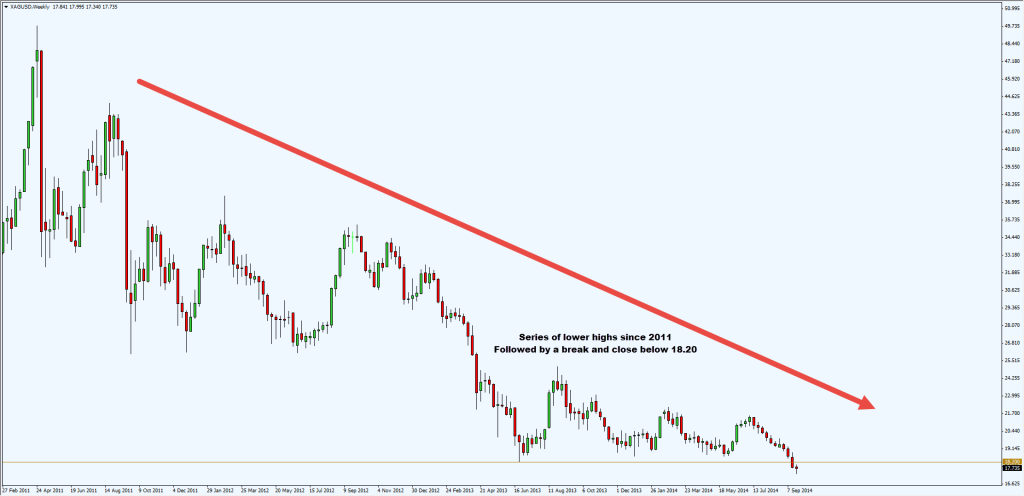
Weekly Silver Trading Chart:
No surprise that Silver finally broke to the downside. Why?
On the Weekly Chart, we see prices making lower highs since 2011.
And each subsequent rally from 18.20 was getting weaker. Finally, on the 4th attempt price manage to break and close below 18.20
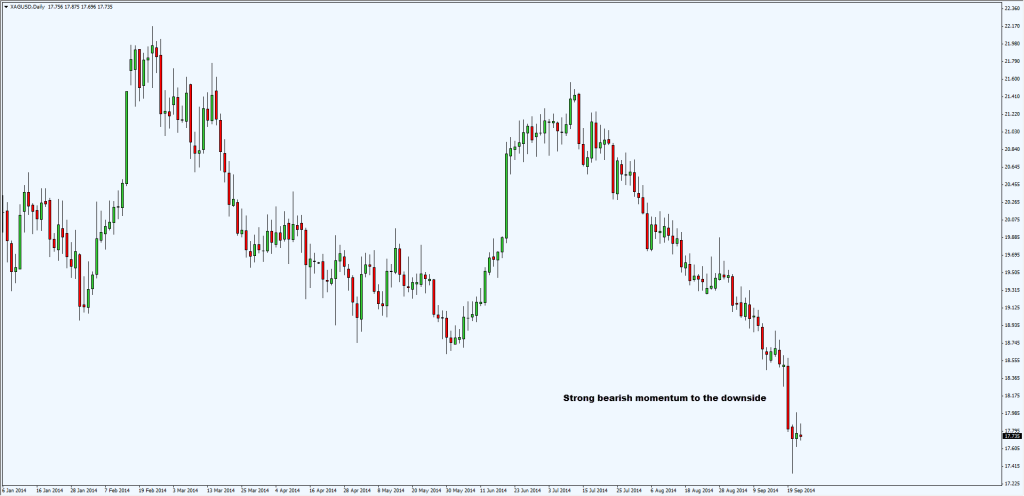
The Daily Trading Chart:
On the daily chart, we see strong momentum to the downside. No reason to be looking for longs at all.
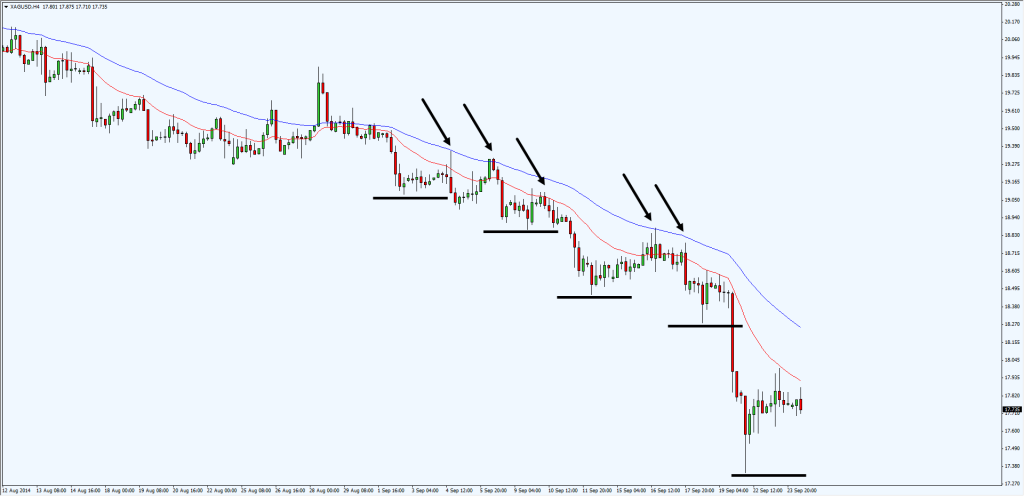
The 4 hours Trading Chart:
On 4 hours chart, we can look to sell should the price retrace to the EMAs or trade a breakout to the downside.
Manage your risk and trade safe!


