In the previous post, you’ve learned what is price action trading and how it can transform your trading results.
If you’ve missed it, go read here: The Power of Price Action Trading Nobody Tells You
Moving on:
You’ll discover some of the biggest myths surrounding price action trading that actually hurts your trading.
So don’t fall for it…
Myth #1: Price action is trading Support and Resistance
Well, yes and no.
I’ll explain…
For example:
If the market is in a range or a weak trend, then yes, you can trade Support and Resistance (as the price would re-test these areas).
But:
If the market is in a strong trend or parabolic move, the price is unlikely to re-test Support and Resistance (as there are little-to-no pullbacks).
So, if you only know Support and Resistance, then you’ll miss plenty of trading opportunities when market conditions change.
But the good news is…
As a price action trader, you don’t just trade Support and Resistance.
Instead, you adapt to the market conditions and apply the appropriate trading strategy to trade it.
This means you can profit even in “fast-moving” markets while amateur traders are waiting for the price to re-test Support and Resistance.
Heck yeah!
Myth #2: All markets behave in the same manner
Now you might think…
“Markets can only trend or range, thus all markets behave in a similar manner.”
Well, that’s how I thought too, and I got proven wrong.
Here’s why…
Recently, I studied the work by Andrea Unger (a world-cup trading champion) and he mentioned not all markets behave in the same manner.
Here’s a simple back test to prove it:
- Buy the breakout of previous day high
- Hold the long position till the price hits the previous day low, and go short
- Hold the short position till the price breaks above the previous day high, and go long
- Rinse repeat over again
Now, I’ve applied this strategy to a portfolio of markets.
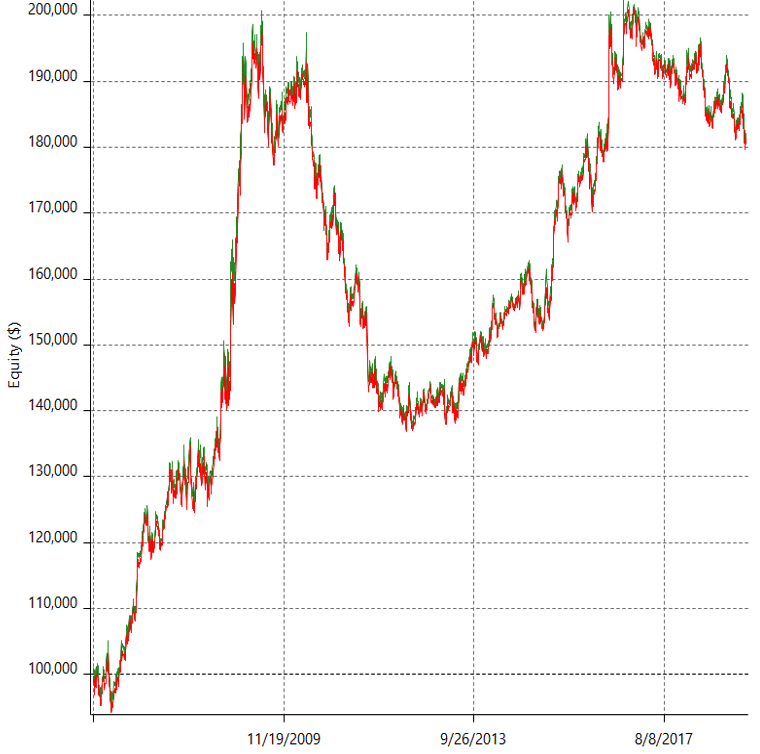
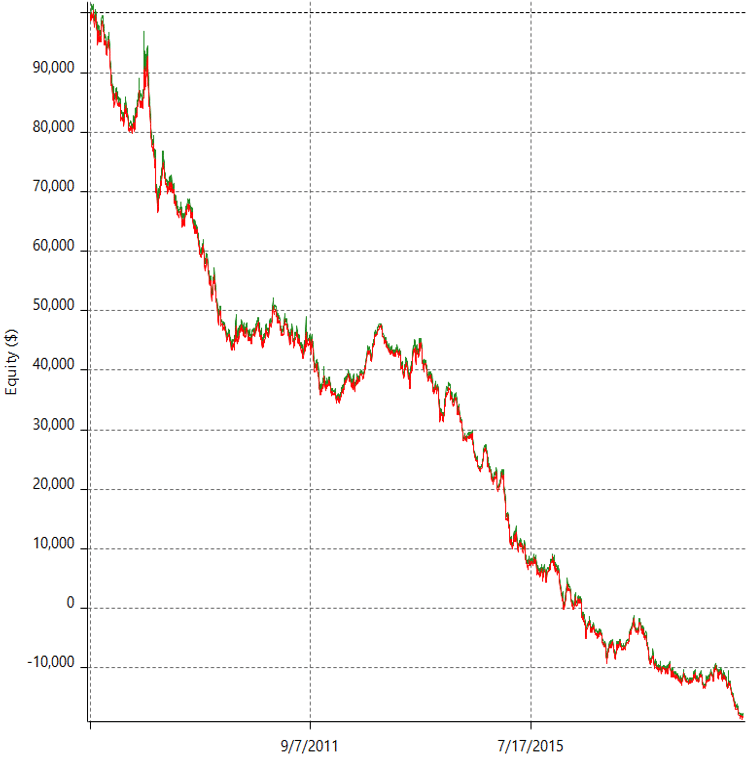
And here are the results of two markets that proves my point…
GBP/USD: Equity curve in an uptrend when a Trend Following approach is traded on it.
You see an equity curve that’s moving higher.
This tells you GBP/USD is a trending market as it makes money when a Trend Following approach is traded on it.
AUD/CAD: Equity curve making new lows when a Trend Following approach is traded on it.
Now, you see an equity curve that’s heading lower.
Clearly, AUD/CAD is a mean reverting market as it loses money when a Trend Following approach is traded on it.
So, what’s the lesson?
Not all markets are created equal.
Some markets are suited to trade with the trend, and some to adopt a counter-trend approach.
And in The Ultimate Price Action Trader, I’ll discuss which are the best trending and mean reverting markets (so you know which trading strategy to use for different markets).
Myth #3: Price action trading requires you to draw many levels on your charts
Now…
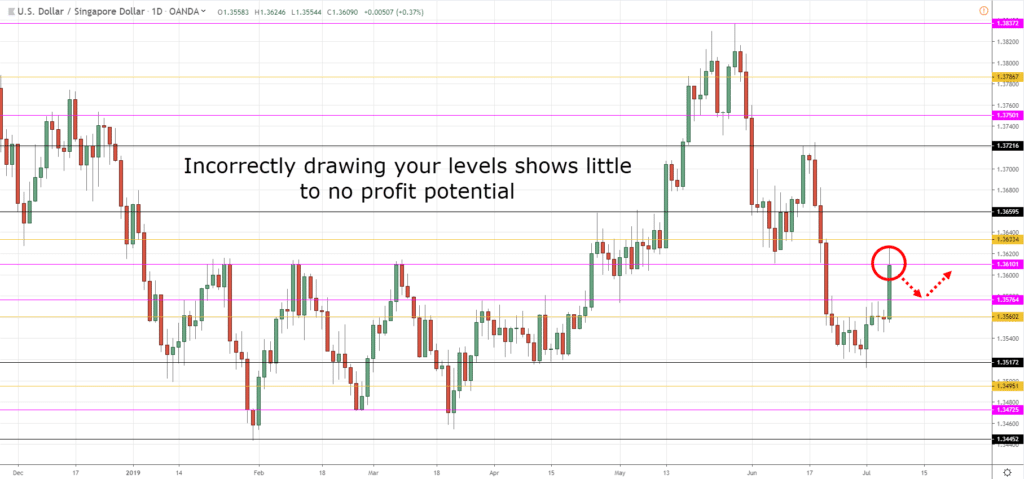
The problem with drawing too many levels on your charts is you’ll get analysis paralysis — how do you know when to buy or sell?
And even if the price comes to your level, it’s only a small move before the price face an “obstacle” (that you’ve drawn).
Thus, it’s hard to pull the trigger when you see such “limited” profit potential in front of you.
An example:
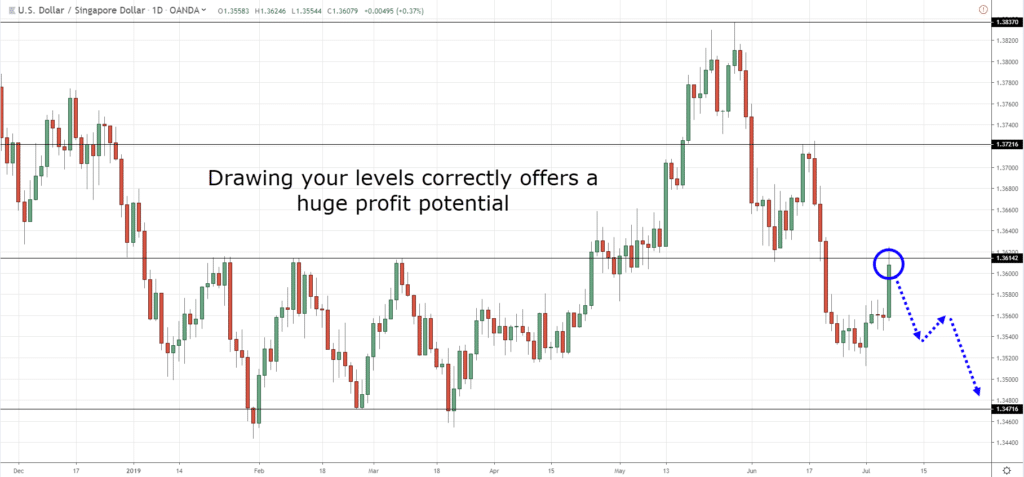
The solution?
Trade the levels that matter the most and ignore everything else.
Because once you’ve nailed down the most important levels on your charts, everything becomes clearer and your profit potential is now increased.
Here’s what I mean…
Myth #4: Price action trading only works on the higher timeframe
Is this true?
Let’s put it to the test.
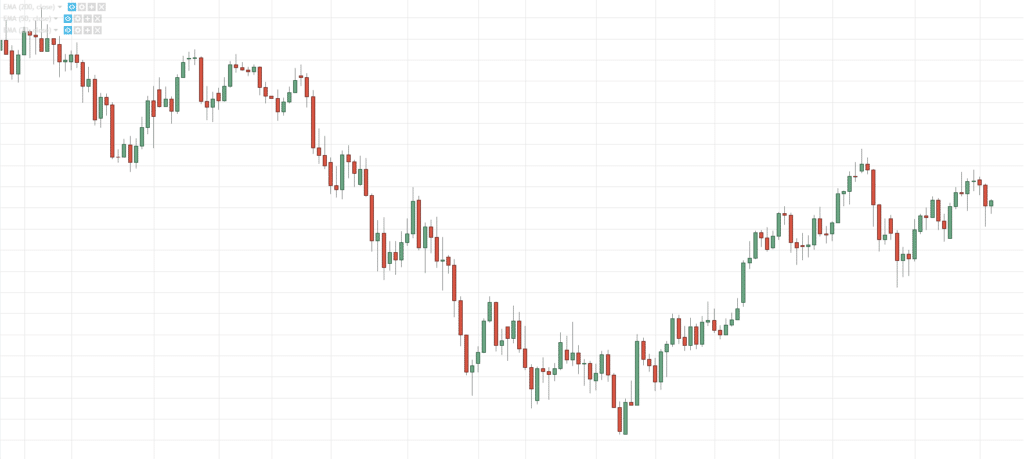
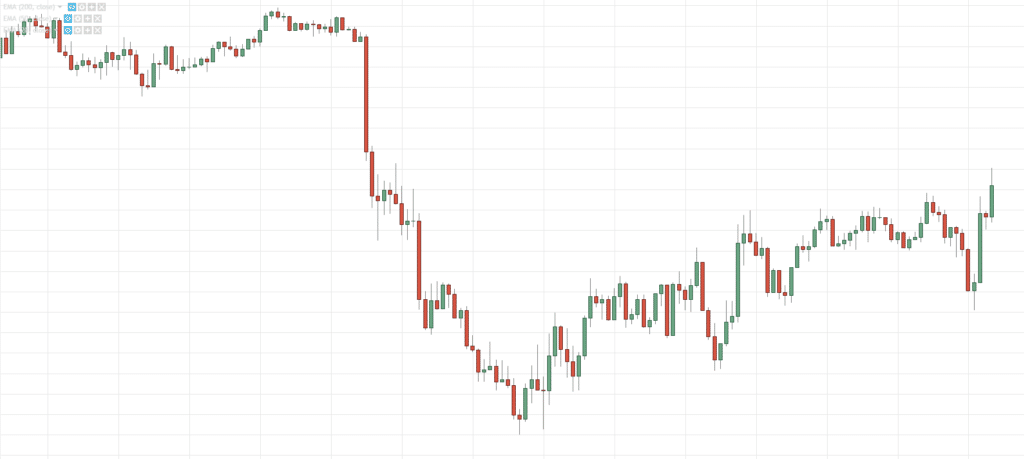
Look at the charts below: (One is a 15 minutes timeframe and the other the Daily timeframe)
#1:
#2:
Now let me ask you…
Which chart is the Daily timeframe?
You’re not sure, right?
That’s because the price action you see on the higher timeframe is similar to what you see on the lower timeframe.
Why?
Because the market moves due to an imbalance of buying and selling pressure.
And this imbalance can be seen across the different timeframes, whether you’re trading the 15 minutes, Daily timeframe, Weekly timeframe, etc.
So the lesson is this…
Price action works on both the higher and lower timeframes.
This means you can use it to improve your trading results whether you’re a day trader, swing trader, or position trader.
Myth #5: Price action Trading only works in the Forex market
I’ll be honest.
The price action on the Forex markets is different compared to the Stock markets.
For example:
In Stock markets, you’ll frequently see gaps on a day to day basis but, not in the Forex markets.
However:
It doesn’t change the game.
Because if you break it down to layman terms, markets are driven primarily by fear, greed, and indecision.
That’s why you’ve got market structure like downtrend, uptrend, and range — right?
And recall:
Price action Trading is about reading market structure and then selecting the appropriate trading strategy for it.
This means if the Stock markets can go up, down, and range, then price action trading can be applied the same.
(But if a Stock is illiquid, then price action analysis is not suited for it.)
Myth #6: You should focus only on A+ trading setups
This is one of the worst advice I see “gurus” preaching all the time…
“You should focus only on A+ setups.”
Now…
To a new trader, this might make sense.
After all, trading is about patience and you must wait for the best trading setups, right?
Wrong!
If you follow this blindly, it actually WRECKS your trading results.
I’ll explain…
Let’s assume:
- You have a $10,000 account and you risk 1% on each trade
- You have an A+ trading setup that wins 70% and an average of 1 to 3 risk reward ratio
- The setup occurs 10 times a year
The end result?
You make a profit of $1800.
Now…
What if there’s another trading strategy that isn’t as good as the A+ one, but the trading setup occurs more often.
Would it be better?
Let’s assume:
- You have a $10,000 account and you risk 1% on each trade
- You have a B trading setup that wins 50% and an average of 1 to 2 risk reward ratio
- The setup occurs 100 times a year
The end result?
You make a profit of $5000.
This is $3200 more than you’re A+ trading setup.
Clearly…
The A+ trading setup makes less money than an average one.
Now you might be wondering:
“Why is that?”
Because it has a lesser trading frequency.
So, here’s the lesson:
An average trading setup with more trading opportunities will beat an A+ trading setup that has little trading opportunities.
So, stop focusing only on A+ trading setups.
If you want to be a more profitable trader, learn new trading setups (including those that aren’t as “profitable”).
Myth #7: Price action trading is trading Candlestick Patterns
Here’s the deal:
Price action trading is more than just trading candlestick patterns.
This means if you spot a bullish Hammer, it doesn’t mean you go long immediately.
Why?
Because you must take into context of the markets (more details in my next post).
For example:
If you noticed the market has been in a downtrend over the last 18 months.
And the next day, you get a Bullish Hammer.
Do you go long?
I hope not.
Here’s why…
Imagine:
There’s a train moving at 200 km/h.
At the same time, there’s a car moving at 70 km/h in the opposite direction.
Who do you think will crash?
The car, of course!
Because there’s not enough “energy” behind it to reverse the direction of the oncoming train.
And it’s the same for trading.
A single candlestick pattern doesn’t have the “energy” to reverse the entire trend.
If you attempt to do it, you’ll crash.
So, never trade candlestick patterns in isolation — and price action trading is more than just candlestick patterns.
So…
You’ve learned some of the biggest myths surrounding price action trading and broke through some of your own limiting beliefs.
In my next post, you’ll discover some of the biggest mistakes traders make with price action trading — and a simple “formula” to identify high probability price action trading setups.
For now, here’s what I’d like to know…
What are some of the trading myths you’ve come across?
Leave a comment below and share your thoughts with me.

Thanks for the insight, Rayner
You’re welcome, Toni.
Thank you sir I have got a lot from this,and all you ideas which I have came across
Awesome to hear that!
..excellent article. Thanks for all your efforts you put into these articles!!
You’re welcome, Gavin!
Great insight, well done Rayner
Thank you, Emmanuel.
thank you Rayner ,this is wonderful for us as a new traders
Glad to help out!
price action is the holy grail for successful trading
Wow Very insightful nice job
Cheers
Thanks
Wonderful article, thank you so much Rey…
My pleasure, Folki!
Hi Rayner, thank you for sharing the myths of price action strategy. Great stuff. Do you predominant trade using Price action strategy?
It’s one of the trading methods I adopt.
I’m also a systems trader. cheers
Tq Rayner, I’ve learned a lot since I lost 300 dollars plus. I wish, I should learn as many techniques b4 I jump in this world. Anyway, slowly your advice make me become better a bit now and trade with more confident. Even though still not great yet, but I can see at least what I should do. My trading plan should be variety in future.
very good description! Thanks Bro !
Great work
Thank you for sharing such a great tips and strategies
Kind regards
Robert
You’re welcome, Robert!
“what are some of the trading myths you’ve come across?”
“Please comment.”
Good people we cant even grasp the gist of a simple comment assignment …..???
Pro trading wouldn’t have been any less simpler.., doubtlessly
you should only trade daily timeframe and above
Hi Rayner. I have been following you for a while and your advice is super I have applied most of your trading advices on my forex trading strategies and am successful thus far. But now my question, would you advice price action trading on commodities (Brent and Crude) or do you have a different trading strategy for them and if so please share with us.
Regards
Pls put me through on how to do swing trading. The best timeframe for it.
Thank you for your generous information, both for fee and for free offerings
You’re welcome, Fred!
Thank you Rayner, your article is very useful.
Glad to hear that!
Thanks Ryan for giving much needed insight on PA.
HI man with the trendeline strategy do you you ignore news events?
thank you Rayner
Beautiful . Thanks
realpy good for a starter like me, tx bro
Thank’s for your guidance Rayner
You are brilliant, you bring a lovely and simple understanding of forex trading. keep up the sterling work.
THANKS A LOT FOR RIGHT DIRECTION. YOU ARE REAL SPIDER MAN IN STOCK MARKETS
…”Because there’s not enough “energy” behind it to reverse the direction…”
Oh i love this statement coz it is realistically true..
Thanks for the great teacing, may GGod bless you.
Thanks for the great teaching, God bless you sir.
This is a great one coach
Thank you it is good lesson
Sir,,,,you should make a app on price action trading…
Thanks for dotting.the dragon’s eye, Rayner.
Thanks Rayner
Thanks Rayner for your commitment to always give your best to help traders improve trading results. Big ups
Hi Abomugisha,
You are welcome…
i was belief that candlestick pattern enough for trading
Thank you Rayner , I love how you simplify trading, I have problem how to trade sharply trending market
You’re most welcome, Subaih!
Here is a link on How to ride massive trends in the market:
https://www.tradingwithrayner.com/how-to-ride-massive-trends-in-the-market/
Hope that helps!
Enter aTrading by looking only support and resistance
Thank you for sharing!
Thank you
You’re welcome!