This training is part 3 of 3.
If you missed the earlier ones, you can check them out here…
1: The 4 Biggest Reasons Why Most Traders Fail And How You Can Avoid It
2: Price Action Trading Myths: Did You Fall For Any Of It?
Now, let’s move on…
Today, you’ll discover a simple but effective trading strategy which allows you to profit in bull and bear markets—without relying on indicators, news, or opinions.
Cool?
Then let me introduce you to you… The MAEE Formula.
You’re wondering:
“What does it mean?”
Well, it stands for…
- Market structure
- Area of value
- Entry trigger
- Exits
Let me explain…
#1: Market structure
Market structure helps you identify the current market condition so you know whether to be a buyer, seller, or to stay out of the markets.
It can be broken down into 3 categories:
- Uptrend
- Downtrend
- Range
Uptrend
A market is said to be in an uptrend when the price shows a series of higher highs and higher lows.
Here’s what I mean…
S&P 500 Daily Timeframe:
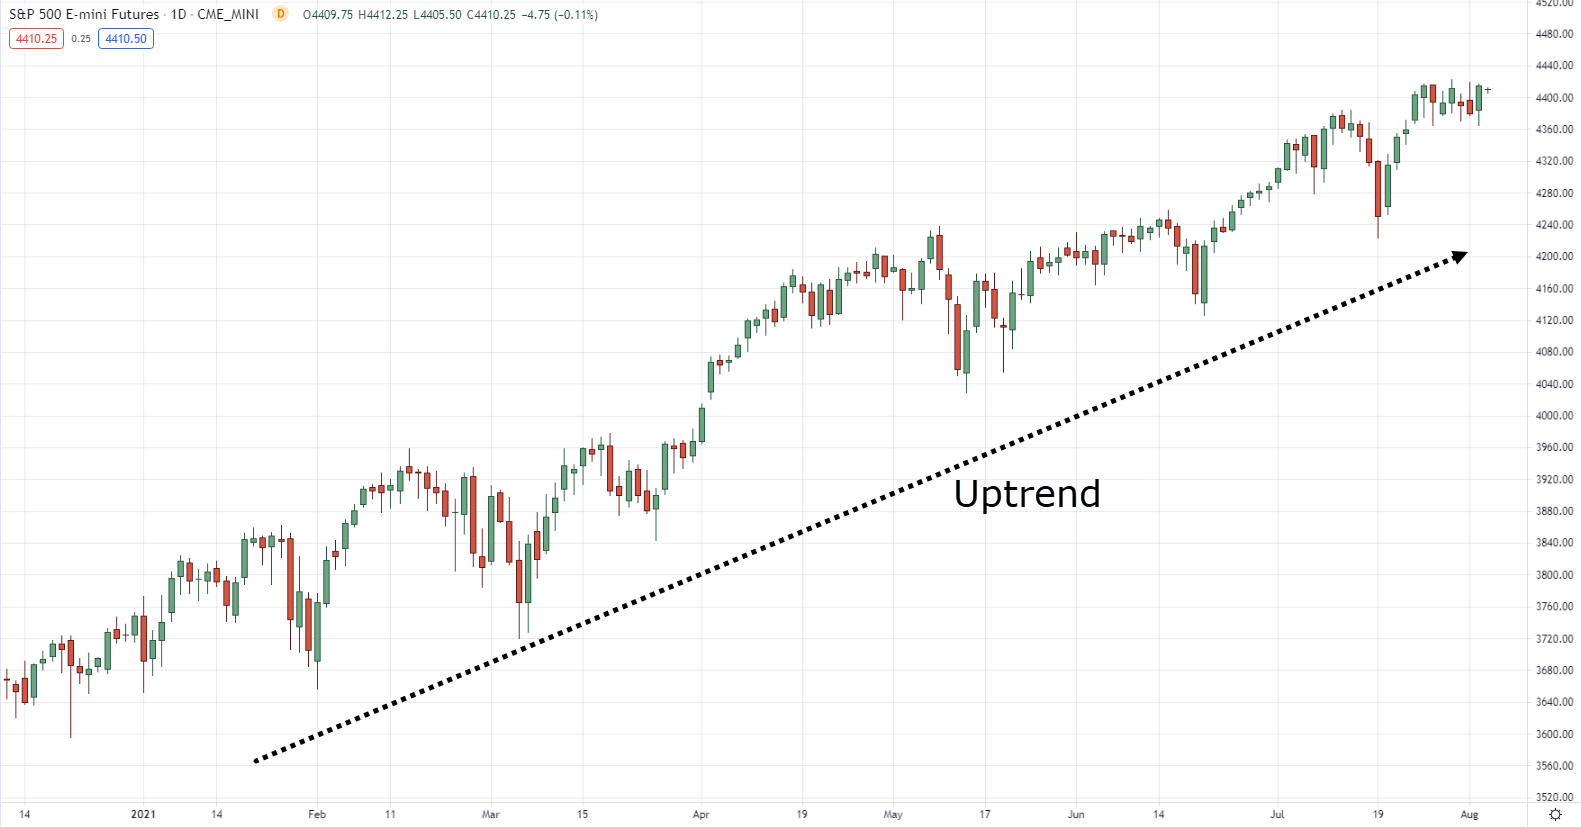
When you spot a market in an uptrend, you want to look for buying opportunities because the market is likely to continue higher.
Now, it doesn’t mean you can’t be a seller in an uptrend because there are counter-trend traders who do so.
But if you’re new to trading, it’s much easier to make money on the right side of the trend than against it.
Next…
Downtrend
A market is in a downtrend when the price shows a series of lower highs and lower lows.
Here’s an example…
Bitcoin Daily Timeframe:
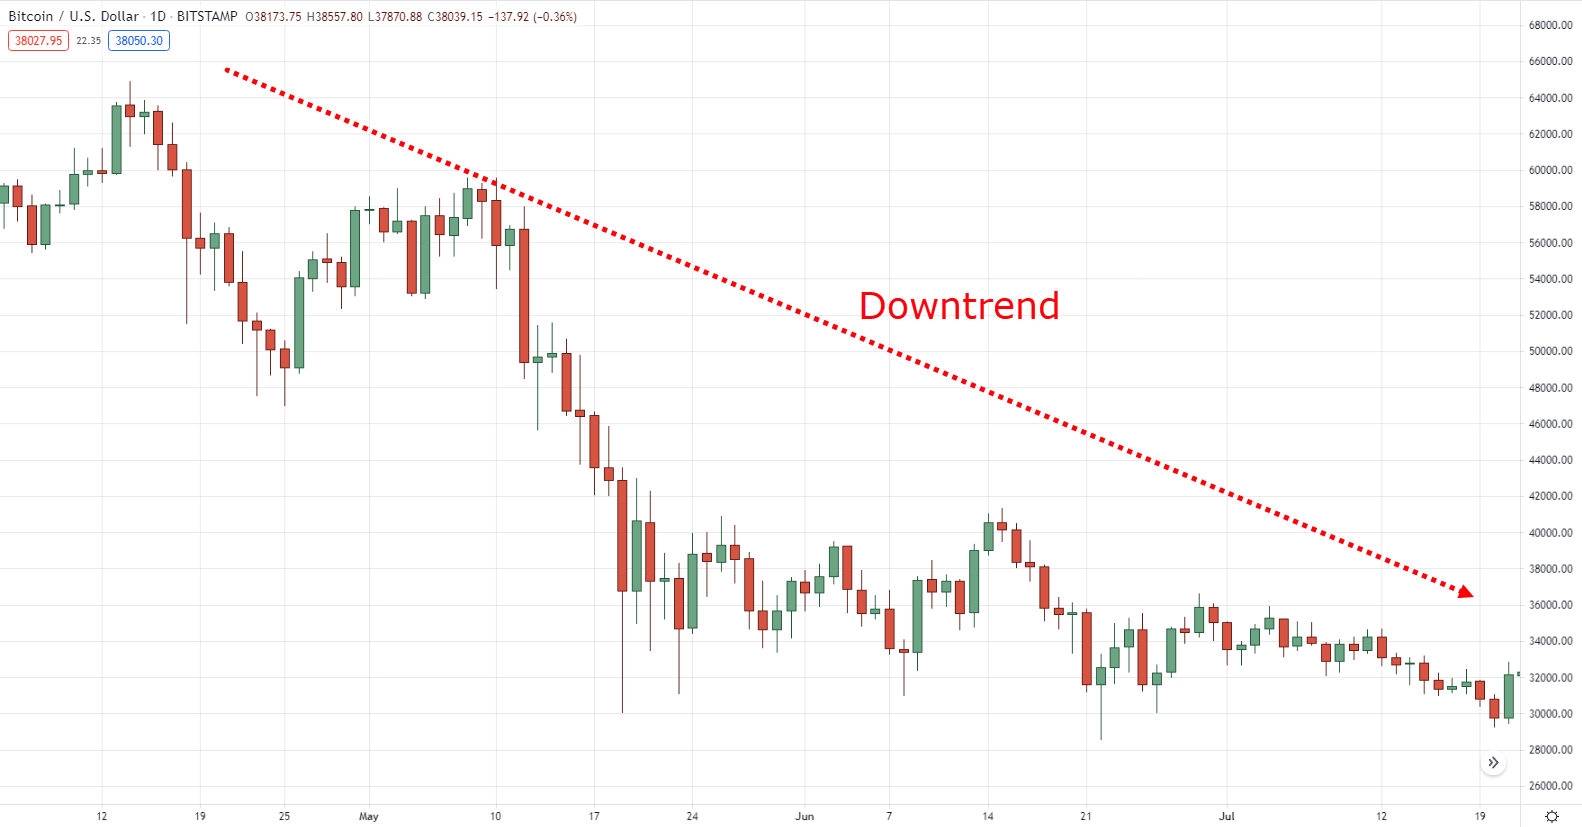
Likewise, when you spot a market in a downtrend, you want to look for selling opportunities because the market is likely to continue lower.
Now you might be wondering:
“Where do I enter in a trending market?”
I’ll get to that in a moment.
For now, let’s have a look at a range market…
Range
A market is in a range when the price is contained with the highs and lows (kind of like “stuck in a box”).
Here’s an example…
EURUSD 8-Hour Timeframe:
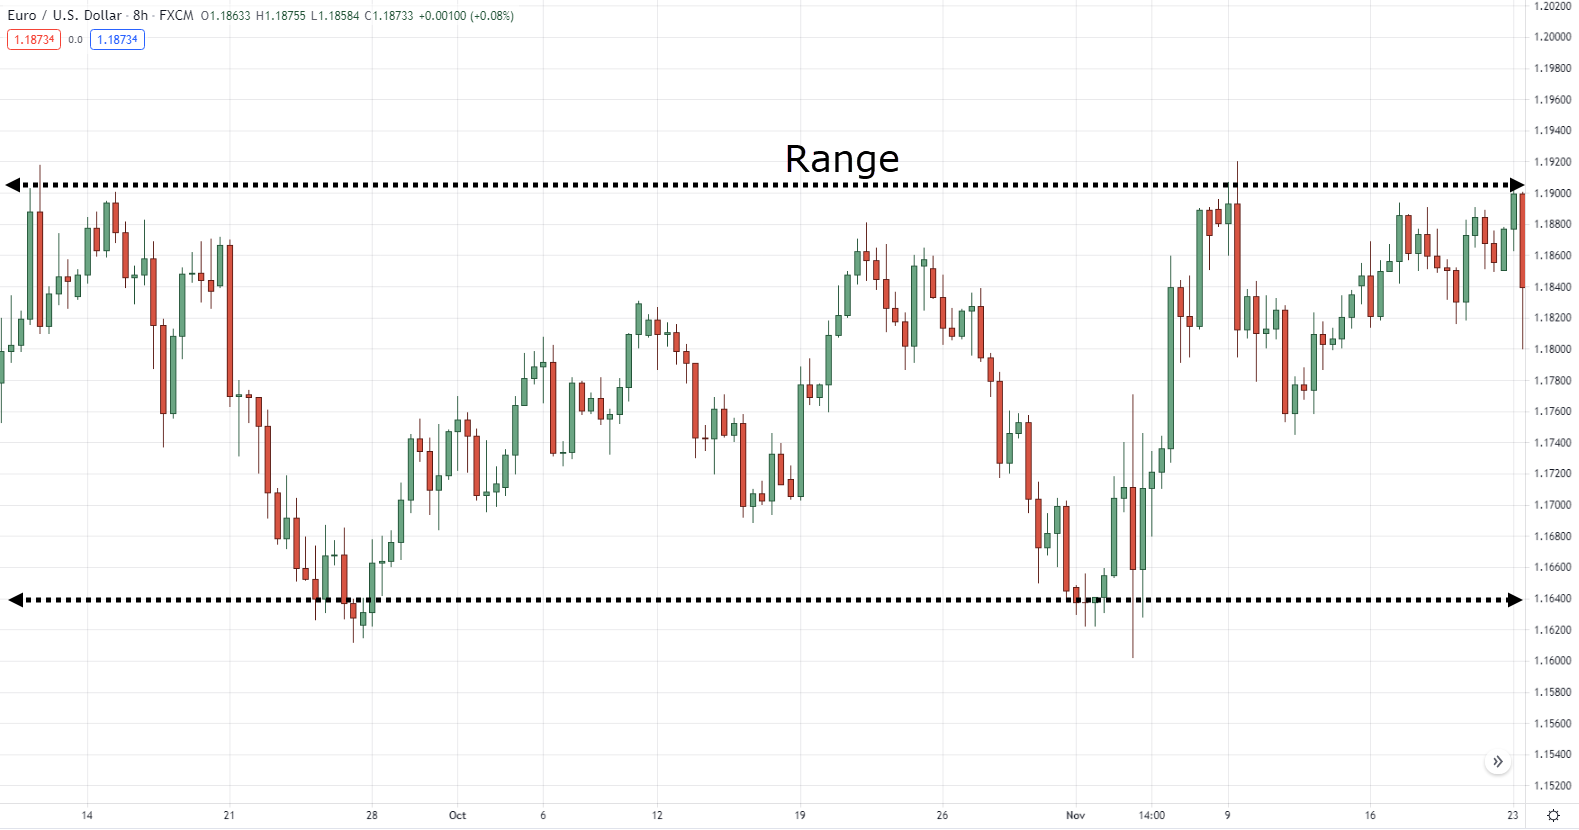
When the market is in a range, you can look to sell near the high of resistance or buy near the low of support.
At this point you might be wondering:
“Ah, this is simple.”
“I’ll just wait for the market to be in an uptrend and then buy!”
Well, not so fast my young padawan.
Just because you’ve identified the market structure doesn’t mean you should enter a trade immediately.
Why?
That’s because the price could be overextended and about to make a pullback (or a reversal).
And this brings me to the next section…
#2: Area of value
Area of value refers to an area on your chart where buying (or selling) pressure could step in and push the price higher (or lower).
There are many ways you can define an area of value. But one useful technique is to use support and resistance.
Let me explain…
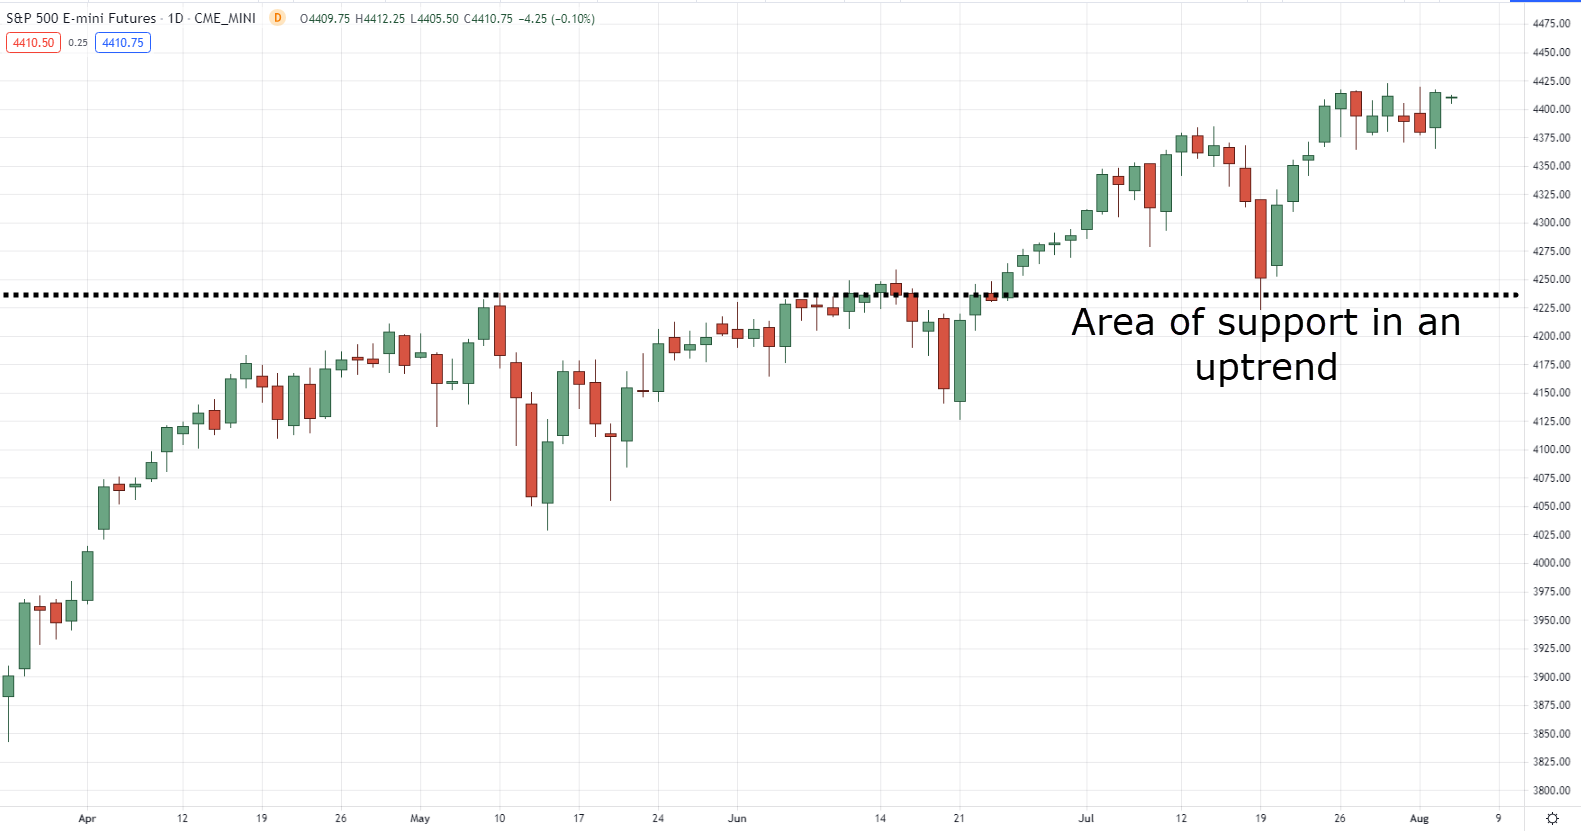
Support
Support is an area on your chart where buying pressure could step in and push the price higher.
So, when you combine market structure and area of value, you can look to buy support in an uptrend.
Here’s an example…
S&P 500 Daily Timeframe:
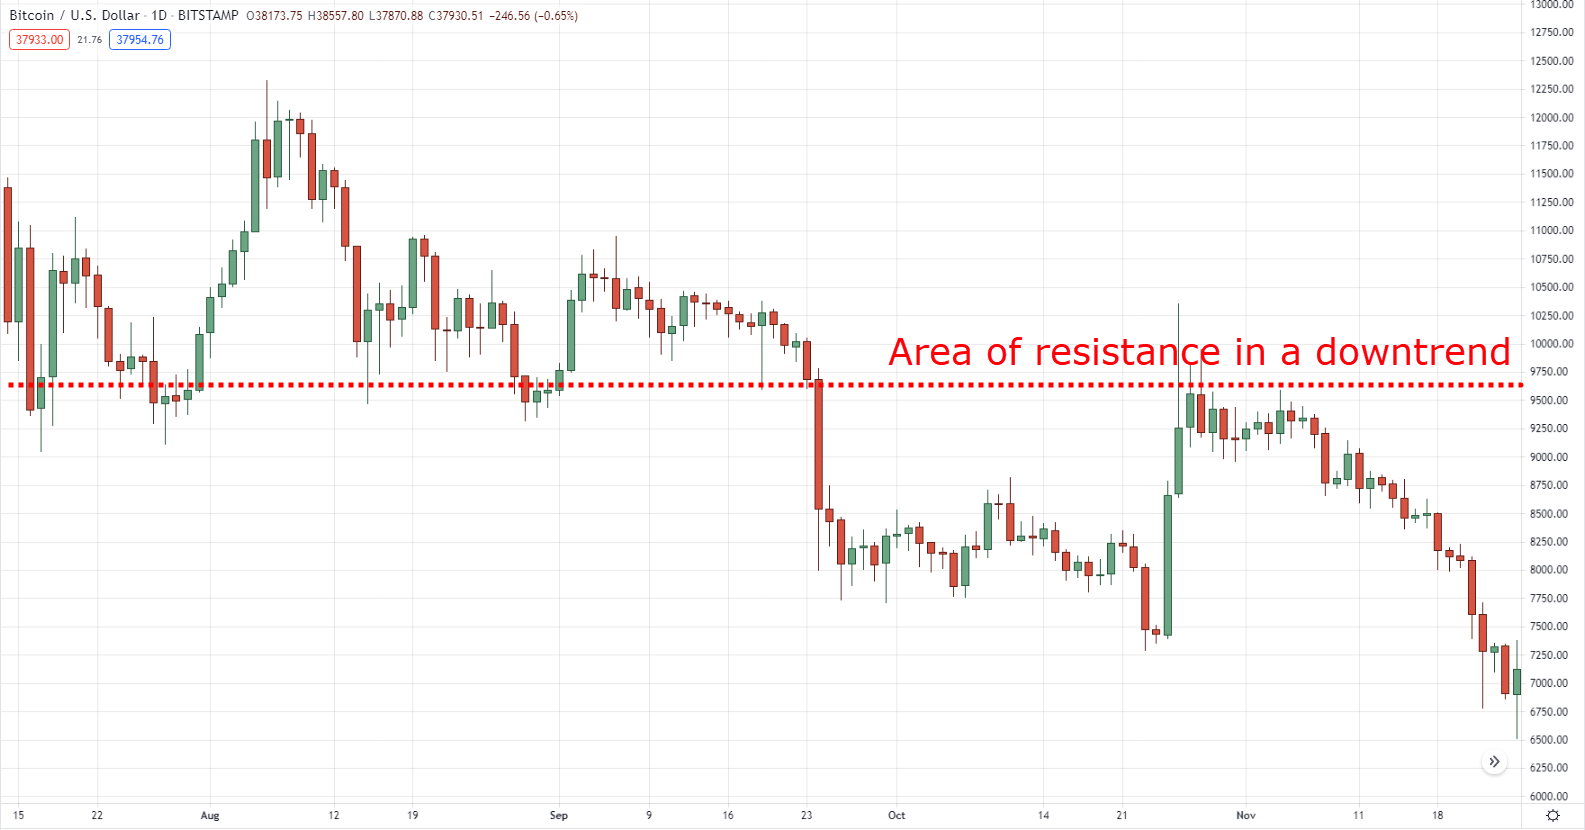
Resistance
Resistance is an area on your chart where selling pressure could step in and push the price lower.
Likewise, you can look to sell at resistance in a downtrend.
Here’s an example…
Bitcon Daily Timeframe:
Does it make sense?
Great!
Because in the next section, you’ll discover when exactly to enter a trade.
Read on…
#3: Entry trigger
So, what is an entry trigger?
This is a specific price pattern that tells you the buyers/sellers are momentarily in control.
When you spot such a pattern, you can then enter the trade (assuming all other conditions are met).
One way to define an entry trigger is using candlestick patterns.
This could be things like:
- Hammer
- Bullish engulfing pattern
- Shooting star
- Bearish engulfing pattern
Let me explain…
Hammer
A hammer is a (one-candle) bullish reversal pattern that forms after a price decline.
It tells you the buyers have overwhelmed the sellers and they are now in control.
- Little or no upper shadow
- The price closes at the top ¼ of the range
- The lower shadow is about two or three times the length of the body
Next…
Bullish engulfing pattern

A bullish engulfing pattern is a (two-candle) bullish reversal pattern that forms after a price decline.
It signals the buyers have overwhelmed the sellers and they are now in control.
Here’s how to recognize it:
- The first candle has a bearish close.
- The body of the second candle completely “covers” the body of the first candle (without taking into consideration the shadow).
- The second candle closes bullish.
Next…
Shooting star
A shooting star is a (one-candle) bearish reversal pattern that forms after an advance in price.
It tells you the sellers have overwhelmed the buyers and they are now in control.
Here’s how to recognize it:
- There is little or no lower shadow.
- The price closes at the bottom quarter of the range.
- The upper shadow is about two or three times the length of the body.
Next…
Bearish Engulfing Pattern

A bearish engulfing pattern is a (two-candle) bearish reversal pattern that forms after an advance in price.
It signals the sellers have overwhelmed the buyers and they are now in control.
Here’s how to recognize it:
- The first candle has a bullish close
- The body of the second candle completely “covers” the body of the first candle (without taking into consideration the shadow)
- The second candle closes bearish
Now, let’s have a look at our final component of The MAEE formula…
#4: Exits
When it comes to exits, there are two parts to it:
- Stop loss: exit when you’re wrong
- Target profit: exit when you’re right
Let’s get to it…
Stop loss: Exit when you’re wrong
As much as you want every trade to be a winner—that’s not possible.
That’s why you must have a stop loss in place, to contain the losses should the market move against you.
As a guideline, your stop loss should be at a level which invalidates your trading setup.
This means if you’re looking to buy at support, then your stop loss should be a distance below it, such that if the price reaches it, then support is broken.
Here’s an example…
EURUSD Daily Timeframe:
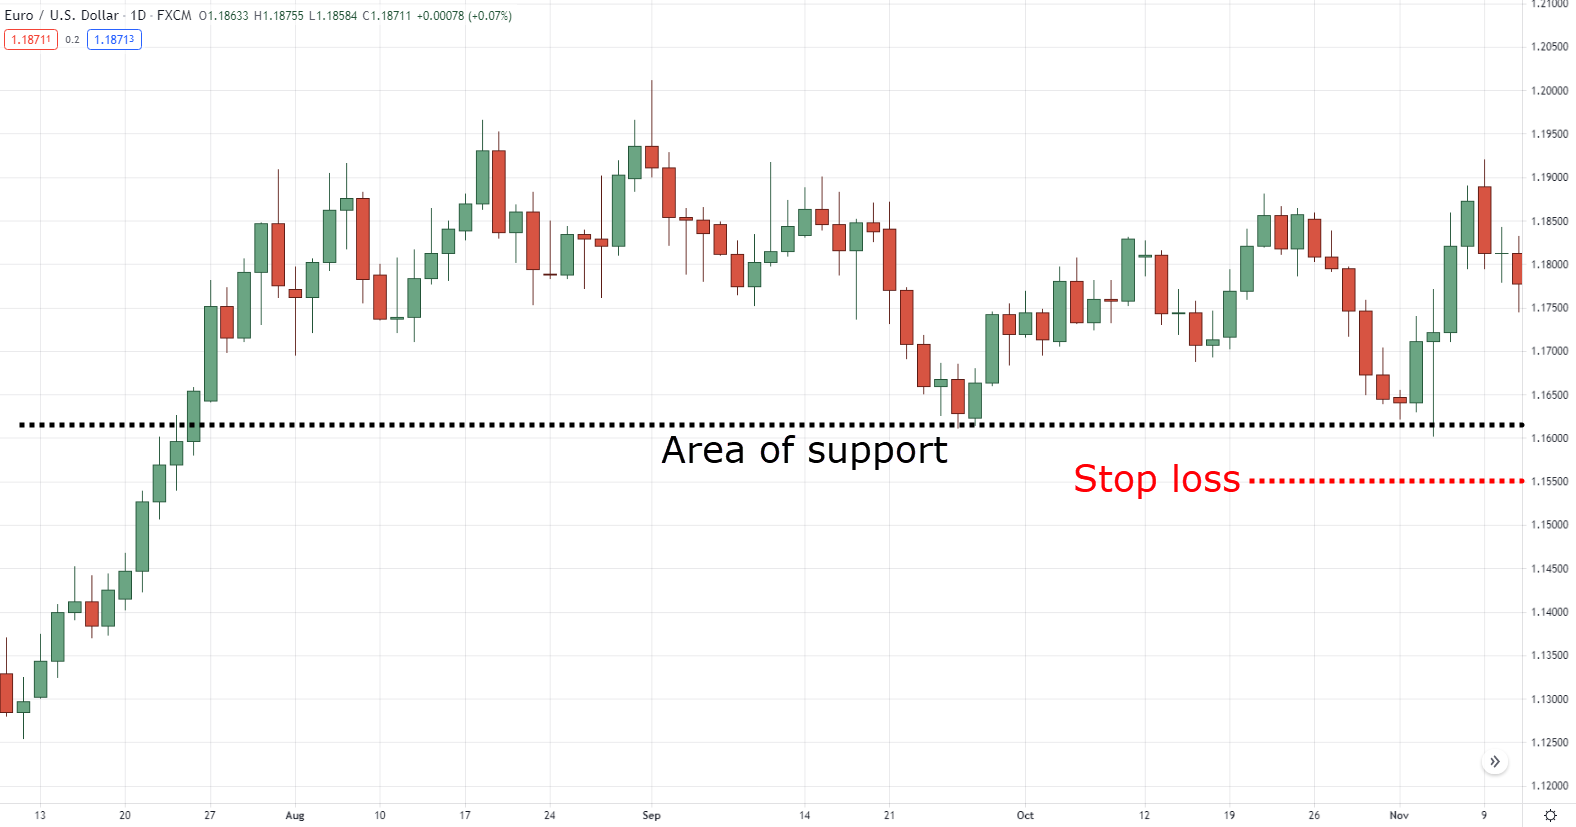
Stop loss a distance below support
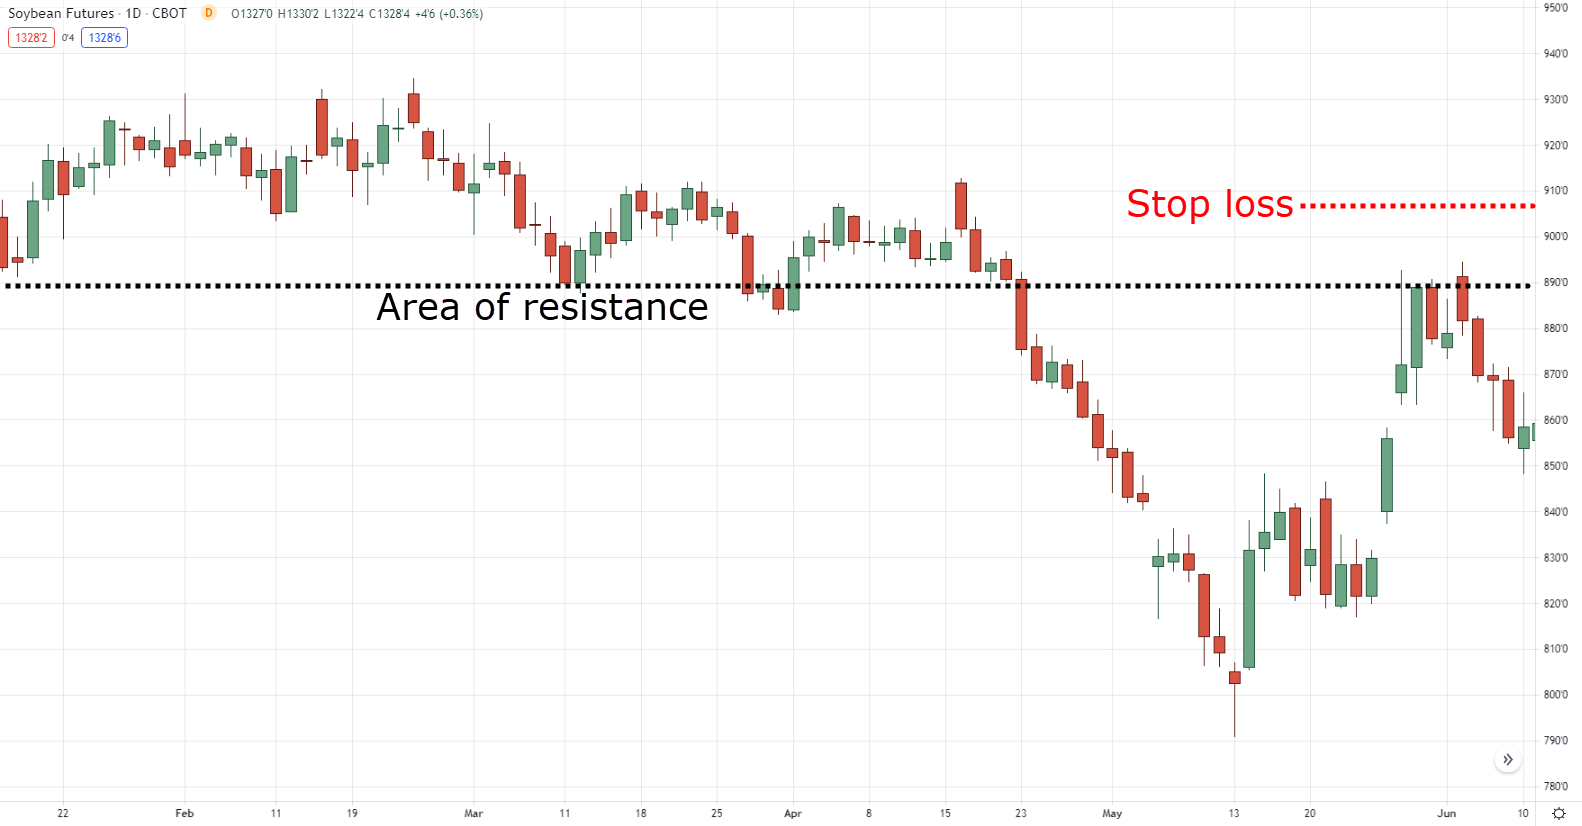
And the same concept applies to resistance.
Your stop loss should be a distance above it, such that if the price reaches it, then resistance is broken.
Here’s what I mean…
Soybean Daily Timeframe:
Moving on…
Target profit: Exit when you’re right
When it comes to target profit, you want to be smart about it.
Set it too far away and the market is unlikely to reach the level—and you’ll watch your winner become a loser.
The solution?
Set your target profit at a level before opposing pressure steps in.
This means if you are long at support, then you want to exit your trade before the nearest swing high (or resistance) where selling pressure could step in.
Here’s an example…

Likewise, if you are short at resistance, then you want to exit your trade before the nearest swing low (or support) where buying pressure could step in.
Here’s what I mean…

Does it make sense?
Good!
In the next section, you’ll learn how to use The MAEE Formula to profit in bull and bear markets.
Let’s go…
The MAEE Formula (Trading Examples)
A quick recap…
Market structure tells you what to do, whether to be a buyer, seller, or stay out of the markets.
Area of value tells you where to look for buying or selling opportunities.
Entry trigger tells you when exactly to enter a trade.
Exits tell you when to get out of a winning and losing trade.
So far so good?
Then let’s have a look at a few examples…
Example #1: GBP/JPY (Daily Timeframe)
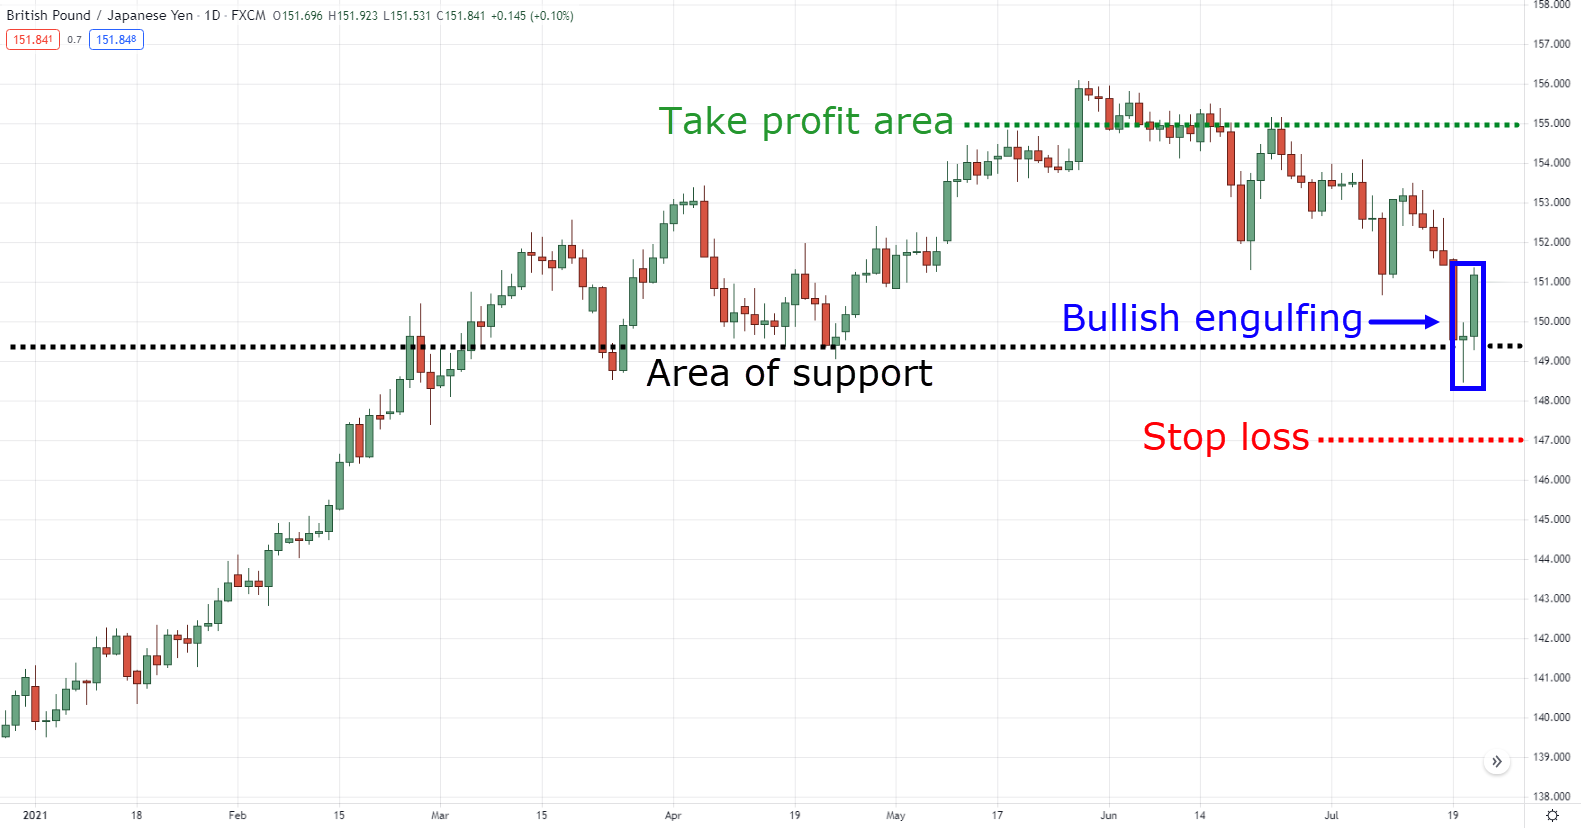
GBP/JPY is in an uptrend as the price made a series of higher highs and lows (market structure).
Then it made a pullback into previous resistance which could become support (an area of value).
At this point, you’ve no idea if the market will slice through support or reverse higher.
That’s why you’ll use candlestick patterns to gain further insight. In this case, the price formed a bullish engulfing pattern (entry trigger) which signals the buyers are in control.
This means you can enter on the next candle open with your stop loss a distance below the swing low.
As for target profit, you can exit before the recent swing high.
Example #2: Bitcoin (8-hour Timeframe)
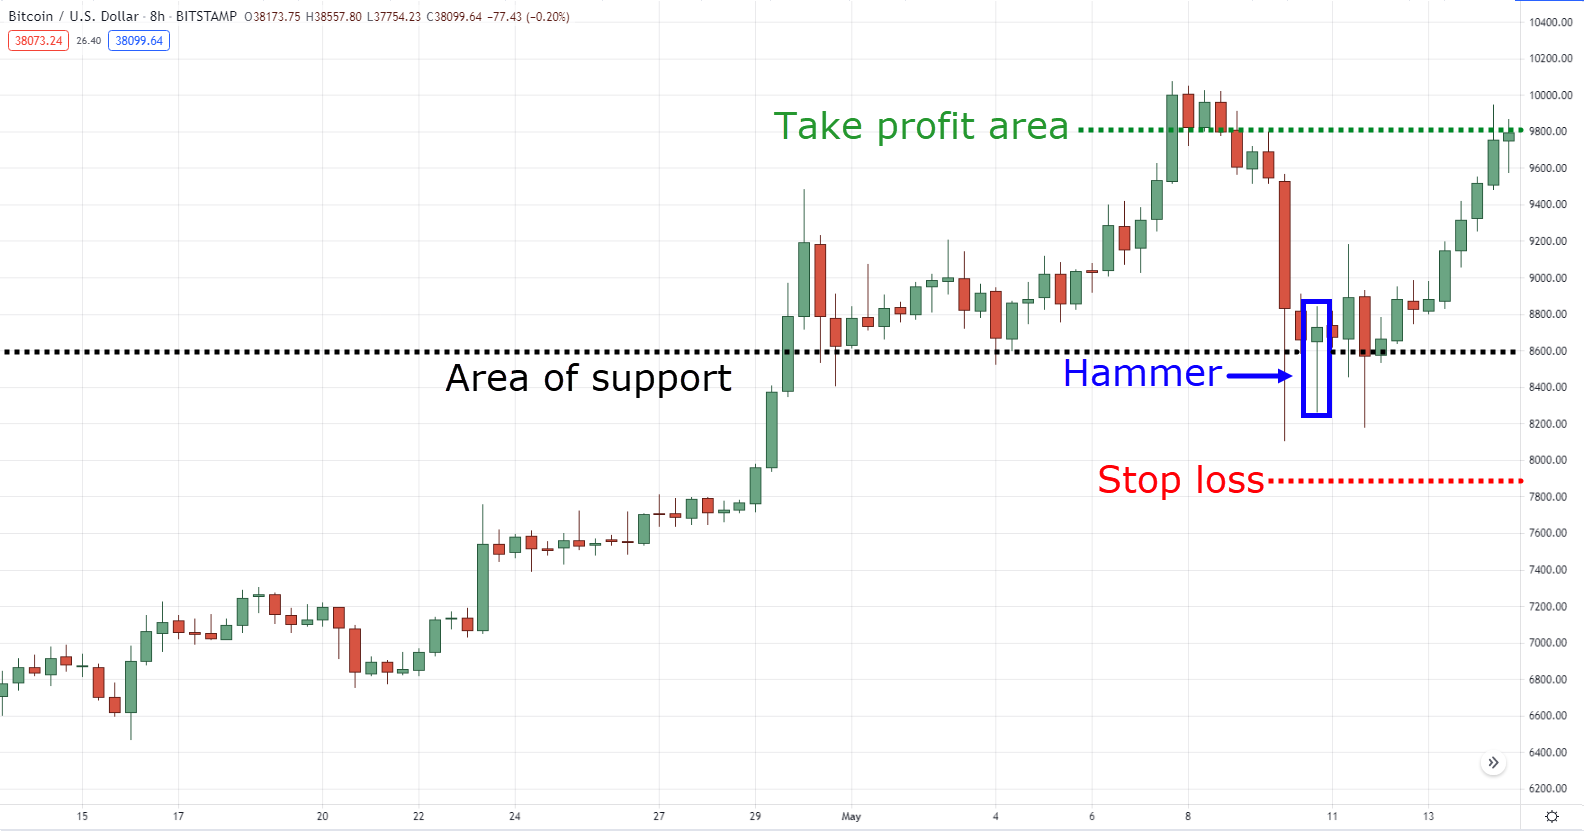
Bitcoin is in an uptrend as the price made a series of higher highs and lows (market structure). Then it made a strong sell-off into support (an area of value).
At this point, the strong bearish momentum would scare most buyers away.
But, you’re smarter than that as the market is still in an uptrend so you’re still looking for buying opportunities.
However, you don’t want to blindly buy in front of support as the price could smash through it.
So, you wait for a valid entry trigger before going long. In this case, the price formed a hammer pattern which signals the buyers are in control.
This means you can go long on the next candle open with your stop loss a distance below support.
As for target profit, you can exit before the recent swing high.
Example #3: USD/CNH (8-hour Timeframe)
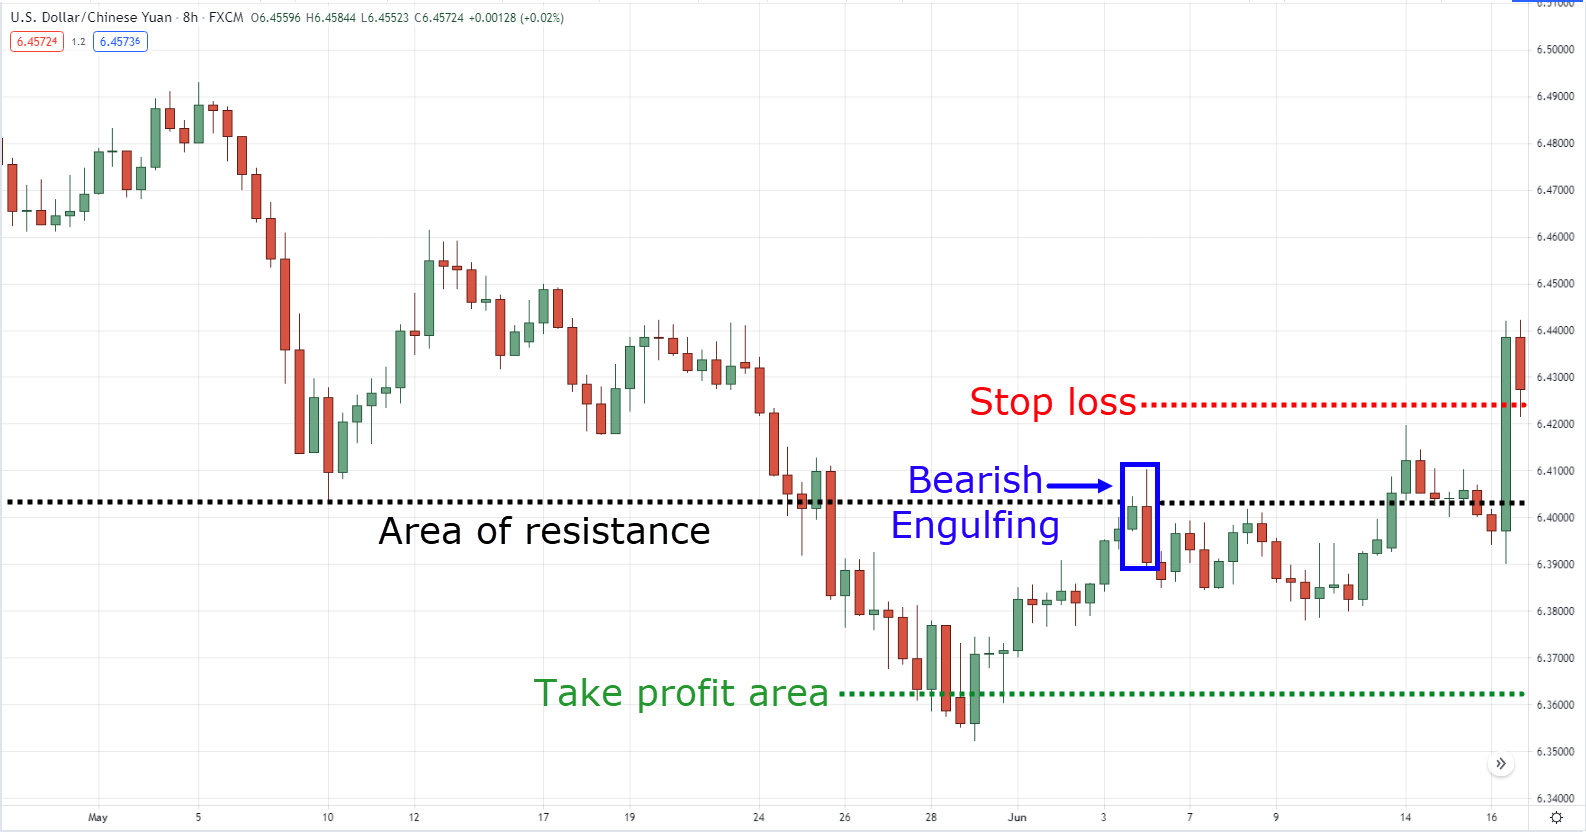
As you can see, USD/CNH is in a downtrend as the price made a series of lower highs and lows (market structure). Then, it made a pullback into previous support which could become resistance (area of value).
Next, you’ve got a bearish engulfing pattern which signal the sellers are in control.
At this point, you can go short on the next candle open and have your stop loss a distance above the swing high.
As for the target, you can look to exit before the nearest swing low.
In this case, it’s a losing trade as the price reversed higher and hit your stop loss.
This is the reality of trading. No matter how good a trading setup looks, there’s still a possibility of a loss. That’s why you have risk management in place so you can contain your losses and avoid blowing up your trading account.
Example #4: HMHC (Daily Timeframe)
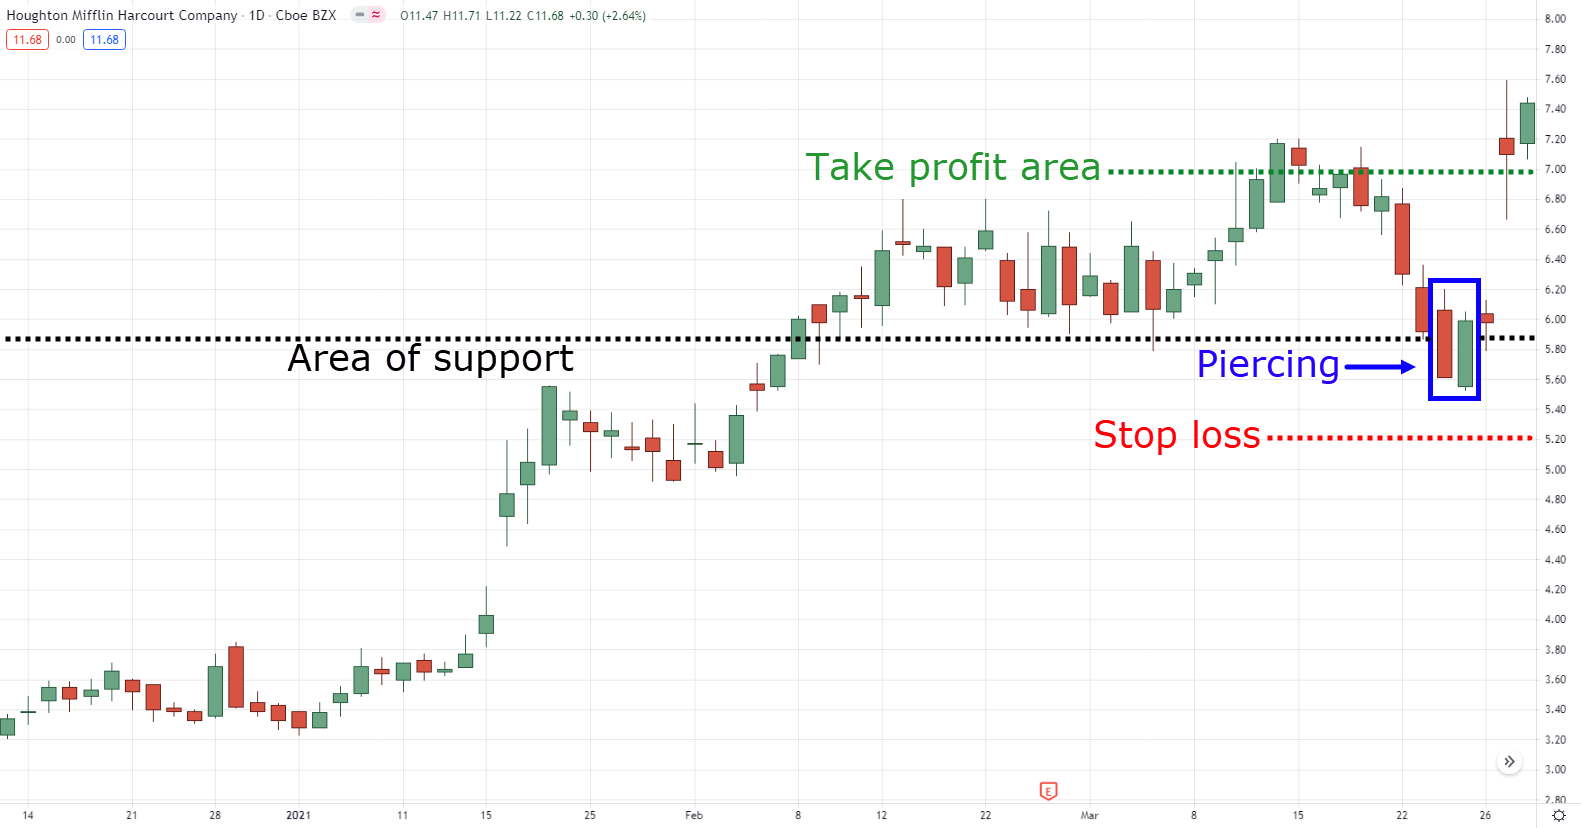
Now, let’s have a look at a stock trading example.
Houghton Mifflin Harcourt Company (HMHC) is in an uptrend as the price forms a series of higher highs and lows (market structure). Then it made a pullback into support (area of value).
Again, you’ve no idea if the price will reverse at support or break through it. That’s why you wait for an entry trigger to time your entry.
In this case, the price forms a piercing pattern (a type of bullish reversal candlestick pattern) which signals the buyers are in control.
This means you can enter on the next candle open with your stop loss a distance below the swing low.
As for target profit, you can exit before the recent swing high.
Now at this point…
You’ve learned The MAEE Formula and how you can use it to profit in bull and bear markets.
Of course, there’s more to price action trading than just a formula.
That’s why I’m opening up the doors to my premium training program, The Ultimate Price Action Trader (UPAT).
In this course, you’ll discover how to become a consistently profitable trader without relying on indicators, news, or opinions.
More details soon.
Stay tuned!
Hi, Rahman!
You can check this link on how to draw support and resistance:
https://www.youtube.com/watch?v=qm90uTnxY1U
You’re most welcome, Adrian!
Hi, Ankit!
We do have a sneak peak video of our UPAT!
Kindly check this out:
https://www.tradingwithrayner.com/upat-demo/
Cheers!
You’re most welcome, William!
Thanks, Torto!
Thank you Rayner
You’re very welcome!
Thank you Rayner for your insight.
Question: could there be any instance where price might form a hammer (or shooting star) candle signaling bullish reversal (or bearish reversal) but the opposite occurs as price continued downwards (or upwards)
Thank you so much Rayner.
i just lerned MAEE frome your videos. or revised here. waiting for next.
A simple but effective trading strategy, hope this helps you in your trading career!
Cheers!
If I could meet with you for real…
I’d give you a hug!
You’re a great guy
Thank you Rayner
Thank you for your kind words, Kester!
Cheers!
RAYNERRR!
master piece….
Glad you find it useful, Shailesh!
Really helpful. Thank you
You’re more than welcome, Scot!
Thanks Rayner for the great tips.
Happy to help, Habibah!
Nicely explain Rayner
Many Thanks, Yut!
Thankyou Rayner looking forward to watch more of your videos
Thank you for the support, Racheal!
Well explained, simple and clear.
We’re happy to help, Dennis!
thank you brother thanks a lot
It was the least we could do, Sagar!
nice
Sir plz send me a strategy for 15 or 30 minute trading. saidqamar@gmail.com
Thanks
Hi Rayner!
I am a new trader, doing my best to get the know how before i start real trading. I am quite impressed with your way, i follow easily and the examples are appropriate. Can you suggest a sequence of your videos for a starter like me. Keep it up, you are really great!
Hey, Tladi!
If you are new to trading, I suggest taking our Free course in our Academy. This will help you out big time!
Here is the link:
https://www.tradingwithrayner.com/academy/
Cheers!
Thanks Sir…
I got this email few minutes after being wiped out of the last cash on me
Thanks for your guide
You’re welcome, Paul!
You can check this link on How to write a trading plan:
https://www.tradingwithrayner.com/how-to-write-a-forex-trading-plan/
Hope it helps!
MAEE best way to make profit in market, most of the beginners forget to put SL with trade so that they are pay for it, Thank You Rayner
Good stratgies
Hi Rayner I am big fan of your trading strategy, But still I am struggled during swing trading, Kindly please help us take make profit and enter into right entries and right exit even I know hammer, engulfing, Shooting star!!! But still difficult to entry and exit!!!
If you’ve been struggling with your trade exits for the longest time, then check this video:
https://www.youtube.com/watch?v=Qe6ALKk-IXw
That video may help you on how to exit your trades.
Cheers!
I love the way you explain,it’s so easy even a 8yr old can understand.keep up the good work
Thanks, John!
We’re happy to help!
Simplicity is a beauty!
Glad you find our post useful!
Cheers!
Thanks teacher, I received it with clean heart and continuing learning more about it
It’s our pleasure, John!
Bro your every video, every mail has taught me so much about trading. Thank you for that. Keep up the good work.
Thank you for your kind words, Aniruddh!
Keep on learning!
Thanks Rayner, great knowledge. Will try to understand the method and apply it. Appreciate with your explanation.
Glad you find our material useful, Ahmad!
Cheers!
recently I read your book unlimited price action trading it’s a great book, you have any telegram channel?
Thanks for reading our book, Aasim!
Here is our Telegram channel: https://t.me/tradingwithrayner
Cheers!
Thanks for the insightful lesson Rayner.. learning so much from your emails and your tube videos
Glad to know you find our materials informative, Aubrey!
Cheers!
Your piece of advice is highly appreciated.
Thanks, Sammy!
Sir I am intrested in intraday trading and wanted to know which timeframe i should use for the day itself!!!
Hello Rayner! thanks for your explanation!. How would you measure market preasure?
Thanks so much dude
You’re most welcome!
Very good sir
Many thanks, Ashiq!
Thank you so much
Great tank you
Thanks sir for your efforts.
No big deal, Daniel!
We’re happy to help!
Cheers!
Very Usefull
awesome.
Thank you very much, Mabuhay!
You’re most welcome, Agerico!
Cheers!
Great strategy
Thanks, William!
Highly informative
Thanks!
i learn alot from yr written theory. Simple and clear. easy to follow.
Hey there, Vetha!
Jarin here from TradingwithRayner Support Team.
Indeed. A simple but effective trading strategy, hope this helps you in your trading career!
Cheers!
I so much every bid of your lecture and upgraded my knowledge as new client in this business. Thank you sir
You’re most welcome, Attah!
Thank you
You’re truly welcome, Shailendra!
It means a lot for me bro. Thanks for ur helpful information
It’s our pleasure to help, Bikram!
Thanks
Cheers!
Mind blowing eager to learn more rayner
That’s good to hear, Raghu!
Keep on learning!
Cheers!
Which time frame chart should we check for intraday trade
15 mins chart to 1-hour chart. However, Rayner is a swing trader.
IF you wanna learn more about Intraday Trading, Check this out!
https://www.tradingwithrayner.com/intraday-trading/
Thanks so much Rayner, it always insightful reading your post, I recommend you to everyone out there who wants to be a profitable trader
Thanks for sharing, Michael!
That’s cool and awesome guy.i like it
Thanks, Midala!
Thank you sir. This is great.
It’s our pleasure to help, Bomboy!