So…
In the earlier posts, you’ve learned what is price action trading and some of the biggest trading lies that have fooled many traders.
If you’ve not read it, go check it out below…
The Power of Price Action Trading
Moving on…
You’ll discover some of the biggest mistakes traders make and how you can avoid it.
Plus, you’ll learn my MAE formula to help you identify high probability price action trading setups — consistently and profitably
So read on…
You’re a “one trick pony” Price Action Trader and you can’t adapt when the market changes
Here’s the thing:
Most Price Action traders are a “one trick pony”.
You have only one Price Action setup and it usually looks something like this…
- You wait for the price to come to an area of Support
- You wait for a Bullish Hammer to form
- You go long
Now, there’s nothing wrong with this Price Action setup.
But if this is your only “trick”, then you’ll find yourself waiting…
Waiting…
Waiting…
Waiting…
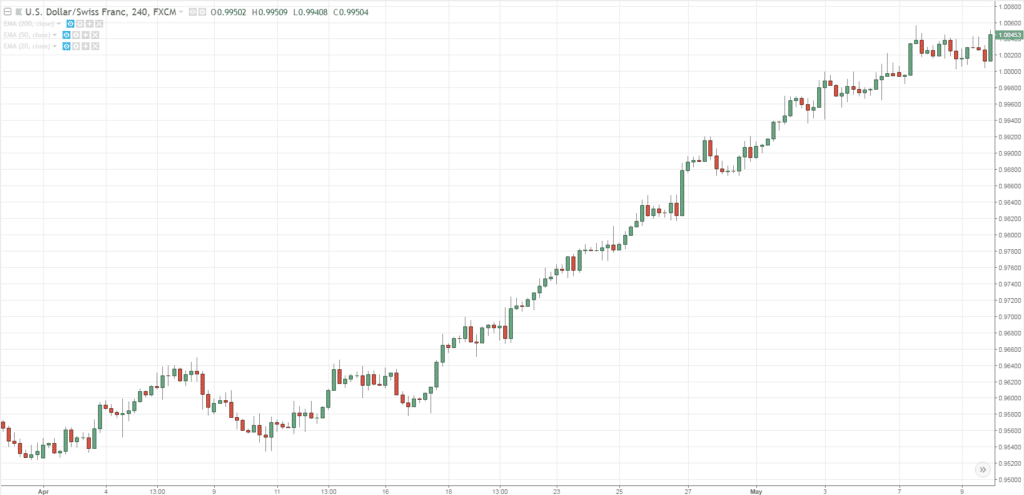
When the market is in a strong trend like this:
Clearly, in this market condition, the price hardly re-tests Support in a strong trending market.
And if you’re a “one trick pony”, you’ll miss big moves like this.
The bottom line?
Don’t be a “one trick pony”.
Learn how to adapt your trading strategy as the market condition changes.
Your stop loss is too tight and it gets “eaten” easily
Now:
One of the biggest mistakes you can make is to have a TIGHT stop loss.
You’re probably thinking…
“But a tight stop loss reduces my risk and improves my risk to reward.”
Not true.
Because more often than not, you’ll get stopped first before the market can move in your favour.
This means your analysis might be correct but you still end up losing money because your stop loss is too TIGHT.
It’s ridiculous.
So, what’s the solution?
Increase the size of your stop loss so you can withstand the “noise” of the markets and watch the market move in your favour.
Here’s how…
Your stop loss must be at a location where if reached, will invalidate your trading setup.
This means if you short the head & shoulders pattern, then your stop loss should be at a level where if the market hits it, the entire pattern is “destroyed”.
Or if you’re long Support, then your stop loss should be below Support such that if the market hits it, chances are, Support is broken.
Now, I don’t suggest placing your stops just below Support or Resistance because you’ll get stop hunted easily.
Instead, give it some “buffer” so your trade has more room to breathe.
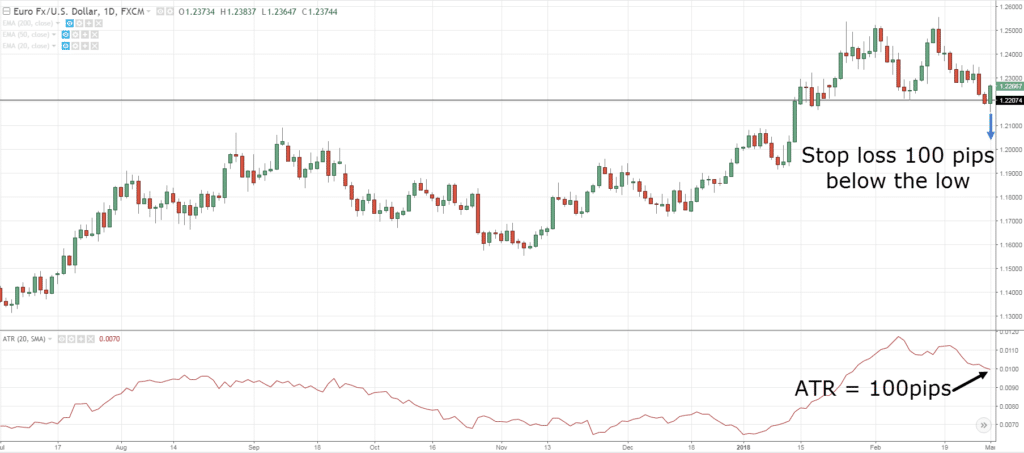
If you want to decide how much “buffer” to give, you can use the Average True Range (ATR) indicator and set your stop loss 1ATR below Support.
Here’s what I mean:
Next…
You don’t know how to read Price Action analysis
Here’s the deal:
Many of you are entering your trades because you’re bored or because the market is moving “fast” — and you want to catch a piece of the move.
This leads you to enter your trades at the worst possible time, only to watch the market reverse against you.
Ouch!
That’s why it’s important you do a Price Action analysis before putting on any trades.
You’re probably wondering:
“What is Price Action analysis?”
Price Action analysis is about identifying the correct market structure so you can apply the correct trading strategy to it.
I’ll explain…
Range market structure
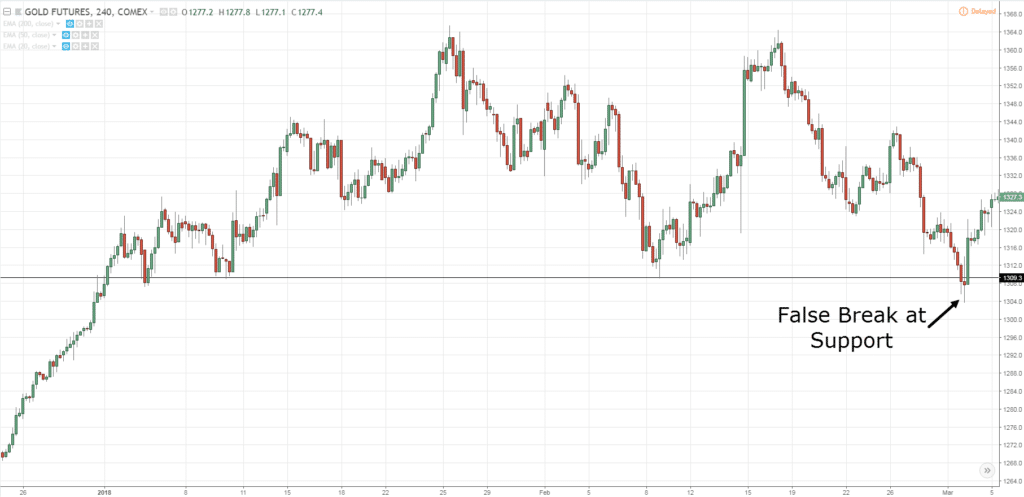
If the market is in a range, then you’d want to long Support.
So, an appropriate strategy you can use it to trade the False Break at Support.
Here’s what I mean…
Trending market structure
Alternatively, if the market is trending, then you’ll have a long bias.
So, a possible strategy is to go long on a pullback towards the Moving Average.
An example:
In short, Price Action analysis is knowing the current market structure and identifying an area of value to trade from.
(I’ll cover this in more details later.)
You trade Price Action patterns “blindly”
Let me ask you…
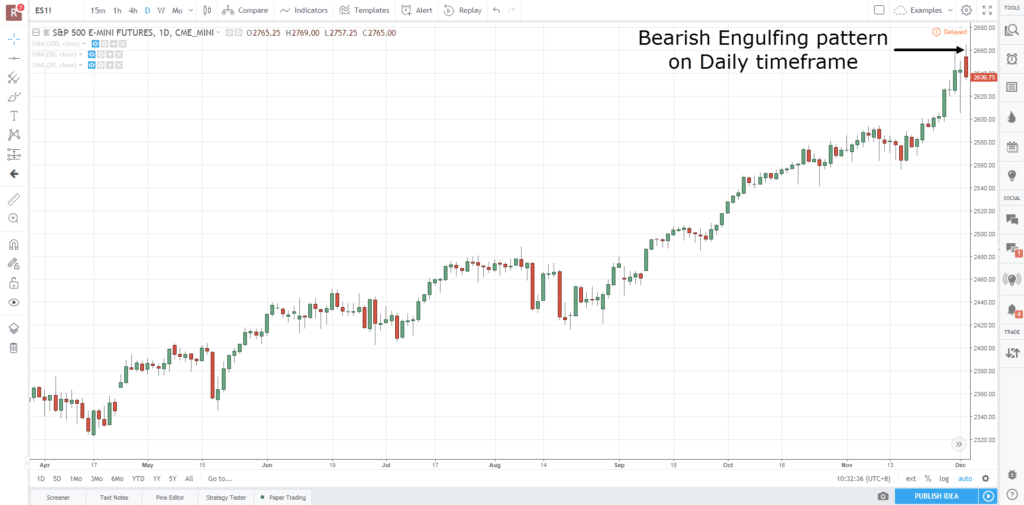
What do you think the market is saying when you see a chart like this?
Most of you would say it’s bearish because it’s a Bearish Engulfing pattern, right?
And some of you might even look to short the market.
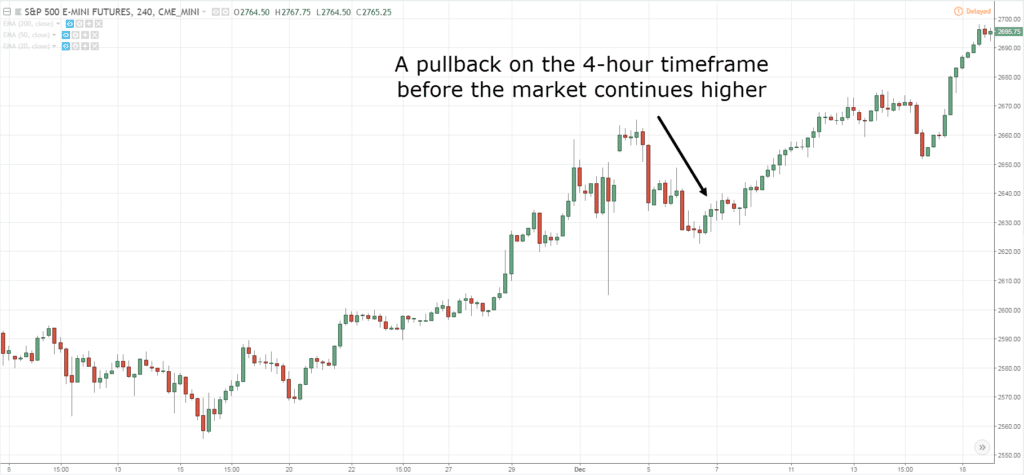
But before you do so, look at the chart below (on the 4-hour timeframe)…
Now it doesn’t look quite as bearish, agree?
And if you went short, then chances are you’ll get stopped out.
Hmm.
So what went wrong?
The lesson is this…
The market is clearly in an uptrend. And it’s unlikely that a single reversal pattern can “erase” the entire move.
Sure, sometimes that can happen.
But more often than not, the trend continues higher.
The MAE Formula
Now, I agree Price Action Trading falls under discretionary trading.
But it doesn’t mean it’s a subjective trading method — far from it.
Because once you know what to look for, Price Action Trading can be straight forward and objective.
Introducing, The MAE Formula.
Here’s what is MAE in trading and how it works…
- Market structure
- Area of value
- Entry trigger
I’ll explain…
#1: Market structure
Now, I know it can be daunting to be looking at a blank chart.
Because you don’t know what to do.
Should you buy, sell, or stay out?
That’s why the first thing to do is identify the market structure as it tells you what to do.
So ask yourself:
“Is the market in an uptrend, downtrend, or range?”
Once you know the market structure, then you’ll know what to do.
For example:
If the market is in an uptrend, you look to buy only.
If the market is in a downtrend, you look to sell only.
If the market is in a range, you can buy and sell.
So that’s the very first bit of MAE in trading.
Next…
#2: Area of value
Now, identifying the market structure alone isn’t enough.
Because you also need to know where to enter your trade.
Now you’re wondering:
“There are so many places to enter a trade. Which one should I choose?”
And this brings me to the second part of the MAE in trading—the area of value.
Well, you want to trade from an area of value so you can buy low and sell high.
For example:
- Support and Resistance
- Respected Moving Average
- Trendline
Next…
#3: Entry trigger
At this point:
You know what to do (identify market structure) and where to enter (area of value).
Now the final part of the equation is to know when to enter.
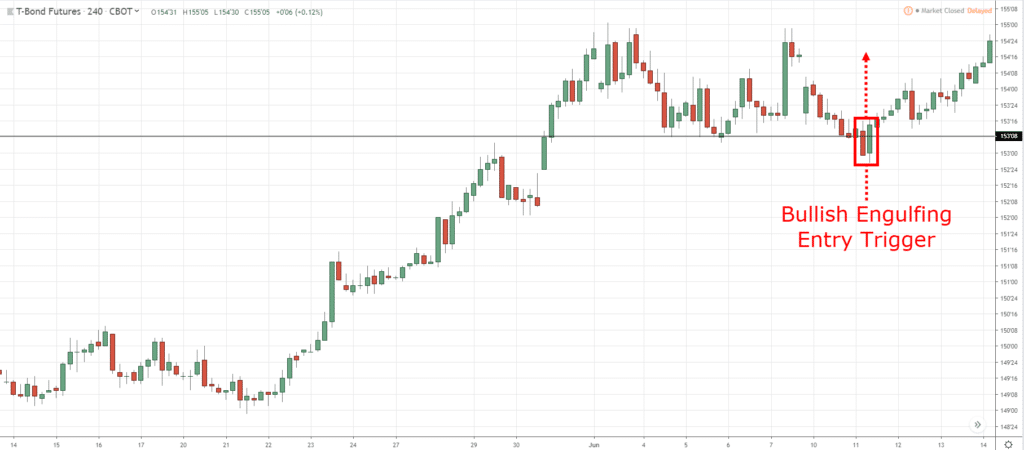
This brings us to the final part of MAE in trading, which is identifying a suitable entry trigger.
Personally, I like to enter when the market has shown signals of reversal — thus confirming my bias.
This can be in the form of reversal price patterns like:
- Hammer and Shooting Star
- Bullish and Bearish Engulfing patterns
- False Break
Here are a couple of examples:
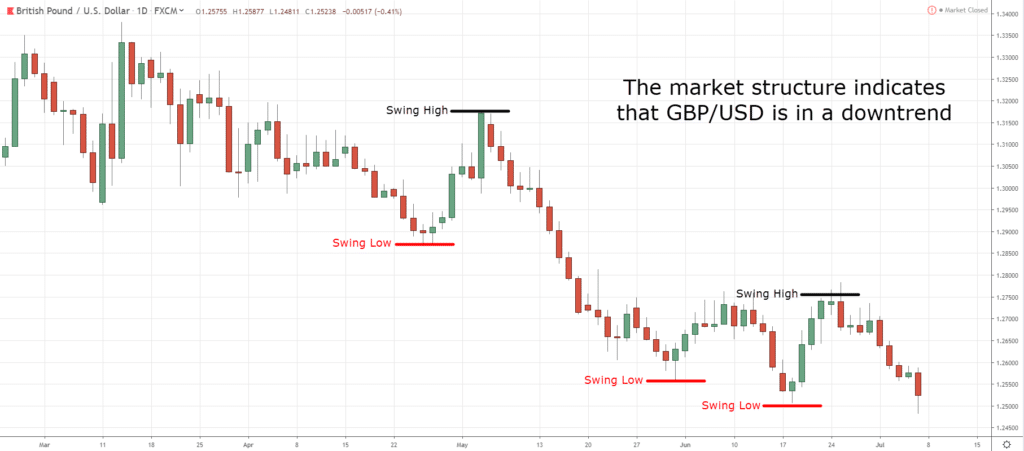
GBP/USD Daily: Identify the market structure
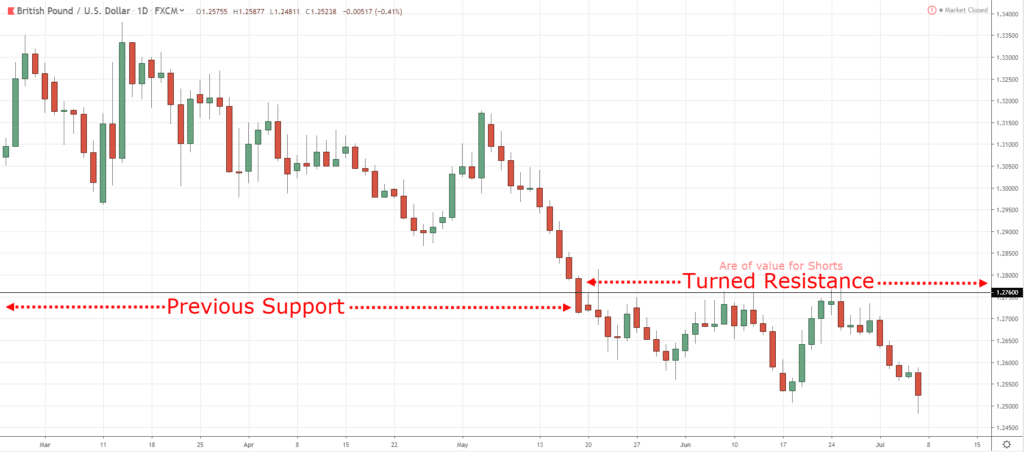
GBP/USD Daily: Wait for the price to reach an area of value
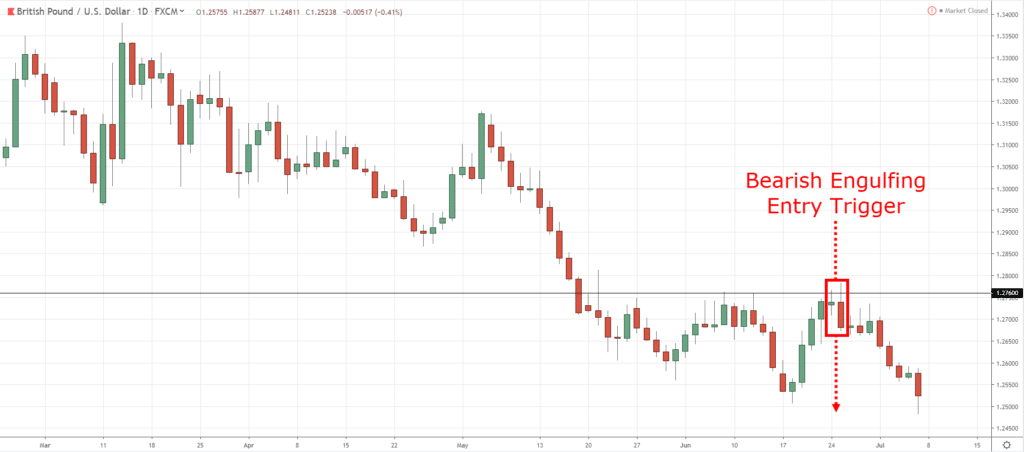
GBP/USD Daily: Enter on a valid entry trigger
Another example…
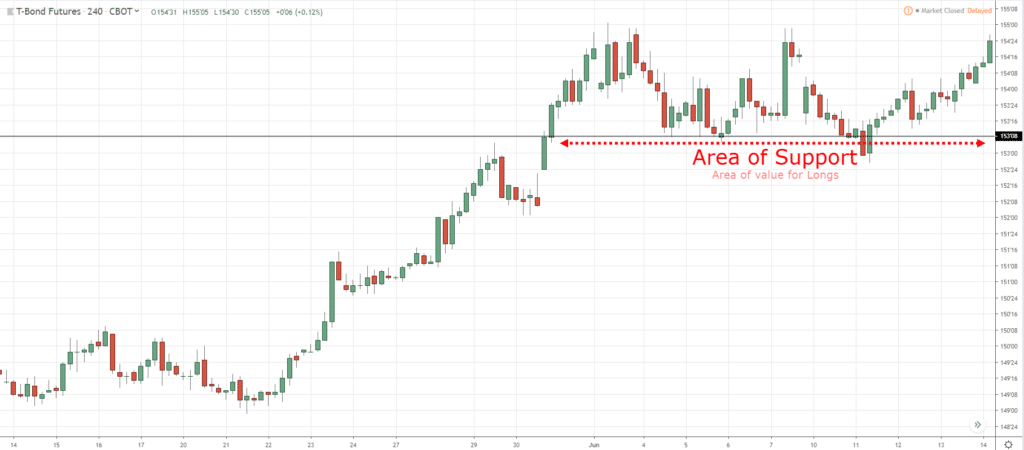
T-Bond 4-hour: Identify the market structure
T-Bond 4-hour: Wait for the price to approach an area of value
T-Bond 4-hour: Enter on a valid entry trigger
Now let me ask you…
Is Price Action Trading still subjective?
Not if you know the MAE in trading to tell you what to do, where to enter, and when to enter.
At this point…
You’ve seen the power of price action trading and how my simple MAE in trading can transform your trading results.
Now, if you want to level-up your price action trading skillset, then keep a lookout for my next email for enrolment of The Ultimate Price Action Trader.
It’s my premium trading program that shows you how to read the price action of the markets without relying on fundamental news, trading indicators, or chart patterns.
But for now, here’s what I’d like to know…
What are the “AHA” moments you had over the last few days?
Leave a comment below and share your thoughts with me.



Thanks Rayner for all your teaching. I am already profitable, but I allways apreciate your articles.
You’re welcome, Jorge!
Thanks rayner, im still new to the market i know this will help me, and lookong forward for the ultimate price action trader.
Woow! I have enjoyed learning forex trading from you sir. Price action is really awesome. May I pls know the recommended EMA’s to set into my mt4
Thanks master it very helpfull to me as a newbie in forex trading
Hi Rayner
I like to trade Fractals alongside Ichimoku. Your teachings fit with this so am keen to follow your articles. Thanks, Richard
Hey Richard if your computer program has auto darvas
check it out. I use it with the HULL mma. The fractals gets me in the continuan trades.
Mr Rainer have turned my trading attention to working with price action. Will take more practice because a chart without indicators is a bit unsettling for me as that was all I was using in the past with minimal success
Thanks Rayner. All your articles and videos are so enriching and what I love most about you is your honesty. Not painting forex as a get rich quick scheme and rather a business that takes time and persistent practicing. Thanks so much. I have been profitable since I got your first video on price action.
Awesome to hear that, Akubue!
Brilliant post! Your clarity of thinking is an amazing skill that not many market traders have. Would not be surprised if 20 years from now you become a modern day Buffett. BTW, what is AHA? Many thanks ! Love your work!
google aha moment
I appreciate the kind words, Gil!
Hi Rayner, I started following you somewhere last year and I can say for a fact my perception about trading has changed and I can read chart even better. Thanks for the great work
As always you are doing perfect,
I find my self on pattern reversal trades, and after 6 months loosing , newly I can make some money, I do exactly what you You said , but before I was trading base of what I am thinking which is completely wrong, now I’m trading base on what I see. Thank you Rayner, I’ll Trying to a better student I have the best Mentor.
Best wishes for you
I am highly delighted about your teaching,as a beginner I know nothing concerning trade but with your teaching I am picking up gradually,and I say thanks alot
The T Bond 4H is totally not in a downtrend
That was a typographical error. Every one knows it is on an uptrend. Please You don’t have to crucify my Rayner on the mistake.
Interesting how easier it is to read price action every time i read your articles. Thanks Rayner
In drawing the support and resistance with 4 hour timeframe, is it only the candle ️ sticks that formed within the 4 hour interval will be used
Is there any teacher better than Rayner Teo? No! I don’t think so. In my course of learning forex trading, I meet with numerous proffesional traders like Niall, Justin, to mention but a few. But in all, you are phenomenal. Even a layman will grasp everything you say and write .
Thank you master can help how it can be used for intraday trading
Thanks Rayner,,,,your articles always informative.Am an amateur and learning a lot from you.
You’re great ! How about top down analysis? Here’s the scenario:
DAILY
a. price is on the upper band of the bollinger band
b. rsi is on “overbought” area
WEEKLY
a. price is in the middle band
b. rsi is still on the middle as well
And also the reverse of the above scenario where the weekly and even monthly price is already on the upper band and rsi is on “overbought” area however the daily is still somewhere below or in the middle of the bb and rsi is still on 40 or above?
Big thanks coach.
Thanks so much sir, have learnt a lot
Hi Rayner, I always “sort off” traded price action, but the way you explain it just opened my eyes!
Awesome to hear that, Fanus!
thnx rayner….nice article…this helped me a lot
thanks Rayner for all your teaching am still new market
Always great are your strategies!!! Thanks for your untiring support to all the traders.
Please Rayner how will I know that the market is in range please show me the picture s of market that is range thanks.
Erayner sir you are the best and
People out here are charging us information that is not even compared to the info you give use for free. People are crooks out here and i thank the lord for you sir God bless you
Good strategy
Thanks Rayner for this lecture.. Soon ill be profitable same as other
Thanks master your teaching as improve my trading skills as a neewbees. How i which i have known you earlier,i would have been much much better by now.thanks
In establishing the market structure, is it the highest and the lowest of the price for the month, week or day do I use in drawing the Support and Resistance levels?
Thanks for your good works.
My “aha” moments were trying to be too greedy. Setting orders in between my swings. Sort of scalping, forgetting the basic rule, buy low sell high for big gains behind this method. Starting over on demo
Thanks Reyner I’m new at this and surely I’m starting to formulate a picture in my mind on how to approach my trading.
Thanks for your inspiring and wonderful lectures you are discharging .More inspiration in Jesus name.
Beautifully said
Well done
Thanks for teaching us
Thanks Rayner, I like the way you presented your MAE formula, together chart illustrations. It is more illuminating.
Glad to hear that, Arthur!
THANKS
Long Live Rayner but I miss your secret trading book cause I need it on PDF Or Email
You are most welcome, Nwafor.
What’s up Rayner, big fan. I’m curious how much is the winner percentage for the MAE trading formula