#2: How to Trade Pullbacks Like a Pro
Lesson 2
Hey hey, what's up my friends!
Welcome back to today's training video.
You're going to be learning all about:
- Trading pullbacks.
- What are the pros and cons of trading.
- Where is the likely place on the chart where the market will pull back into.
- Three different entry techniques that you can use to enter on a pullback.
Are you ready?
Then let's begin!
What is a pullback
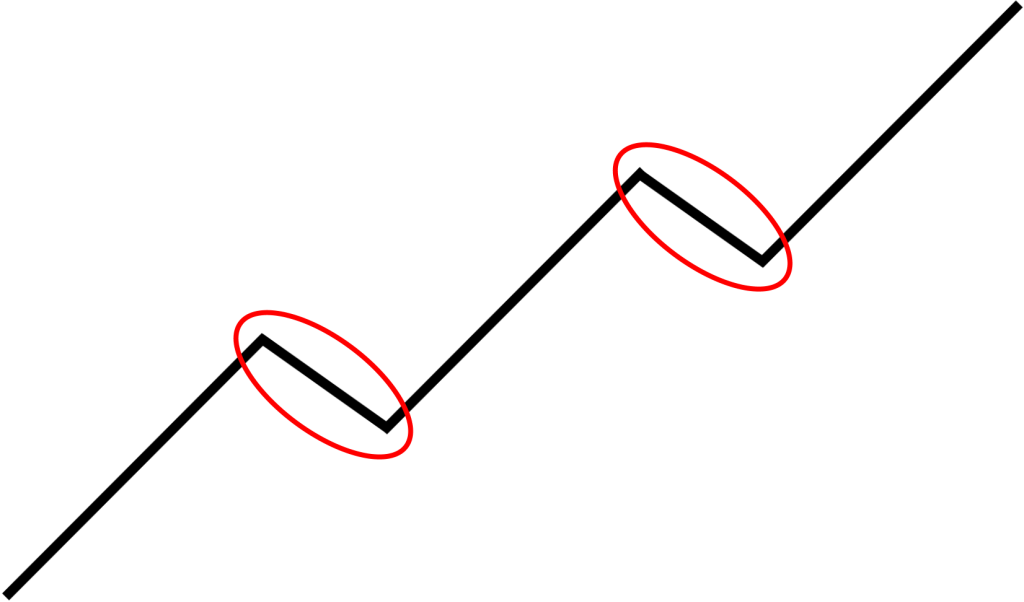
A pullback looks something like this:
If you have an uptrend, then the move that is against the underlying trend are known as pullbacks in the market.
Basically, if you're talking about trading pullbacks...
You're basically entering the trade as the market trades at a lower price in an uptrend.
So, the pros and cons of a pullback are this:
Pros
You're basically buying low and selling high.
If you are trading pullbacks in an uptrend, you're basically buying low.
And if you are selling pullback in a downtrend, you're basically selling high.
And the second thing about this is that it is actually easier on your psychology when you're trading pullbacks.
Reason being is that you're basically trading from an area of value.
Because buying low and selling high is something that we all are very accustomed to.
Because when we are going to the supermarket or we buy all this stuff, we always want to buy low and sell high.
Cons
And the downside of it is that you may miss the move.
Let me explain why...
For example, in an uptrend, it consists of higher highs and higher lows.
Let's say the price is pulling back right now.
And let's assume you are hoping that price could retest back to the lows.
What happens in the market is that the price doesn't pulls back deep enough.
And then it broke out higher without you, so it ended up causing you to miss the move.
This is the biggest downside in trading pullbacks, is that sometimes you may actually miss the move while waiting for the price to come to your desired level.
Where will the pullback end
Now, once you embrace the pros and cons of trading pullbacks...
The next question you probably have is, "Hey Rayner, where will the pullback end?"
So, I want to share with you three scenarios where I find that the pullback would usually end in either one of these three particular scenarios:
- It tends to respect support or resistance.
- It tends to respect a moving average.
- It tends to respect a trend line
Let me explain…
Pullback respecting support
We can see that this chart over here:
Doesn't matter what timeframe or what market this is.
This is pretty much a universal rule, a universal principle that you can apply.
So, you can see on this chart.
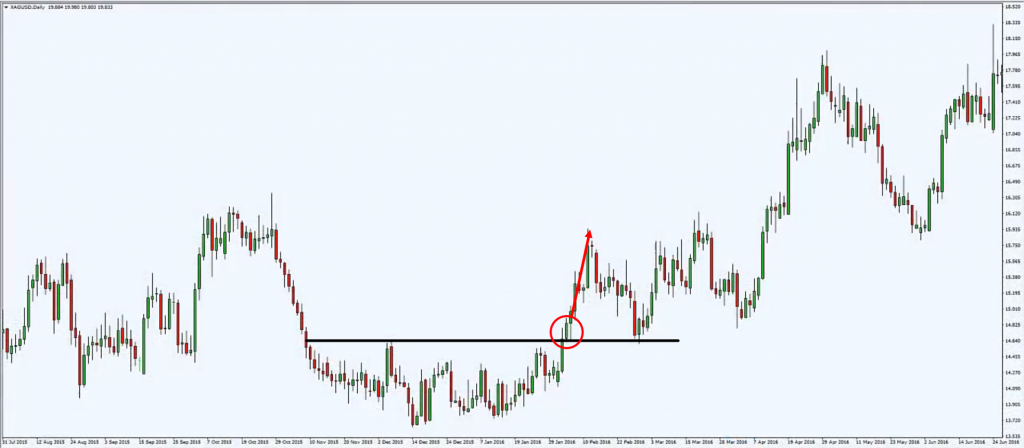
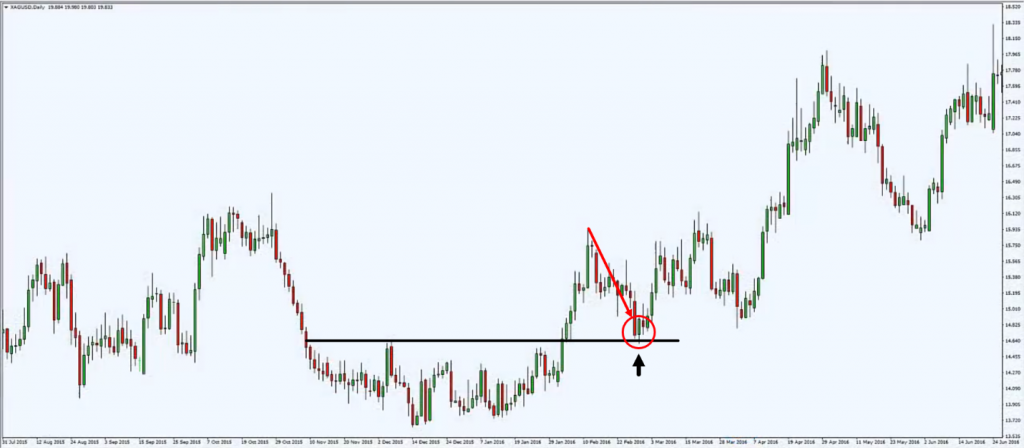
This there is an area of resistance, price broke out of it, and then it pulled back:
Where did it pull back into?
Previous resistance now turned support.
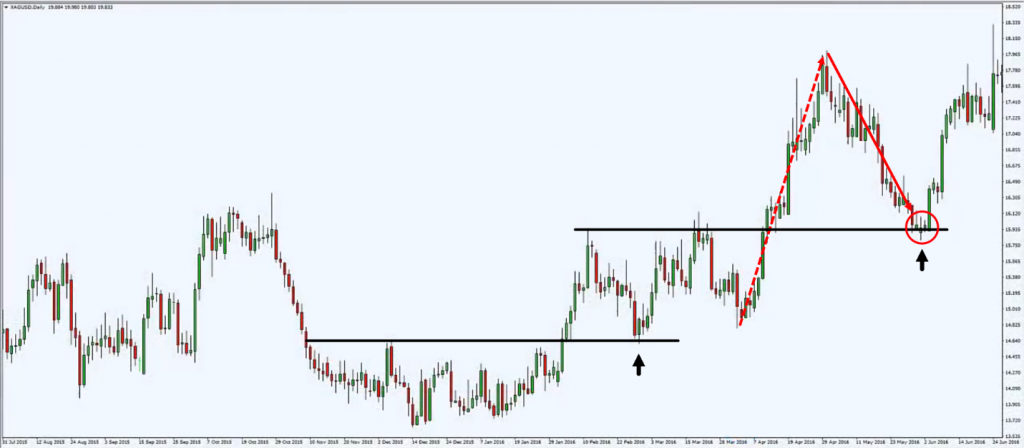
Then price rallied higher once more, and then it pulled back once again:
Where did it pull back into?
Previous resistance now turned support.
This is an example of price pulling back into an area of support in an uptrend.
And this is just vice versa for a downtrend.
Pullback respecting moving averages
The next thing that the market could potentially pull back into.
Is back towards the moving average.
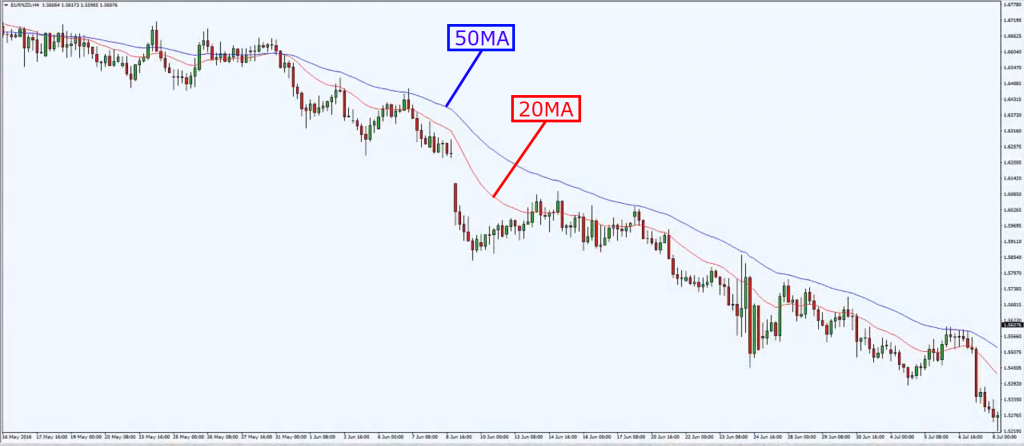
In this example:
The red line here is the 20-period moving average.
The blue line is the 50.
Price tends to pull back into the 20 and 50-period moving average.
Again, this is just a cherry-picked example, I'll admit.
Because there are times when the market will respect the 100-period moving average or the 200.
So, this is something that you probably have to be more proactive.
And to notice which moving average is more applicable in the current market condition or whether it's even applicable or not.
Moving on…
Pullback respecting a trend line
Another thing that a market would respect is a trend line.
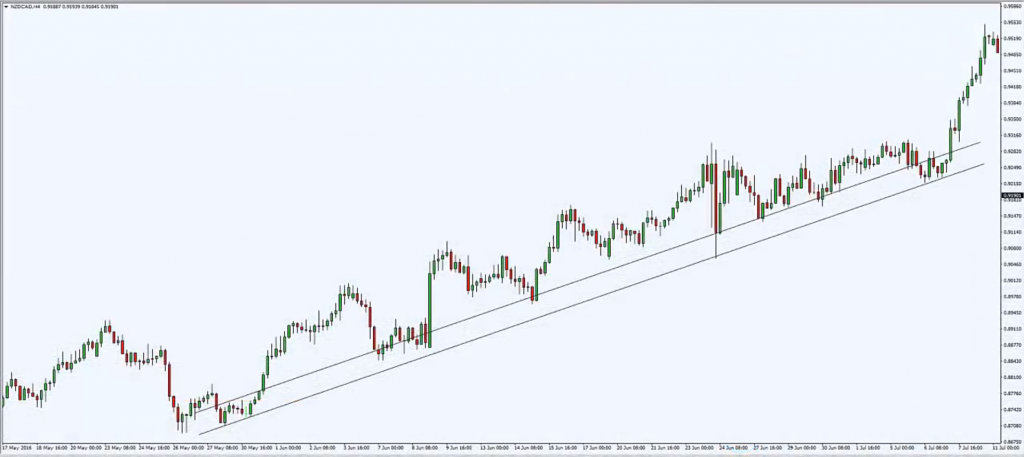
We can see over here:
Price trends higher come lower, and trends higher with respect to the trend line.
At this point, you have multiple touches.
The touch is something that you could actually pay attention to.
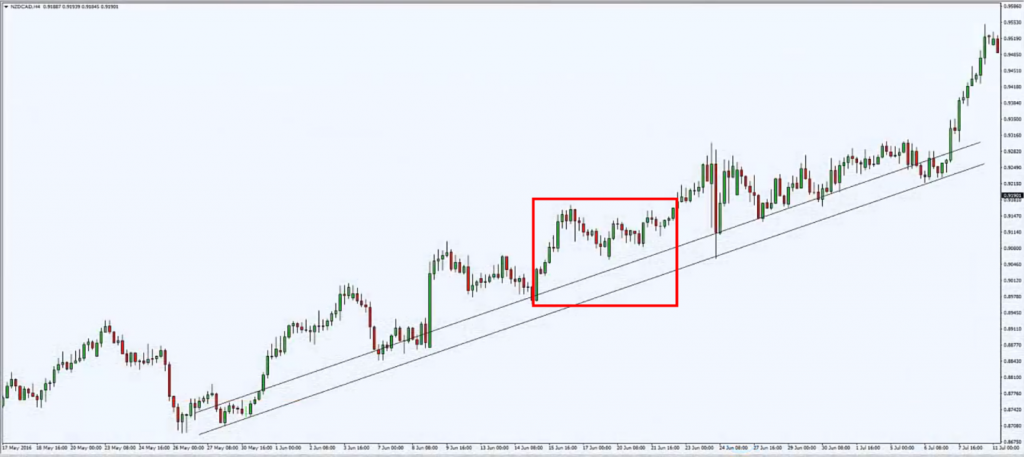
Recall earlier, the cons of trading pullbacks are that sometimes the market may trade without you.
This is one example:
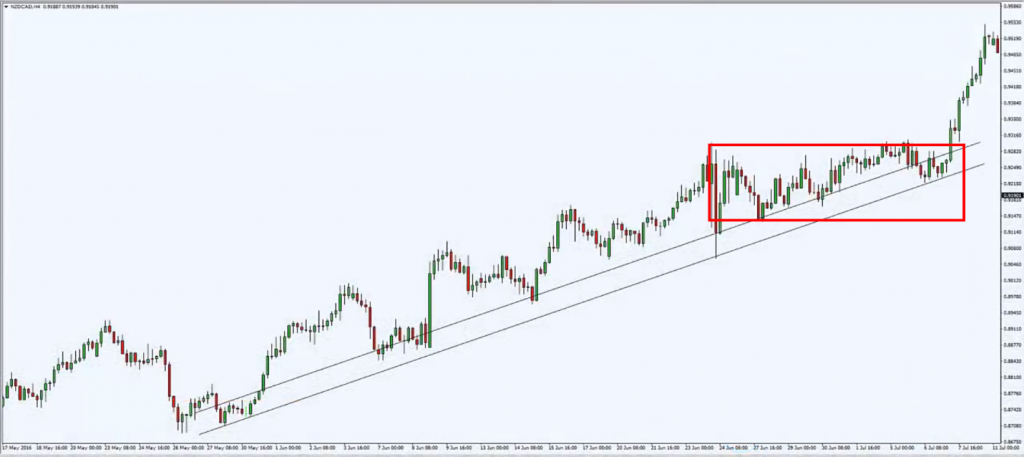
If you were to be waiting for the price to come towards the area of the trend line, you have missed this move higher, and then it comes back lower where it touches the trend line, trends higher, and then it trends lower.
And starts to hug the trend line all the way here:
And then it breaks out higher once again.
These are the three particular scenarios where the market tends to pull back into.
Now comes the important question…
How do you trade the pullback
There are, of course, many different ways to trade the pullback.
But I just want to share with you three very practical ways that you can consider trading pullbacks.
Because I find that these approaches very sound and logical to me:
- You can look for reversal candlestick patterns.
- You can look for a break of a trend line before you enter the trade.
- You can wait for a break of structure on the lower time frame.
Let me explain…
Reversal Candlestick Patterns
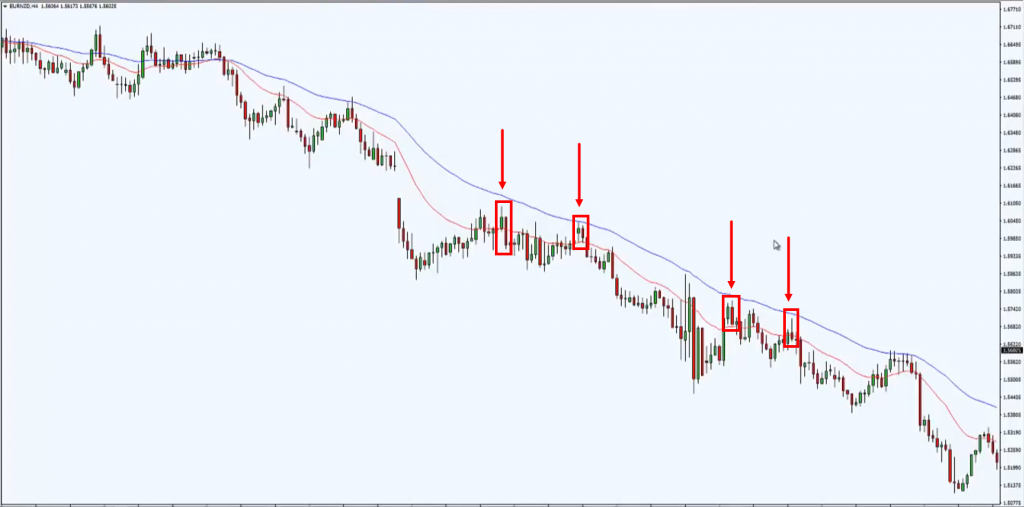
For example, take this chart as a reference:
The first way you can look to trade it is to use candlestick patterns.
If the price has pulled back to an area of value, an area where you think the market will reverse from.
You can start to look for reversal candlestick pattern before you enter a trade.
For example, you have a bearish engulfing pattern and price traded lower.
It's not really a very bearish candle, but nonetheless, it engulfs the body of the previous candle.
Then, you have another bearish engulfing.
A bearish pin bar, and another bearish engulfing candle.
Mind you, this is obviously a cherry-picked chart.
I cherry picked this chart, not to show you that this method is the best, but rather is to illustrate my point.
Because if you have a well-picked chart, it is much easier to illustrate the point I'm trying to put across.
But I hope you understand that there's no such thing as a 100%-win rate in trading.
There will be winners and losers no matter what your trading strategy is.
So, don't be mislead about the current chart that I'm showed with you recently.
The reason why it seems to work really well is that we are in a clear downtrend.
When you have a very clear downtrend, you realize that no matter what entries you use, chances are is that it's going to make you money as well.
With that said, the following in the example is the candlestick entry that you can consider.
Moving on…
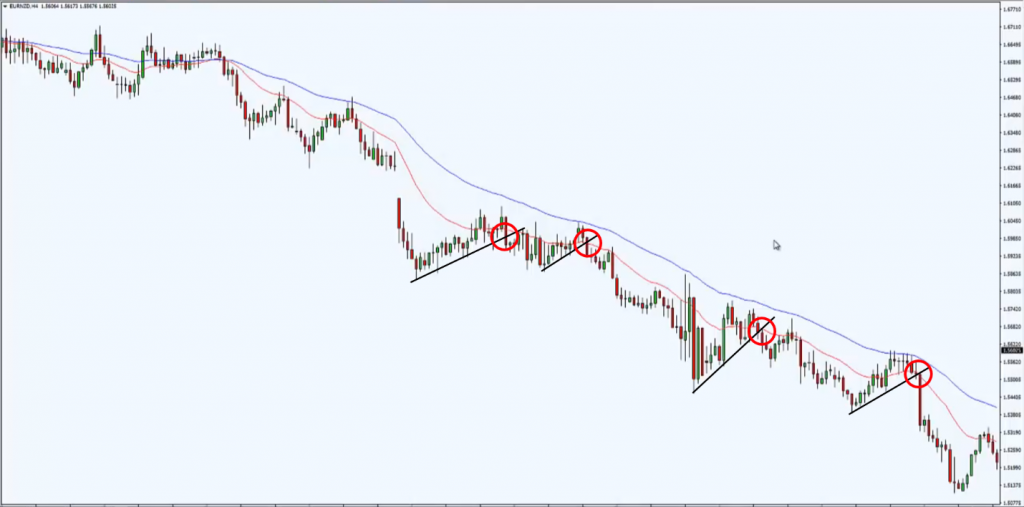
Break of Trend line
As you can see here, you look for a break of trend line:
When price breaks the trend line, you can short.
Again, it works, right?
I hope you get my point that I'm just trying to illustrate to you the different ways that you could consider entering on a pullback.
But don't be misled by thinking that this is such a very high win rate strategy.
It's definitely not the truth, and it's something that you have to be prepared for.
You have to be prepared for losses no matter what approach you use.
Okay?
For this, the trend line example, how you go about trading it is when price breaks and closes below the trend line, you can look to go short in this market.
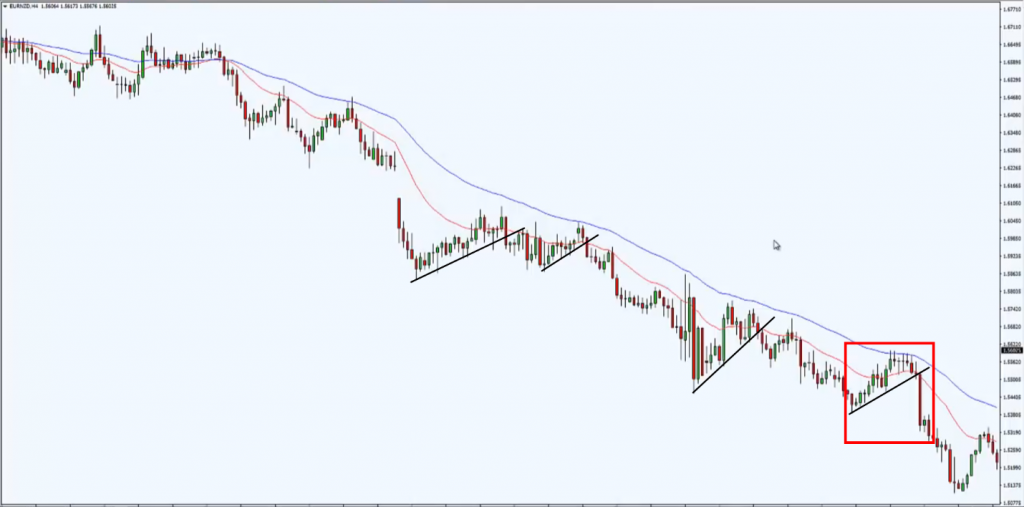
But for this over here:
If you look at the strong bearish close, you probably wouldn’t go short at a very low level.
This is a trade that you possibly want to consider skipping altogether.
The last thing I want to share with you is what is called…
Break of structure on the lower time frame
Let me explain this…
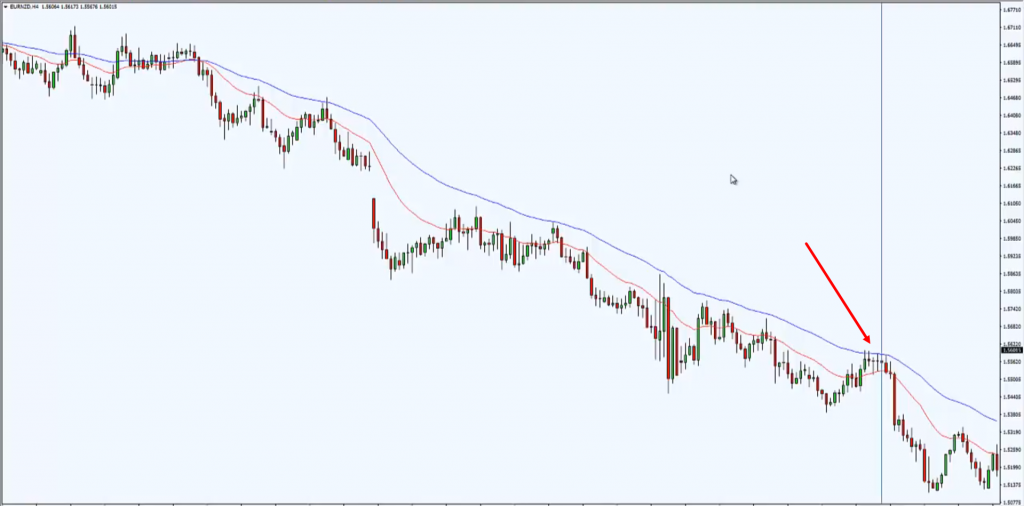
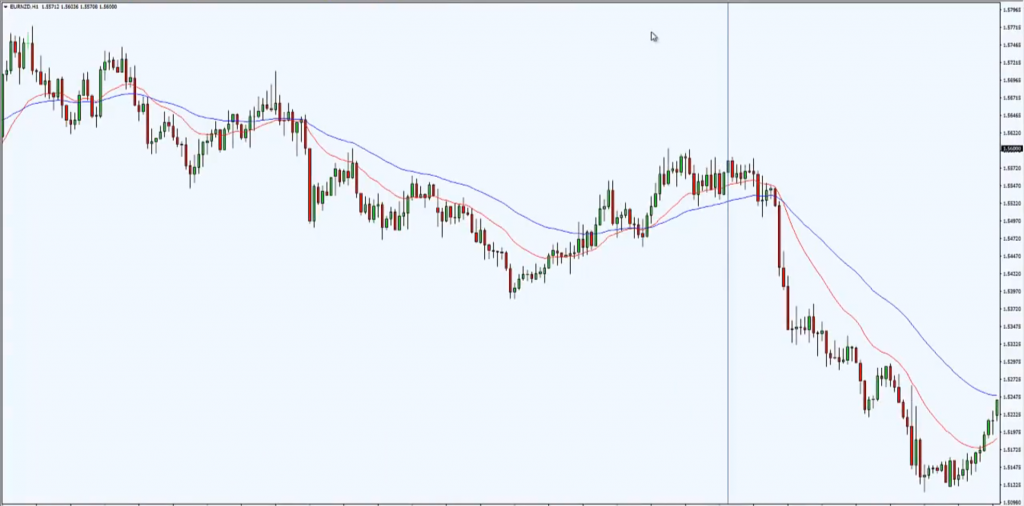
For example, a price has come into this area of value in the 4-hour time frame:
What you can do is to go down to a lower time frame, like the 1-hour time frame.
And wait for a break of structure to signal to you that the trend is about to go back into its original direction.
Let me show you:
This is the same portion we saw earlier in the 4-hour chart.
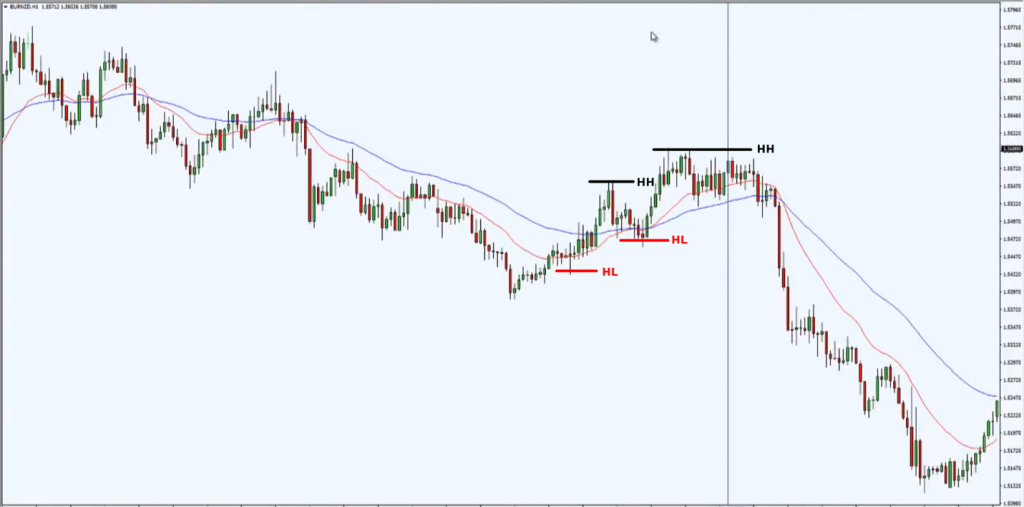
How you go about doing it is you start to observe the structure of this market.
You notice that the retracement consists of higher highs and higher lows:
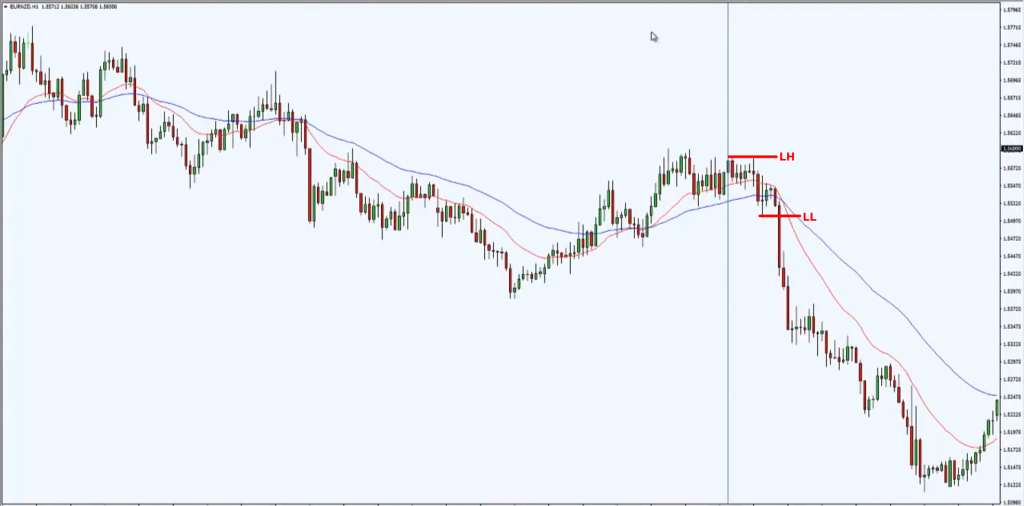
At this point, things start to change based on the structure of the market.
Notice that you have a lower high and a lower low:
Once you have a lower low and a lower high, it's telling you possibly that this retracement is coming near towards its end.
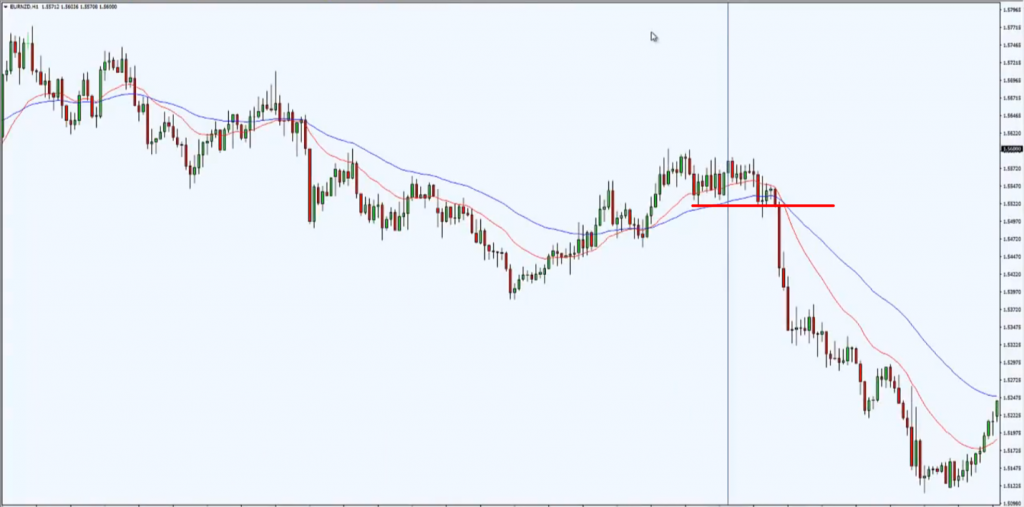
You can look to go short in this market when price breaks below the support over here:
This is what I mean by a break of structure on the lower time frame.
These are basically the three different ways, three different methods that you can use to enter on a pullback.
Now…
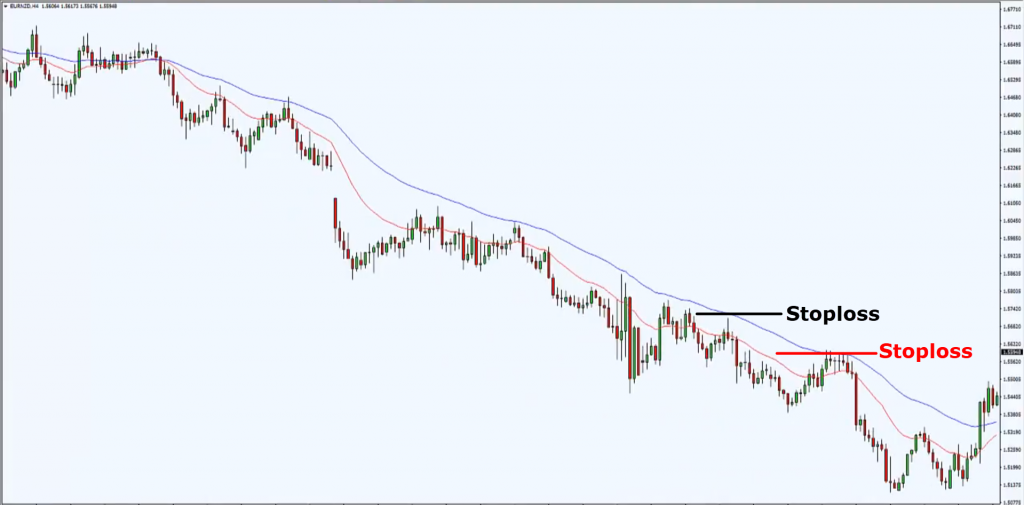
My next question is, "Rayner, what about stop losses? How do you actually manage your stop losses?"
The most logical area to set your stop loss is above the swing highs on a downtrend:
Since this is a downtrend, above the swing high would be a logical approach (red).
If you want to be more conservative, you can actually use the previous swing high as well (black).
This is something that is personal.
It really depends on your own personality and your attitude towards risk itself.
With that, I pretty much just want to give you a heads up into the things to look out for when you're trading the pullback.
And what are the options that you have as well when you are trading pullbacks.
Just to recap to what you have learned in today's video…
Recap
- What is a pullback and the pros and cons of trading pullbacks.
- Where will the pullback potentially end. Either support or resistance, support in an uptrend, resistance in a downtrend, or back towards a moving average or back towards the trendline.
- How you can trade pullback. It can be candlestick patterns, the break of the trend line, and the break of the structure on the lower time frame.
- Where you could put your stop loss. You could either put your stop loss above the current swing high or at the previous swing high.
This is basically how you could actually go about trading pullbacks.
It's not an exact trading strategy for you to use, but it's to give you all the different possibilities or the important stuff that you need to consider before you want to trade pullback.
I hope this really gives you a good insight into how you can actually trade pullback in your trading career.
So, with that, I've come to the end of today's video.
If you've enjoyed it, feel free to hit the subscribe button below so you always stay updated.
And lastly, if you have any questions or feedback, feel free to let me know in the comment section below.
With that, I wish you good luck and good trading. Talk to you soon.

