#7: Support and Resistance Secrets
Lesson 7
So…
Support and resistance are one of the most important technical trading concepts that you'll learn.
Okay?
But here's the thing…
Most traders get it wrong, flat out wrong!
They can't even draw their levels correctly.
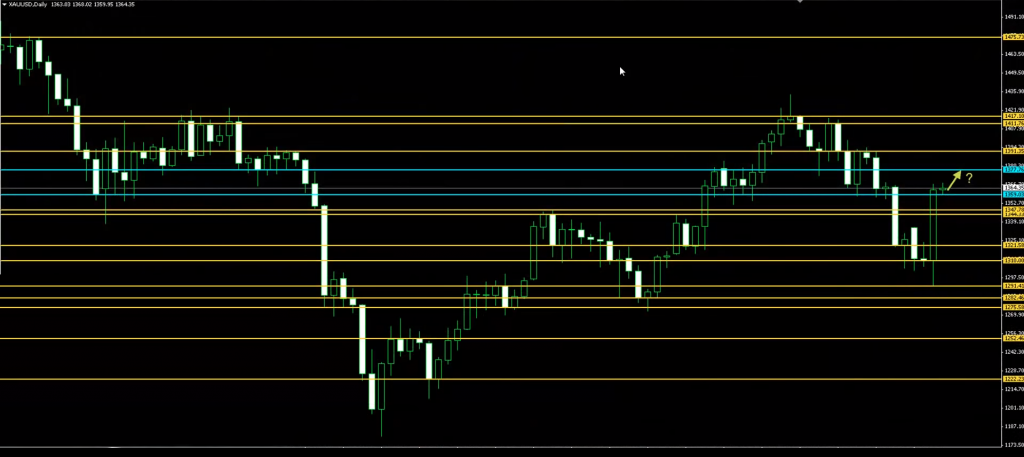
For example, this is a chart that I've seen people posting:
And if you look at this…
There's just way too many levels, right?
Where do you want to buy?
Where do you want to sell?
Can you see that if you have too many levels on your chart, it will clutter your mind?
You will have analysis paralysis in your trading and it's hard to make trading decisions.
That's why in today's video I'll share with you three things.
Number one…
How to draw support and resistance the correct way
Once you master this…
You'll never look at support and resistance the same way again, and trust me...
What you're about to learn is what other trading courses would charge you thousands of dollars for.
And I'm going to share it with you for free.
Number two, you will learn…
When to trade off the reversal at support and resistance
Meaning, when you will know if the price will likely hold at support and resistance or not.
That's number two.
And finally, number three.
You will also know…
When support and resistance is likely to break
This is so you don't get caught on the wrong side of the move.
So, you'll learn all this and more in today's post.
But before we begin, hit the thumbs up button and subscribe to my YouTube channel so that you will never miss another training video again.
Have you done it?
Then let's get started.
The first thing that I want to share with you is…
How to draw support and resistance the correct way
This is very, very important to pay attention to.
How I do it is that I use these three simple steps that I'm about to share with you:
- You want to zoom out your charts. You want to see the big picture, once you can see the big picture it's much more obvious to your eyes which key levels you should be paying attention to.
- You want to draw the most obvious level. If the level sticks out, that level matters, if you're squinting your eyes asking if it is a level or not? Then ignore it.
- You want to adjust your level to get the greatest number of touches.
Let me explain…
Zoom out your charts
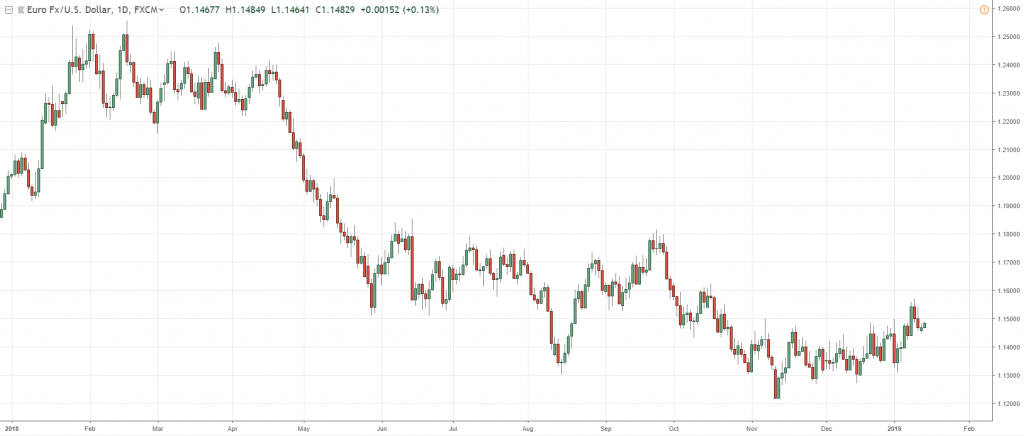
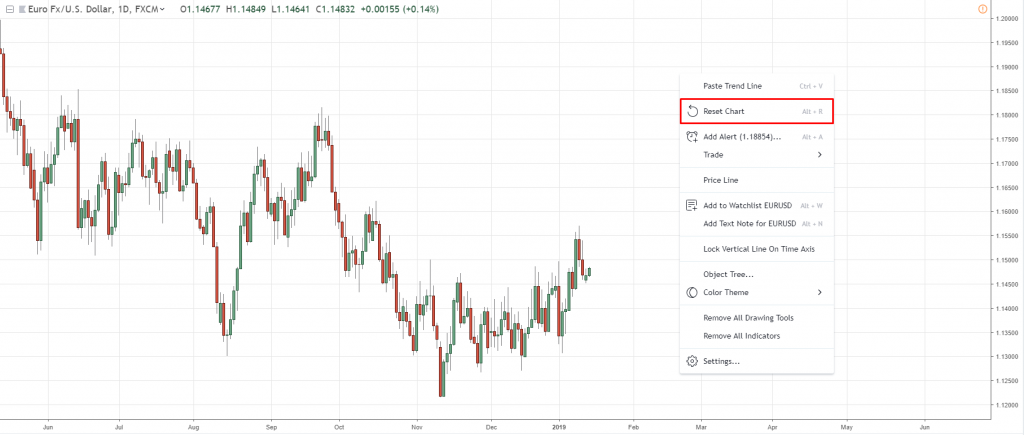
Over here, this is a typical trading view chart:
Just right-click, reset chart, and everything is back to default view:
So, how do you zoom out your charts?
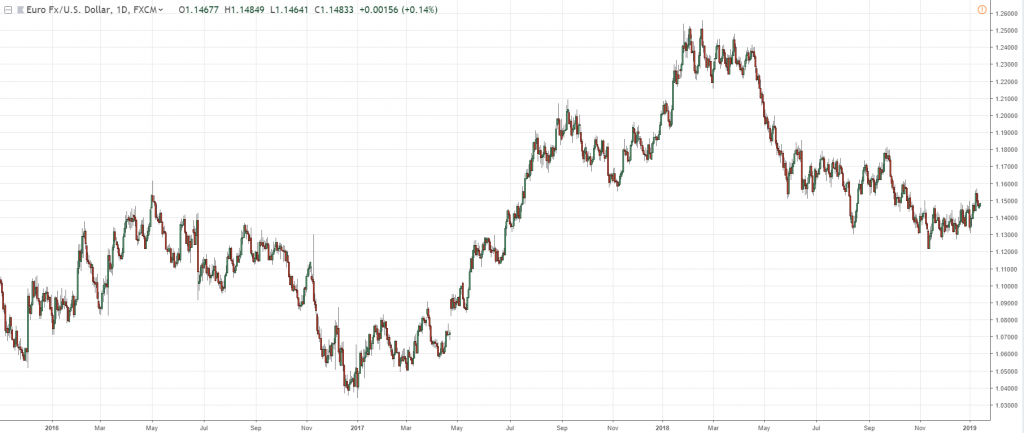
I typically like to zoom out 5 to 10 times.
You can use your mouse that has a scroll button.
You scroll it down about 10 times:
That's the first thing, zoom out your charts.
The second thing is to…
Draw the most obvious level
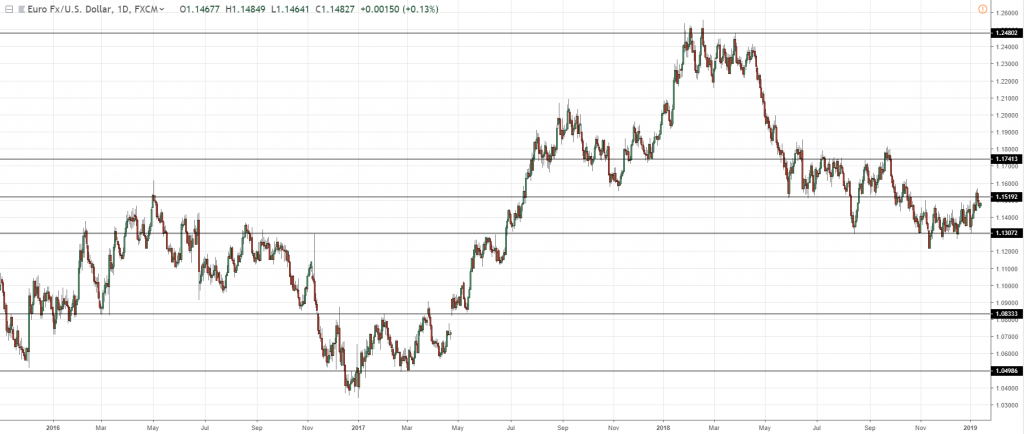
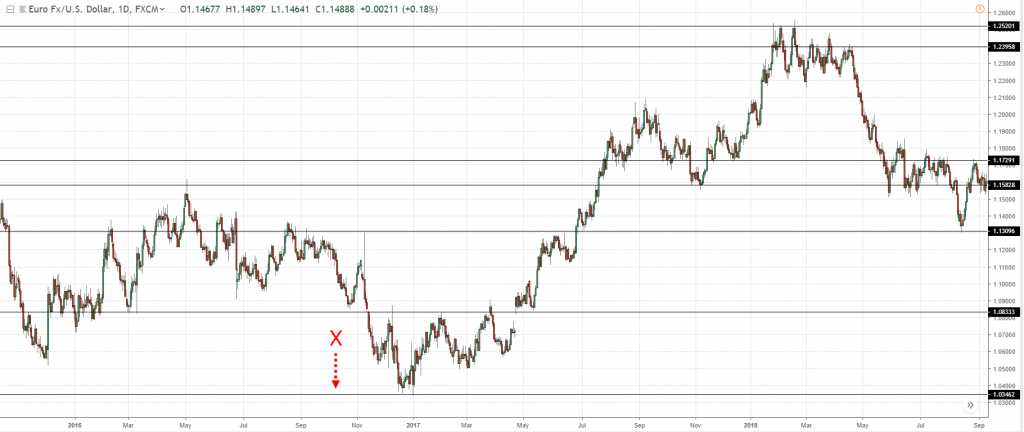
From the looks of this, I can see that these are the very obvious levels to my own naked eye:
Okay?
I can plot it pretty quickly, there's no need to ask yourself or second guess.
Because if it's there, it's there.
If it's not there, don't waste your time.
So, I've done the second part, draw the most obvious levels.
And the third thing is to…
Adjust your levels to get the greatest number of touches
What this means is that you want to shift your support or resistance where the price hits the level the greatest number of times.
For example, let's look at this:
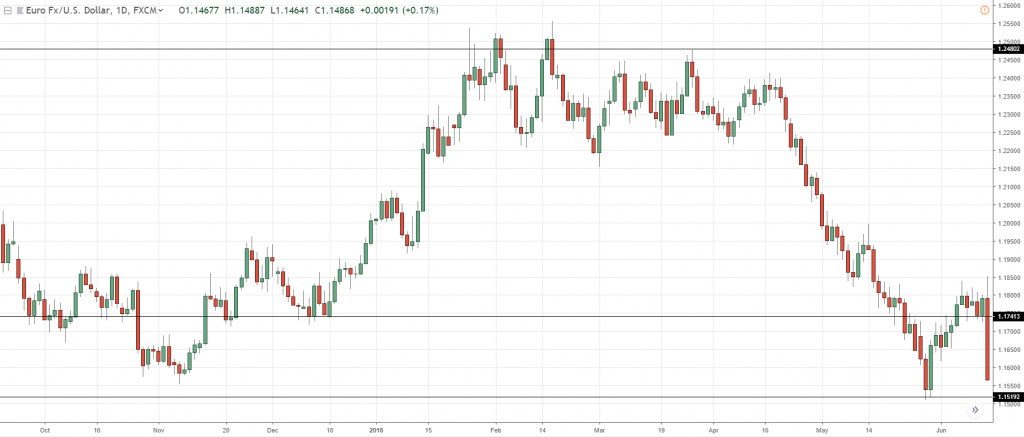
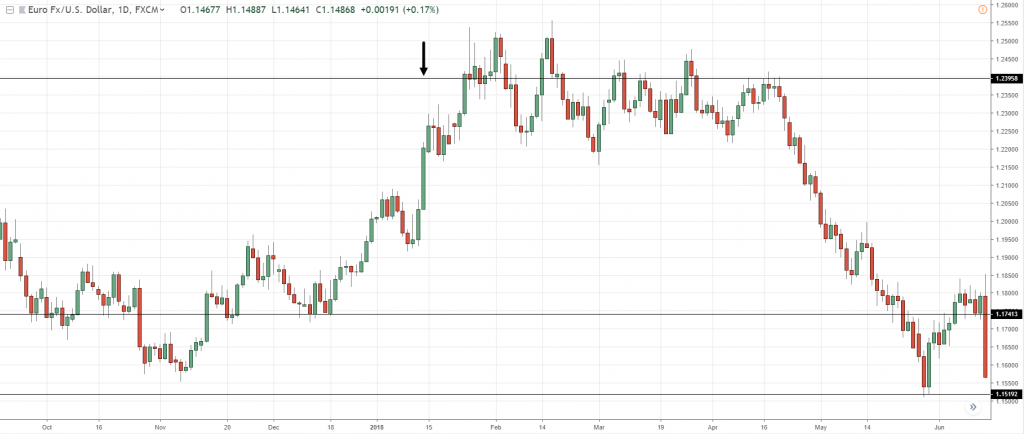
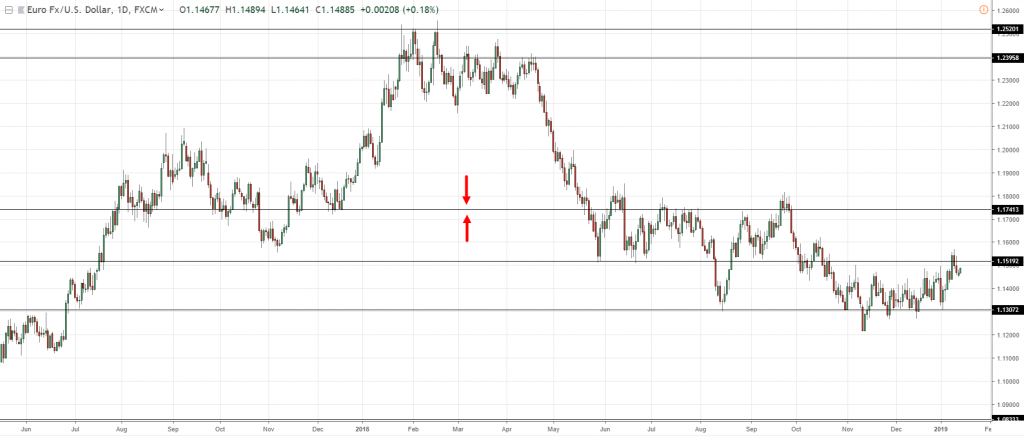
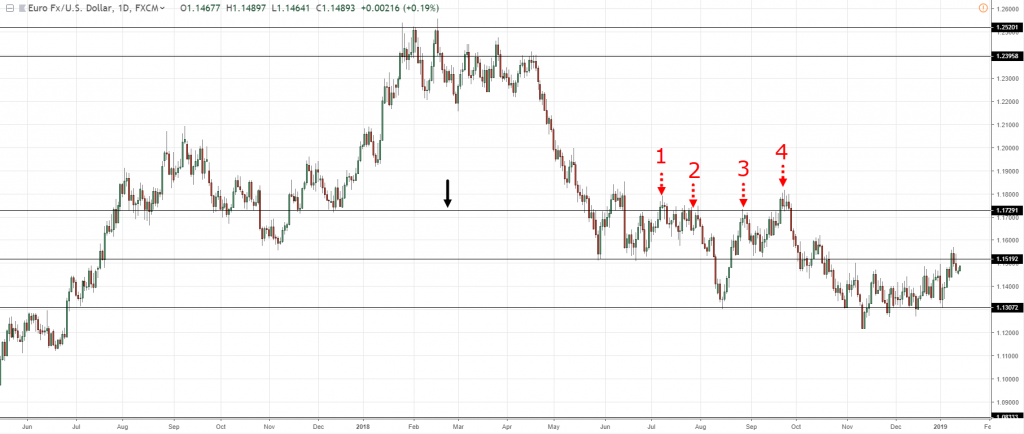
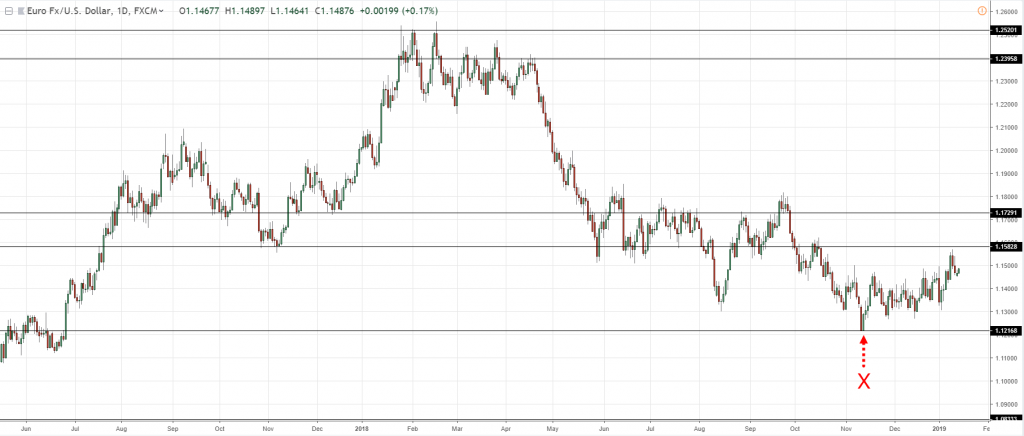
For the level on the top, I could actually draw it at the absolute highs.
But I don't want to, because remember...
I said that I wanted the level to touch the greatest number of prices.
If I were to shift it down lower somewhere here:
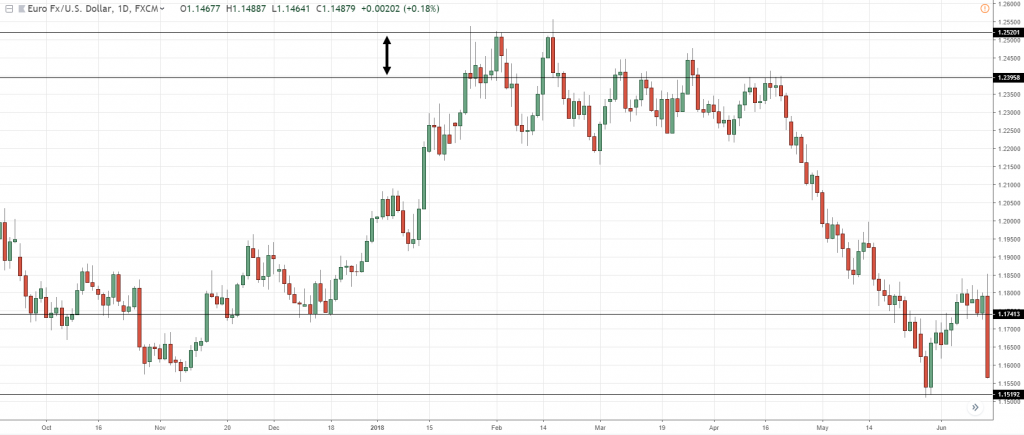
Notice that I can get more numbers of touches.
Some candlesticks exceed the level quite a bit.
But, you have three touches.
If I want to, I can actually draw another level over here:
Okay?
Now I can see that your resistance looks somewhat like an area at the point on the example.
Let’s continue…
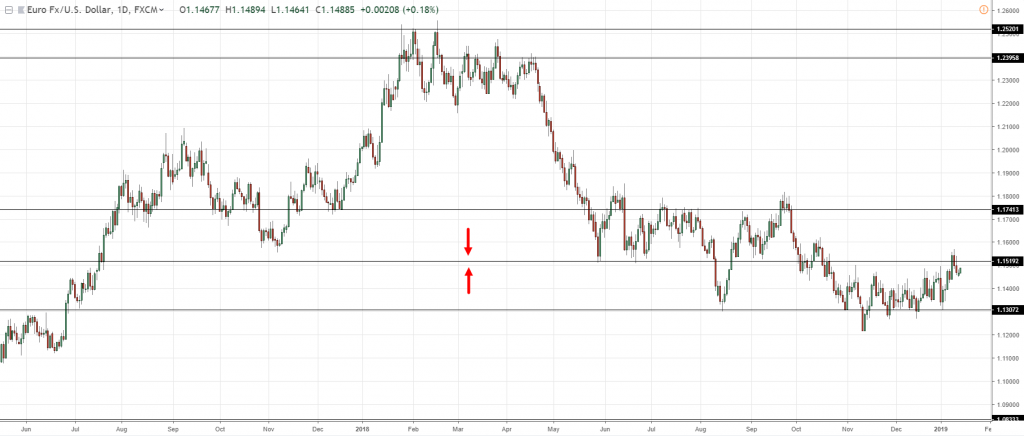
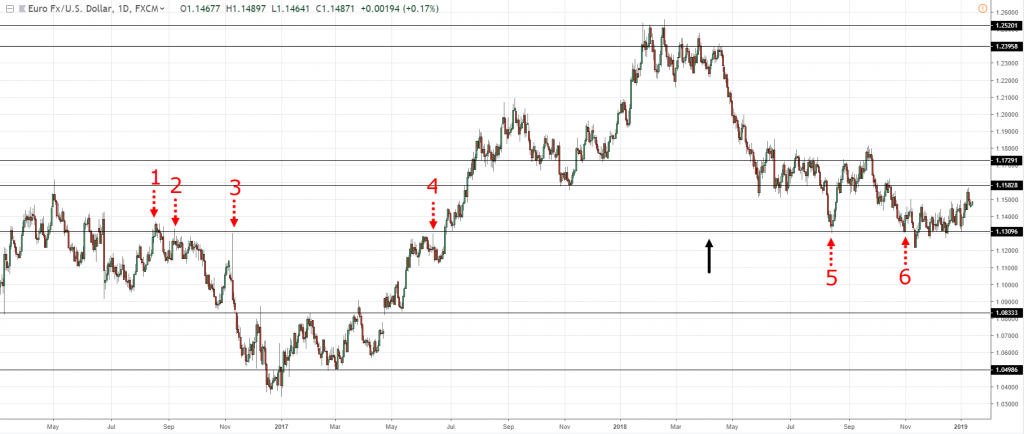
I want to adjust this one:
I can just adjust it slightly lower so that I can get 4 touches:
One price action on the left exceeds by quite a bit.
I can draw another level if I wish to, but I want to keep my charts clean.
So, I'm just going to use one level.
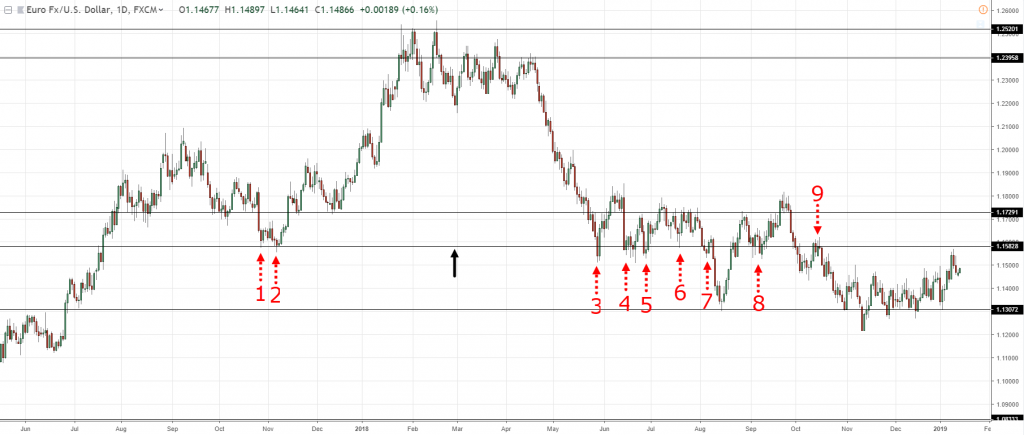
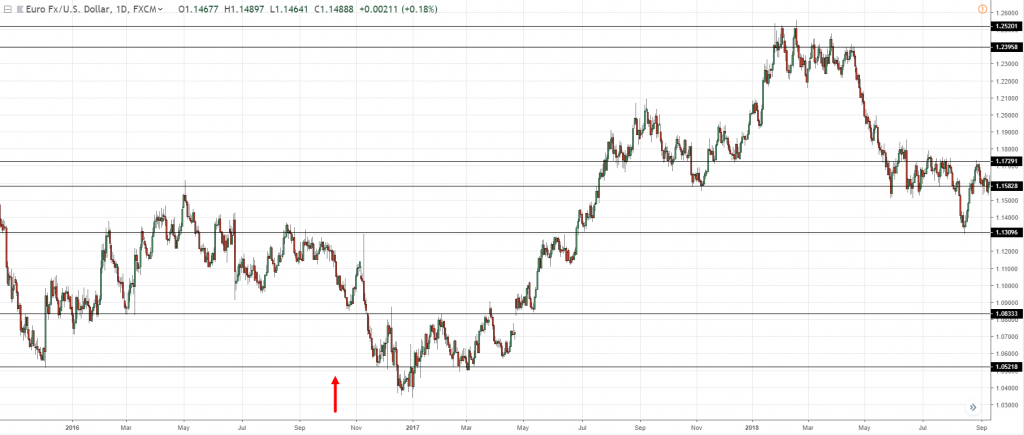
This one over here:
If I just adjust it slightly higher:
Notice that I got nine touches.
Quite a number of touches, right?
We can see that this is how I adjusted it to let the price touch the greatest number of times.
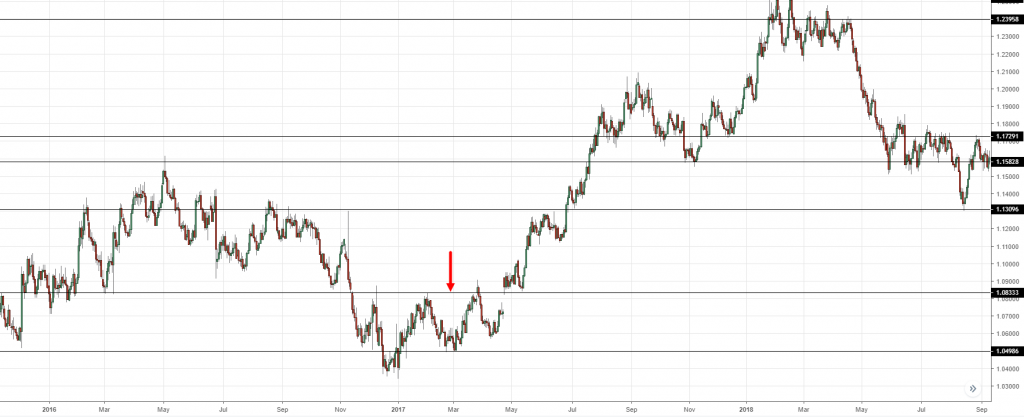
Same for this:
I don't want my level it to be drawn at the extreme low.
I want to get as many touches as possible, to get the price action involved at the level I'm drawing.
So, if I'm going to shift it up slightly higher and looking back, I get six touches:
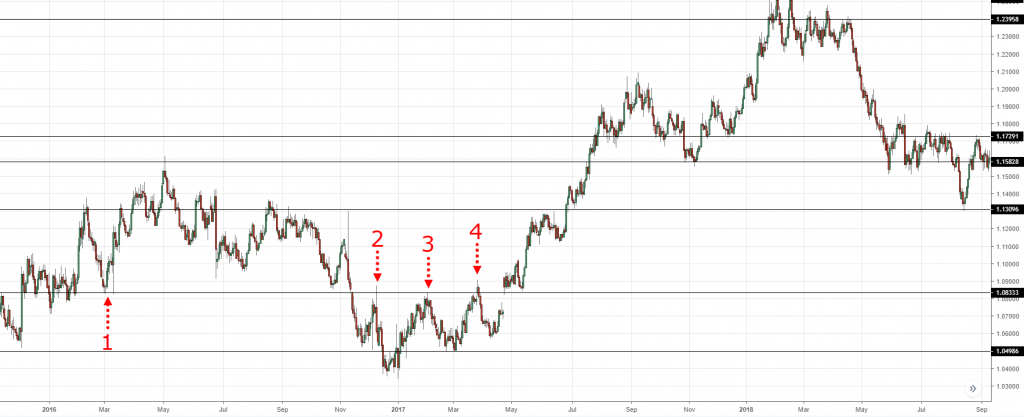
Again, same thing for this one:
Adjust it to get the greatest number of touches and I would look to the left:
Here, we have four touches behind.
Same for this one over here:
I don't want to draw at the extreme low, so I push it up slightly higher:
From the looks of it, you can see that right now, the levels of my chart look much cleaner.
And with one look at it, you know which are the key levels that you want to pay attention to and that you want to trade from.
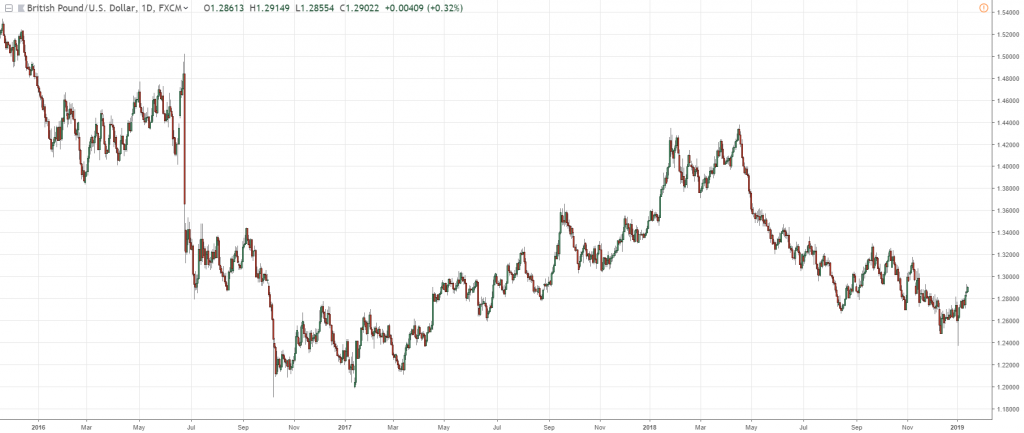
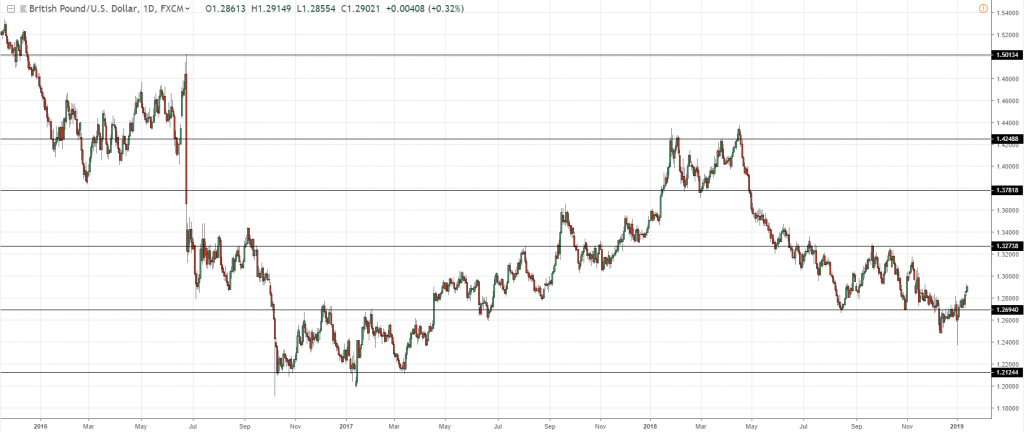
Another example is GBP/USD.
Let's just reset the chart once again and do the three steps I just mentioned.
The first step is to zoom out your chart 10 times to keep it consistent:
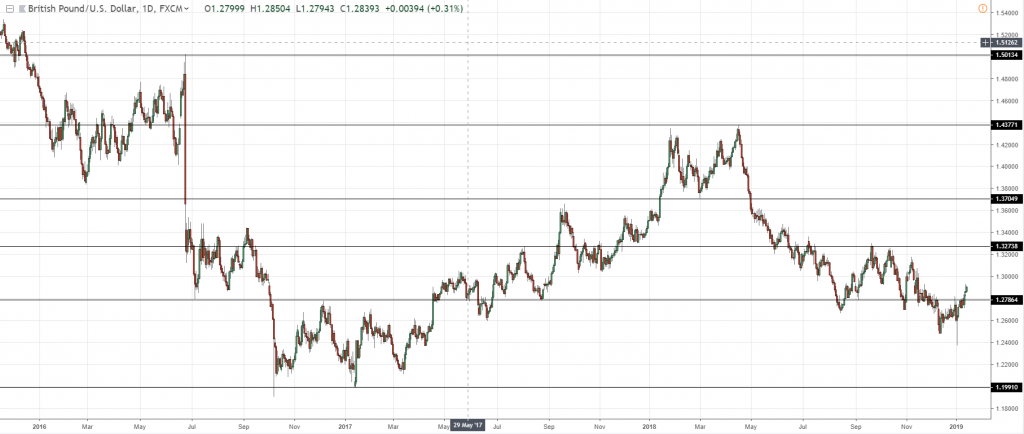
And step number two, draw the most obvious levels:
Okay?
I've already drawn out the most obvious levels.
Again, notice that I didn't spend time wondering, “is this a level? is this not a level?”
None of that!
So now, it’s time to adjust:
That's pretty much it on how to draw your support and resistance levels.
As I said, this is so, so, so important, right?
Go and apply it, draw the levels and trust me…
You'll see the markets in a different light.
It's like taking the red pill or blue pill.
You take the blue pill, right? That's it, you're out of the matrix, you see the markets in a different light.
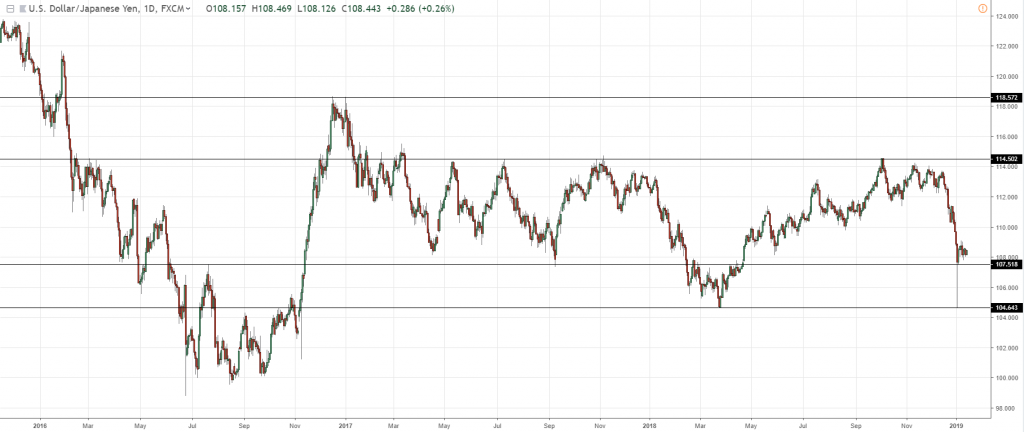
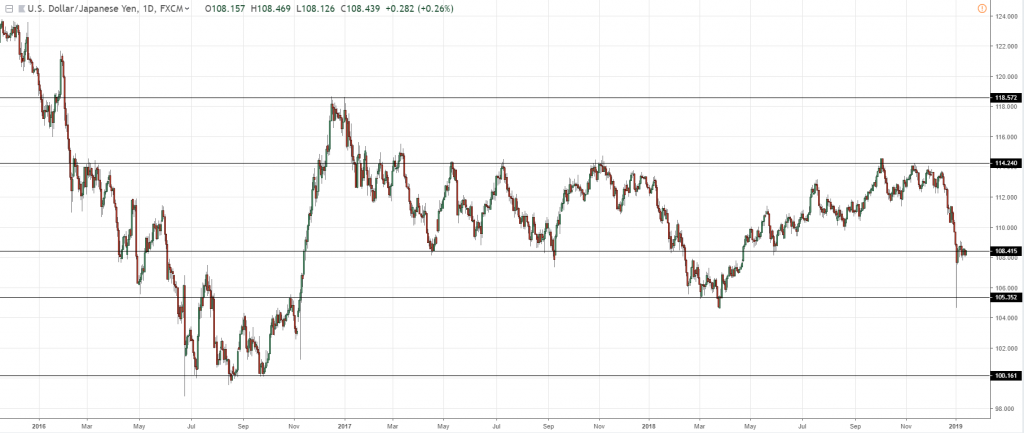
So, USDJPY, same concept:
Zoom out and draw the most obvious levels very quickly, and draw the most obvious levels.
If it's there, it's there.
If it isn't, move on.
So, time for the adjustment:
That's how I would draw my levels for USD/JPY.
And there you have it, right?
How to draw support and resistance.
Okay?
With that said, let's move on, shall we?
Now that you have learned how to draw support resistance, the next question is…
How do you tell when the price will reverse at support or resistance
How do you know the level will hold?
That's the question, right?
So, I want to share with you a few tips to bear in mind.
The first thing is that you want to see a power move into market structure.
What this means is that if you have drawn your area of support or resistance, you want to see a strong move into the level!
Big or large-bodied candles.
That's what I mean by a power move, a very strong momentum move!
Number two, you want to see strong price rejection.
This can be in the form of a shooting star!
Where you see a long wick and price gets rejected.
Let's say this is resistance, the price comes in, and then bam! gets rejected:
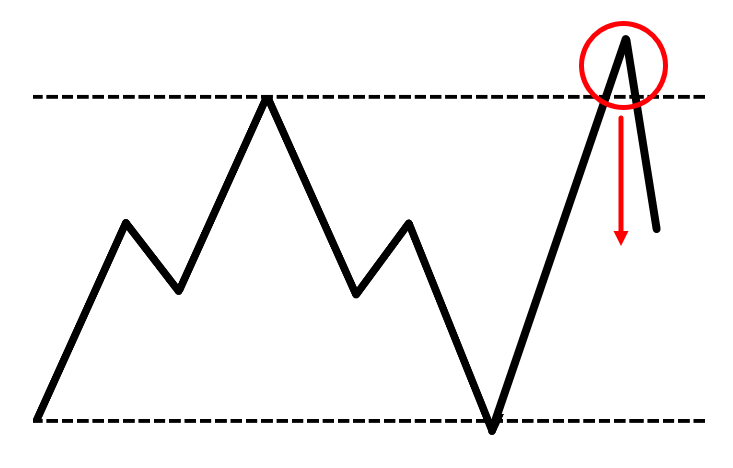
The stronger the rejection, the better.
That's what you want to see.
The third thing is that the larger the candles are, the better.
You want to see a strong momentum move, power move!
And another thing is that the longer the time that the price is away from the market structure or support resistance the better.
Let me explain first why you want to see large bodied candles into a level.
Let’s say that when you look at resistance, and when you have a strong move coming into that level…
At this point, ask yourself where will you want to go short:
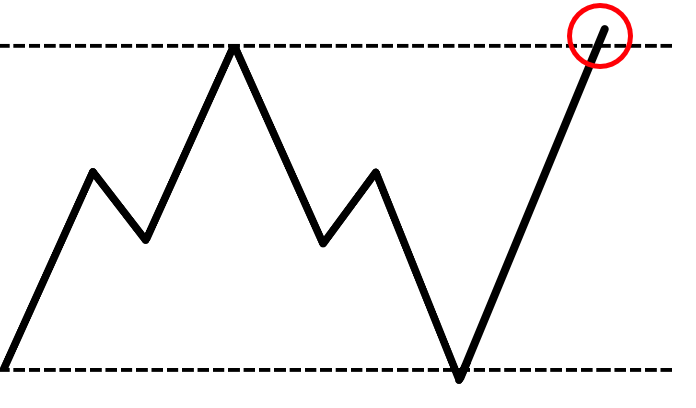
Because there is definitely an opposing pressure, buyers who want to come in and buy at good prices.
Where is a good price that buyers would come in?
Well, if you look at this chart, chances are that buyers might cue in this area of support:
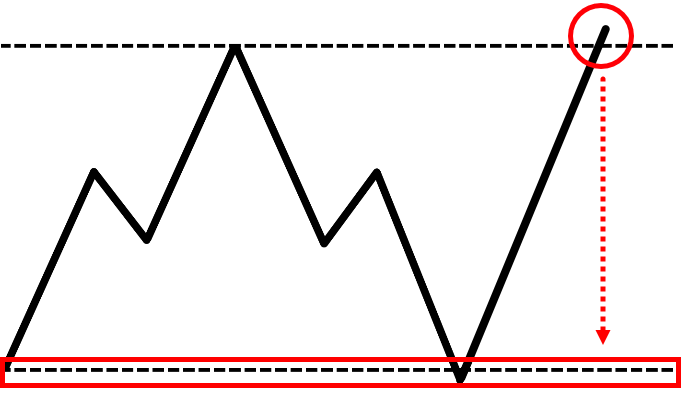
Because there is an obvious market structure where they can wait for the price to retest and go Long!
However, if you didn't get a power move, you didn't get a clean move.
Instead, you get a very choppy move like this:

Now ask yourself…
If you're going short on the resistance.
Where would the opposing pressure come in?
Well, this time around bias could potentially be at these swing lows:
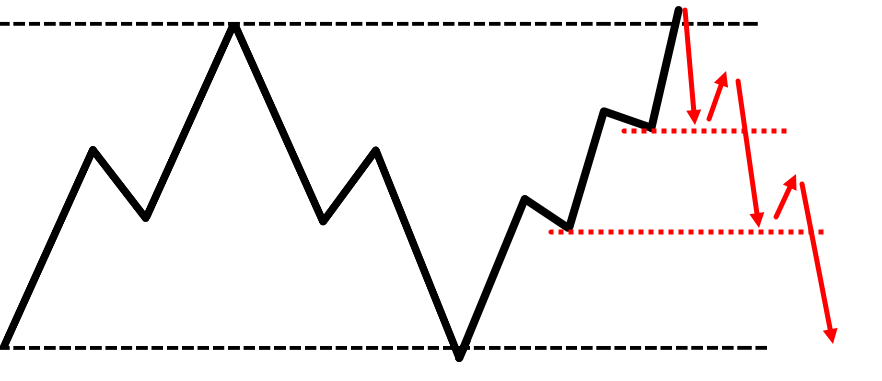
What this means for you as a trader who is looking to short is that, as the price comes down lower into these levels…
You will face opposing pressure that could turn the tide against you!
That's why you don't want to go short when there is this type of stair stepping price action into your level.
Because all these minor swing low levels are where opposing pressure could come in and push the price against your trade.
Another reason why you want to see large candles or larger momentum candles or what I call a power move is very simple.
When a price comes in like this, it is a very strong move just a strong bull move:
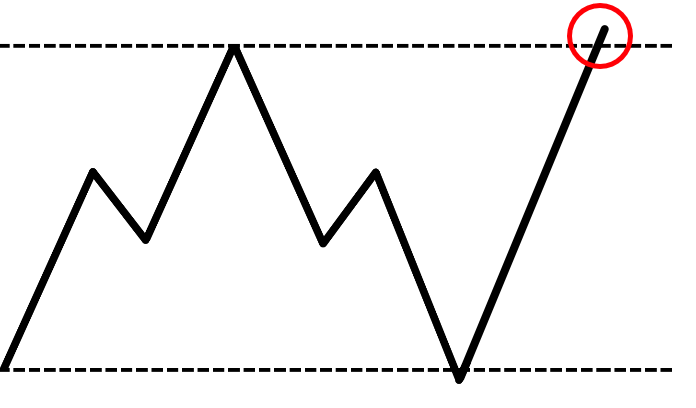
Often, traders will just look to buy the breakouts.
I'm sure you've probably done it yourself, right?
When there is a strong momentum move you might be thinking, "Oh, let's buy the breakout, the market is rallying, right? Let's buy!"
Then where will you put your stop loss?
Chances are you put it under the resistance, maybe in the middle of the range, somewhere lower in the range, or even below this area of support:
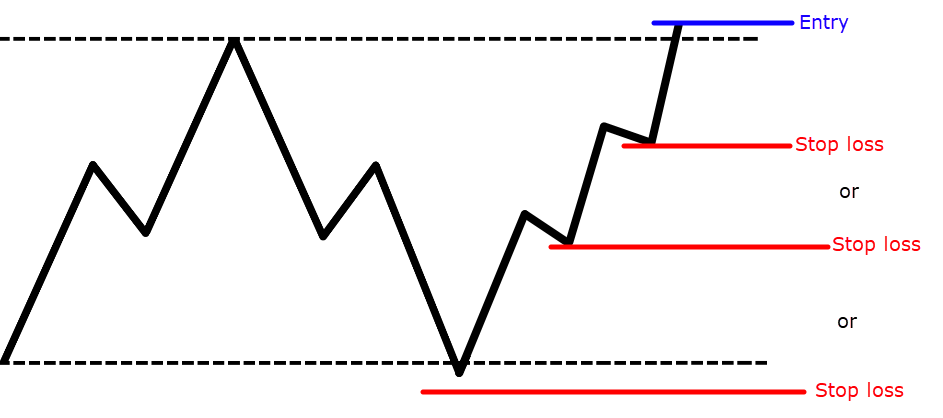
What this means is that if the breakout fails, it's going to hit all these clusters of stop-loss orders over here:
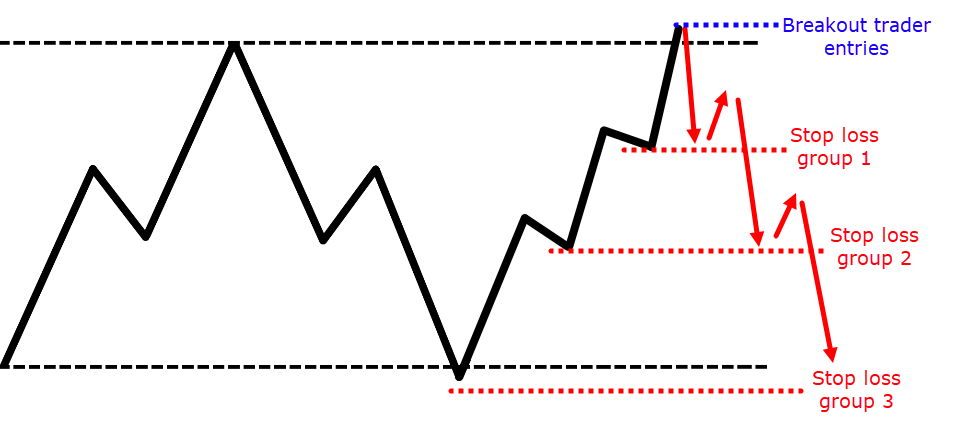
And if you think about this, what are these clusters of stop-loss orders?
They are simply orders to exit the market from the Breakout traders who are long!
This means that these are actually sell stop orders, which would induce further selling pressure.
The more bullish or the more you get a power move into market structure.
The more breakout traders will hop on board and get on the move!
The more buyers hop on board, the stronger the reversal will be.
Because when it reverses back towards the downside, you’ll know that it hits the sell stop orders of the breakout traders.
This is why you want to see larger candles into the market structure or a power move into market structure.
Don't worry, I'll share with you an example later.
And finally, the longer the time away the better.
Why is that?
Simple, right?
The Longer the price is away from a level, the more it would attract attention from the higher timeframe traders
For example, if the price has not retested the $100 price level on the daily timeframe for the last six months or one year...
You can be sure that that level can also be seen on the weekly time, or even the monthly timeframe.
And this will actually attract more traders from the higher timeframe to pay attention to that level.
And that's why you can get a stronger so-called "price rejection," or a reversal at that level when there has been a long time away from the level.
Alright?
I know I've covered a lot of theory here, so let's have a look at the examples, shall we?
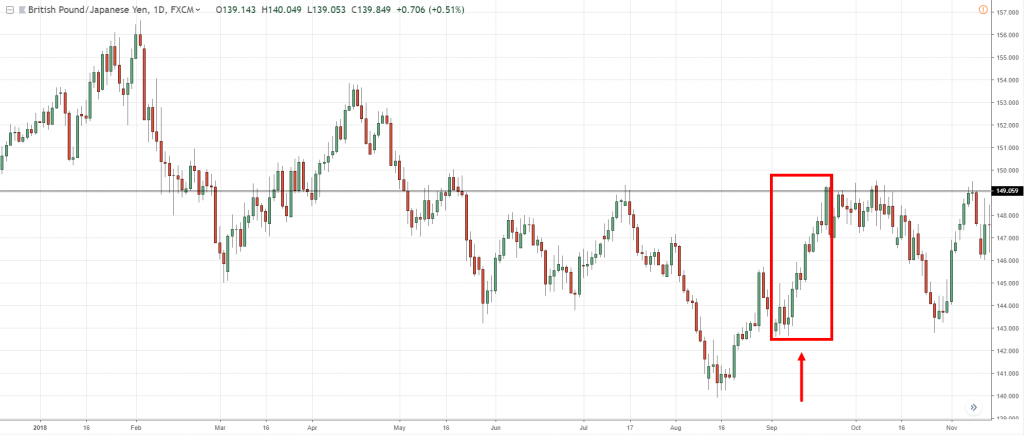
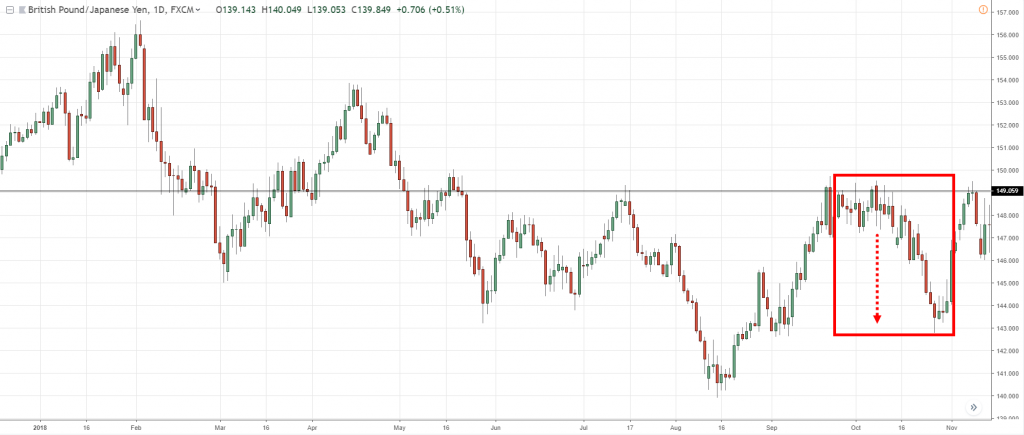
So, let's see GBP/JPY, where it shows what I call a power move, a very strong momentum coming into a level:
No doubt this took a while for it to reverse, but eventually, it did reverse towards the downside:
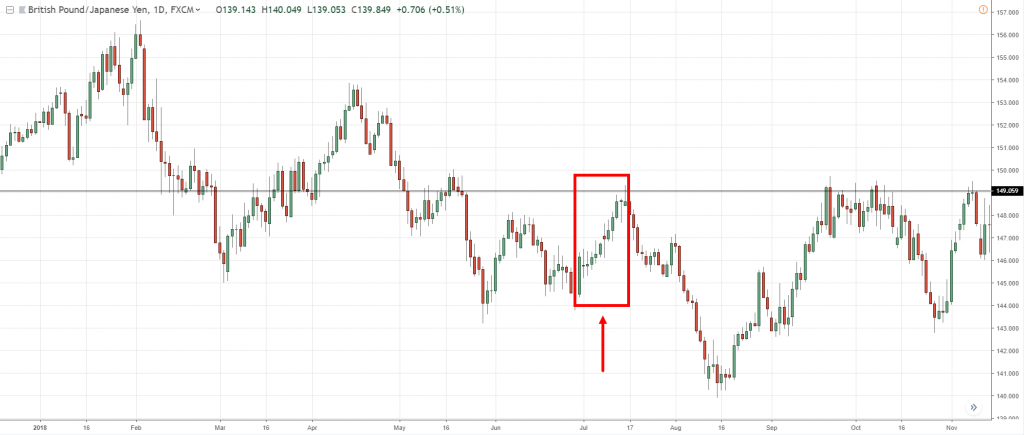
You can also see that strong power moves into a level here as well:
Notice that the candles are all bullish in one direction into resistance and then the market reverses!
Let me share with you a few more examples…
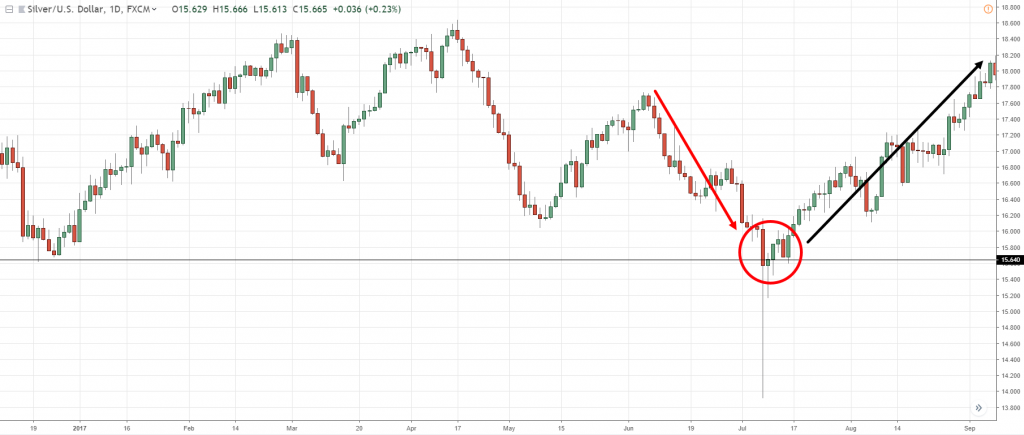
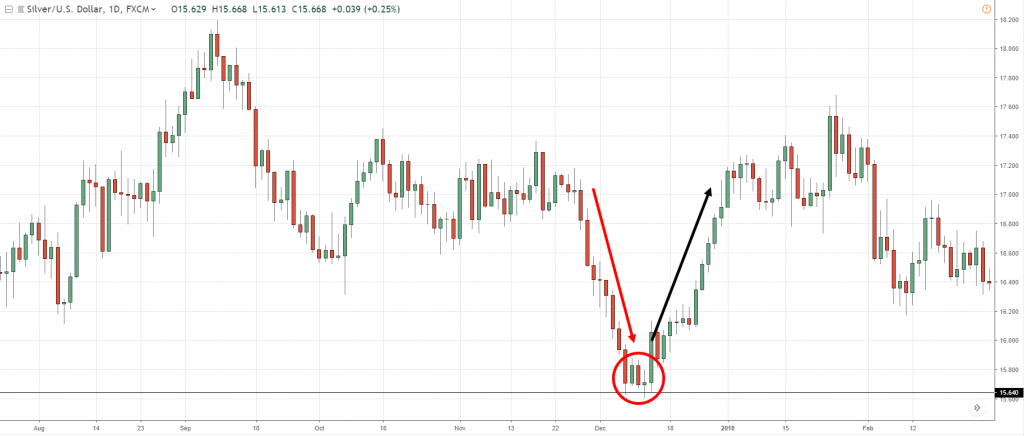
In XAG/USD, we're looking at a power move down into this support and then formed a price rejection:
This is also a strong power move, but there wasn't any price rejection into any key market structure:
But you can see that the price went up and reverses relatively quickly!
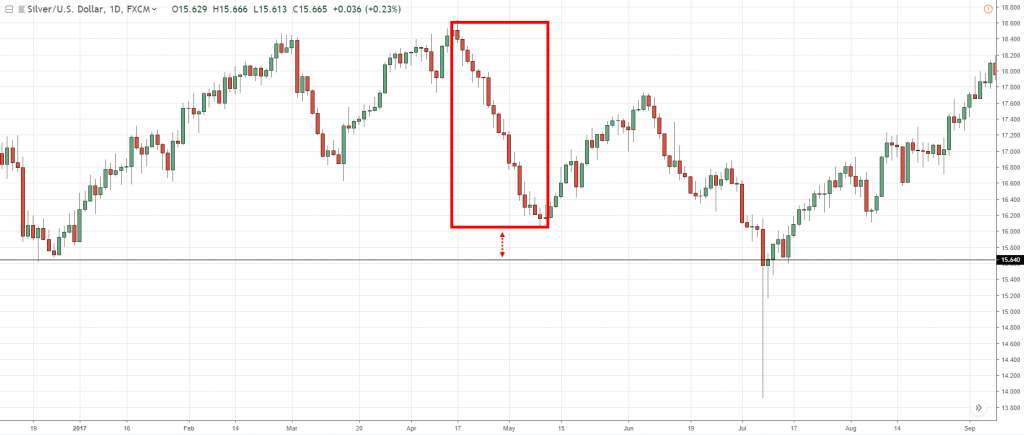
Another example is this one over here, a strong bearish momentum or a power move into this area of support:
Then you have a relatively quick reversal towards the upside.
So, what you want to see is this type of price action structure…
Big, bold, momentum move.
Let me share with you another example.
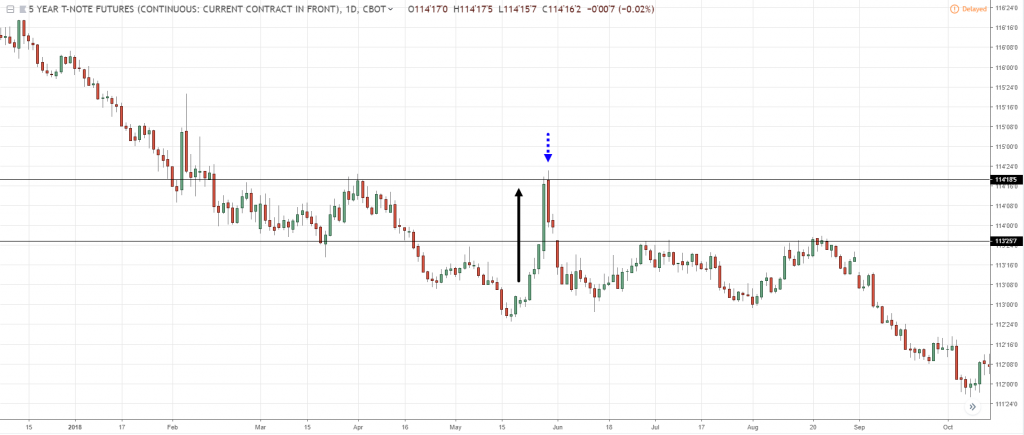
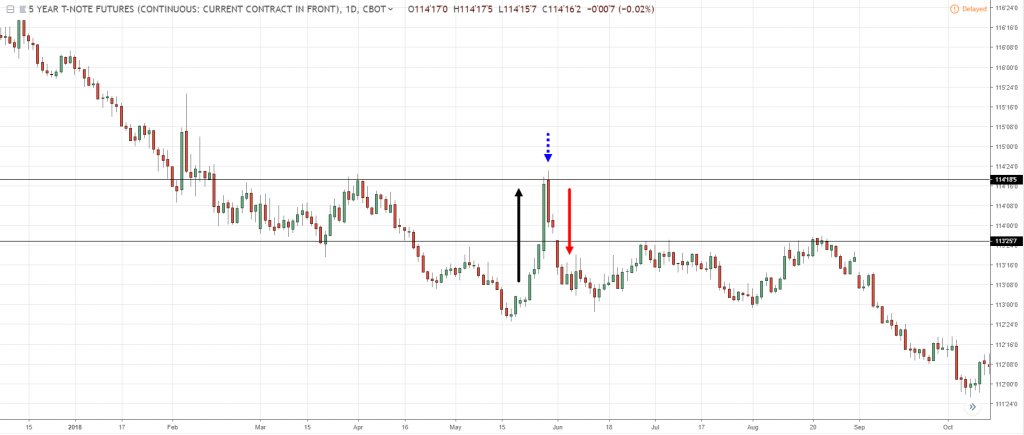
This one is the 5 YEAR T-NOTE FUTURES (ZF1!) with a power move into resistance:
Trust me…
Some traders are new.
They are unaware.
They buy the Breakout and think, "Oh man, the market is going to the moon let's buy the breakout!"
And then bam! It reversed at the next candle, which did a strong reversal.
They got caught on the wrong side and then what happens?
The market goes lower hitting their stop loss and the market pretty much has a swift decline over here:
This is what I mean by a power move, this is a very good textbook example.
You have a price rejection in the form of a dark cloud cover, and the market that went down pretty swiftly.
With that said…
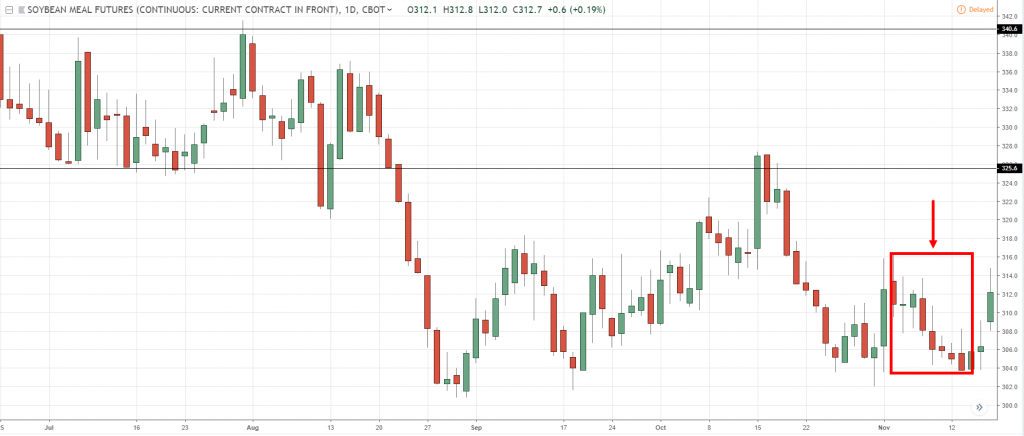
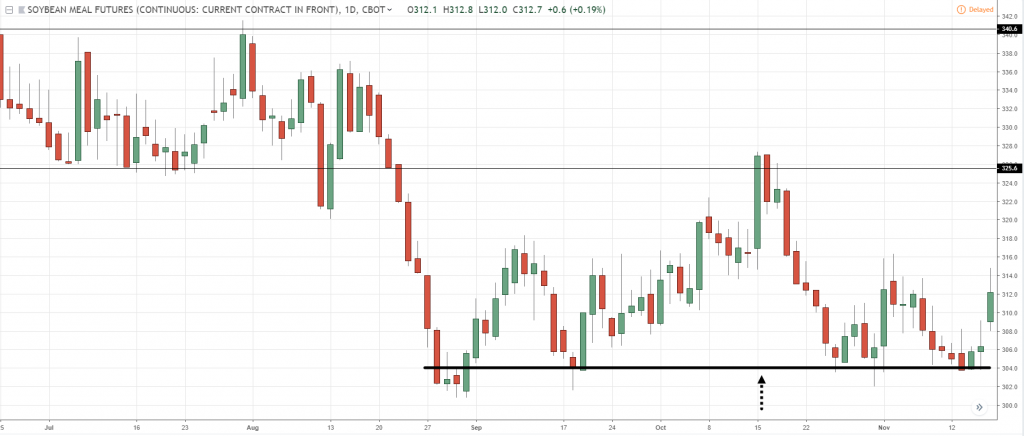
Let's have a look at SOYBEAN MEAL FUTURES (ZM1!), an example that you don’t want to trade where there isn’t a power move:
Clearly, this area over here isn't a power move...
You can compare to what I've just shared with you, look at this move into this area of support:
Do you want to trade this?
I sure as hell wouldn't want to trade this.
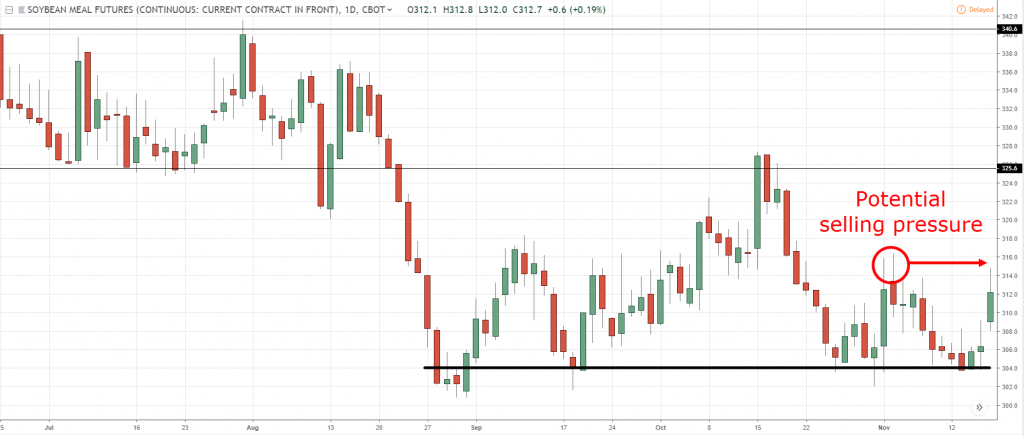
And the biggest reason why is that if you do get a valid price rejection like a hammer…
You can go long, right?
And shortly afterwards as the price goes higher, this over here is where potential selling pressure would lie:
Which is going to push down the price lower, as sellers look to short the market.
And this is bad for you as a trader who is long right now.
You are against the trend, plus you don't have a power move into market structure, plus you have a swing high which is nearby.
Which could turn the tide of your long open trade.
This is why I emphasize a lot to look for power moves into market structure.
That is really important.
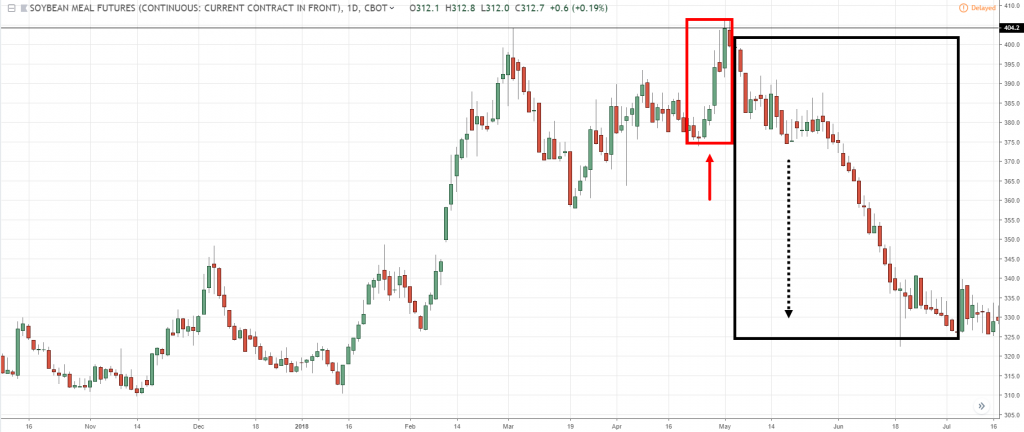
Another example in soybean meal with a strong power move into market structure and then a reversal:
Notice the range of the candles, large, big and bold.
Okay?
Hopefully, you understand this whenever you trade reversals at support or resistance.
This information over here is what you probably will not find elsewhere.
Moving on...
When do you trade breakouts at support and resistance
This is actually pretty much the opposite of what you’ve just learned earlier.
So, you know that the price is likely to reverse at support and resistance when you have a power move into market structure and a price rejection.
When you are looking at it from a breakout standpoint, you don't want to see a power move into market structure.
What you want to look for is price action that shows:
- Higher lows into resistance looking somewhat like an ascending triangle.
- Lower highs into support somewhat like a descending triangle.
- A build-up supported by a moving average.
If all this is foreign to you, don't worry…
Let me share with you a few examples.
Let me just cover each one from a theory aspect.
Higher lows into resistance looks something like this:
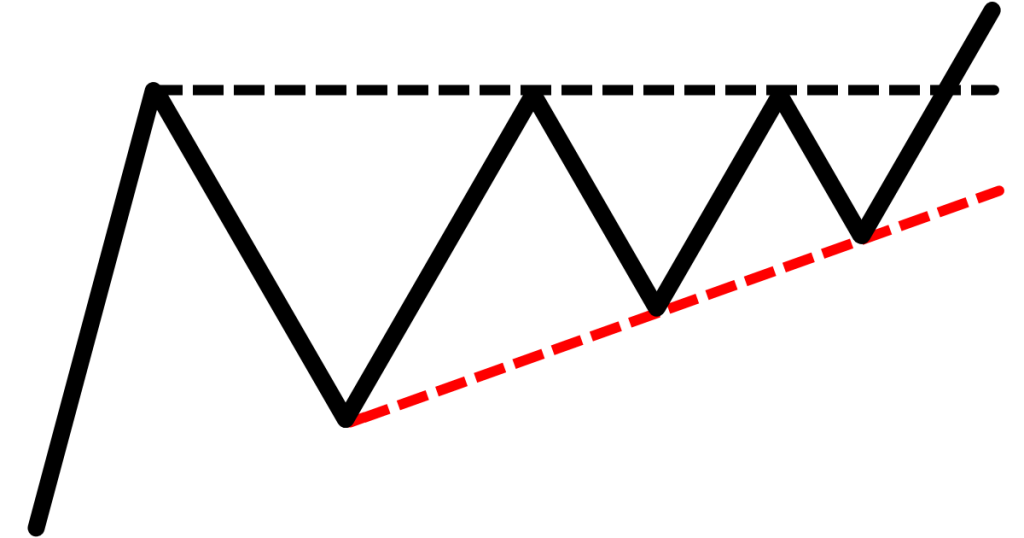
Typically, you can see the price looks somewhat like an ascending triangle.
This is significant because it's telling me that the buyers are willing to buy at higher prices.
Lower highs into to support are just the same thing, telling me that the sellers are in control, willing to sell at these low prices:
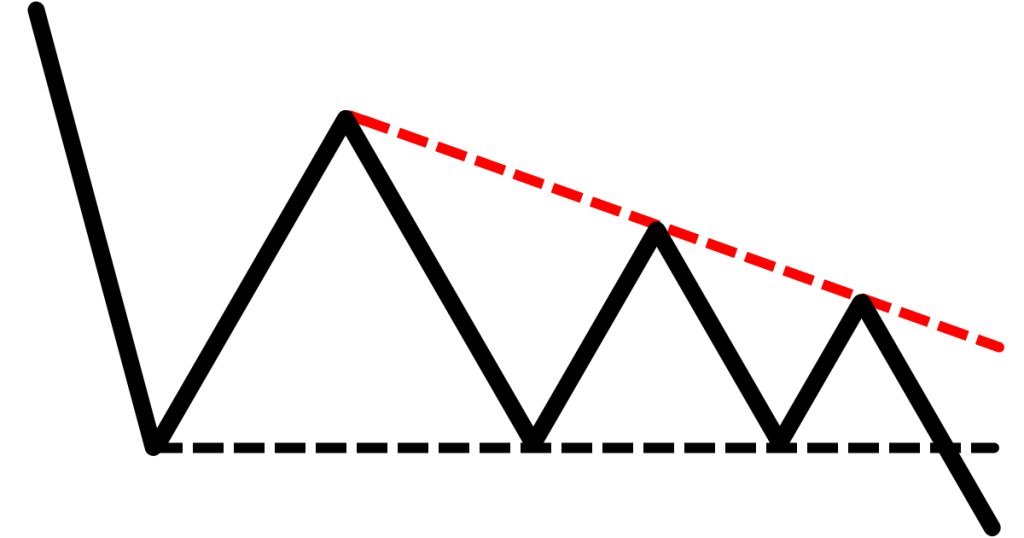
And on top of it, from a price action standpoint, it is telling you that the buyers are also getting weaker.
Because this is a condition where buyers barely pushed the price higher.
The subsequent times it only moved smaller and smaller.
Same for the ascending triangle where sellers pushed the price down by a little and then pushing the price down lesser and lesser.
You can see that the price action is actually quite interesting, right?
Where one side is getting stronger and stronger and the other one is getting weaker and weaker.
And build-up supported by a moving average.
What this means is that aside from ascending and descending triangle, there's another variation is what I call a build-up:

The price could just come to a key level of resistance or support, and it just consolidates.
If you pull up a moving average like the 20 or the 50-period moving average, you notice that the price supports it pretty nicely!
It's like the market is really respecting the moving average and getting ready to break out.
This moving average support can be applied to higher lows and lower highs into support as well which I'll share that later.
But these are the key concepts that I want to share with you that alerts you that the market is about to break out of either support or resistance.
Let's have a look at a few examples…
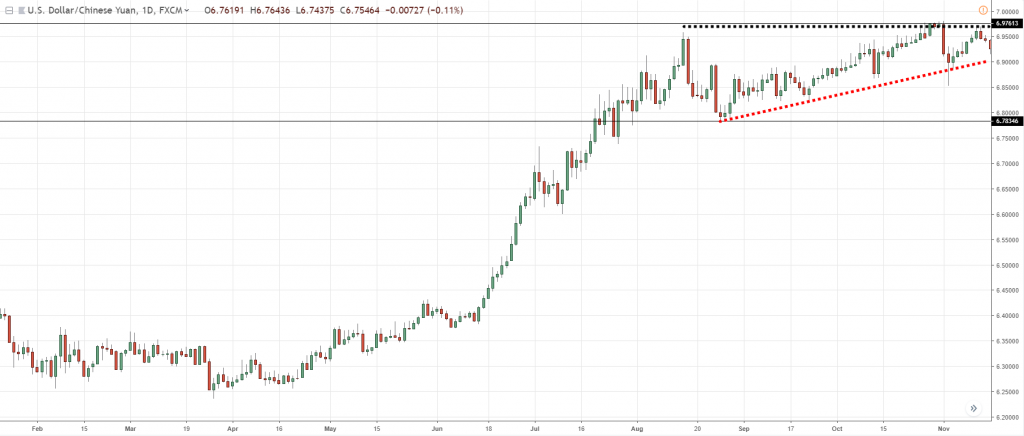
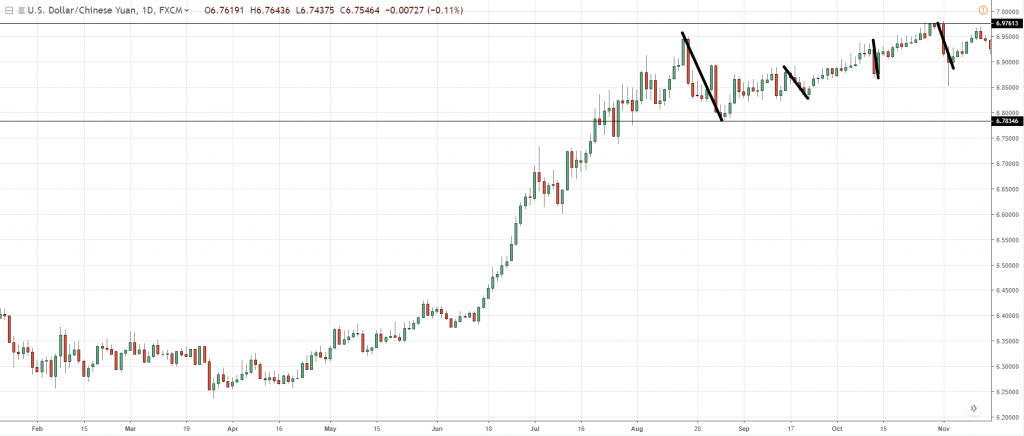
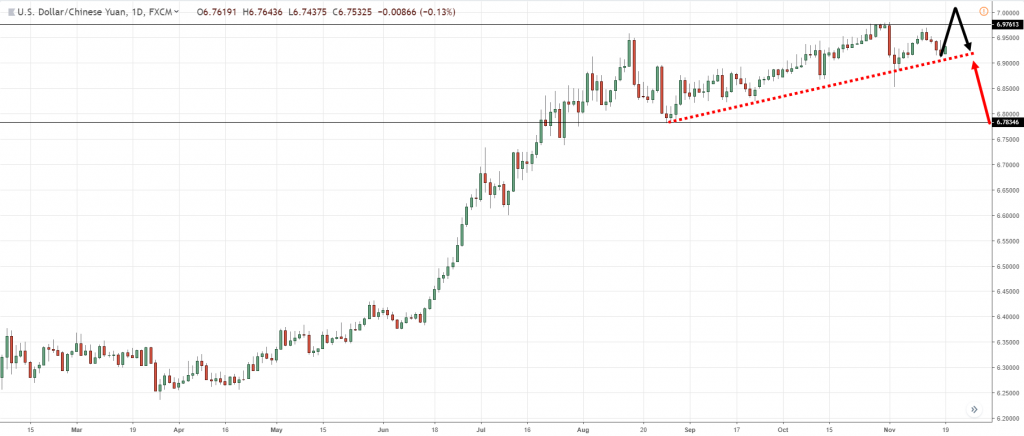
This one over here is the USD/CNH, a pretty a good example where you have this ascending triangle, higher lows coming into the market structure:
If you look at it, buyers are willing to buy it at these higher prices.
And if you look at the sellers in terms of their strength, they're getting weaker, they're getting feeble!
The first time they managed to push the price down by this much, and then it got weaker and weaker:
This is a sign of strength that the market could possibly Breakout higher.
You don't want to be shorting at resistance because, number one, you don't have a power move into the resistance structure.
And number two, if you were to go short into resistance, this level over here is where buyers could potentially come in:
Before the price could even move, you're going to face an opposing pressure that could turn the tide against you.
From a risk to reward standpoint, it doesn't even make sense as well.
This is why I said that if you want to trade reversals, you better look for a power move in the market structure and this type of higher lows into it.
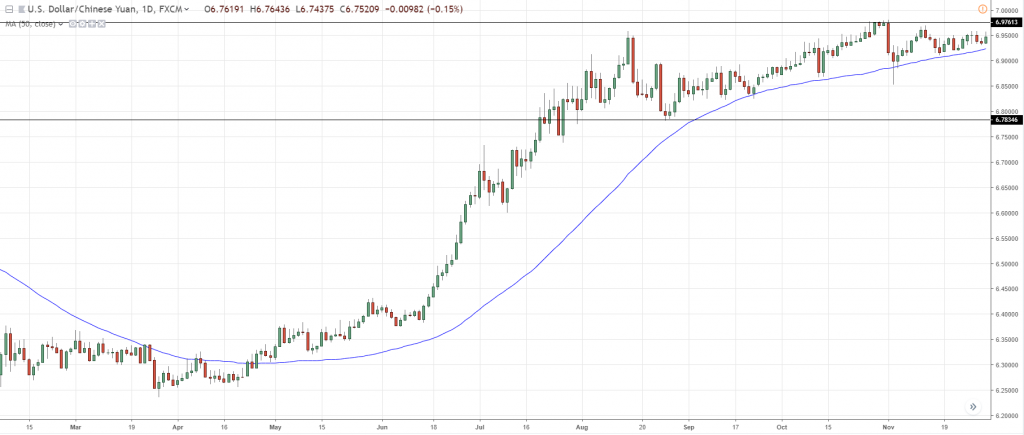
Similarly, if you pull out your 50 MA…
The price is somewhat being supported by the 50 MA over here:
This is one example over here for the USD/CHN.
Let me just share with you a few more examples before we conclude today's session.
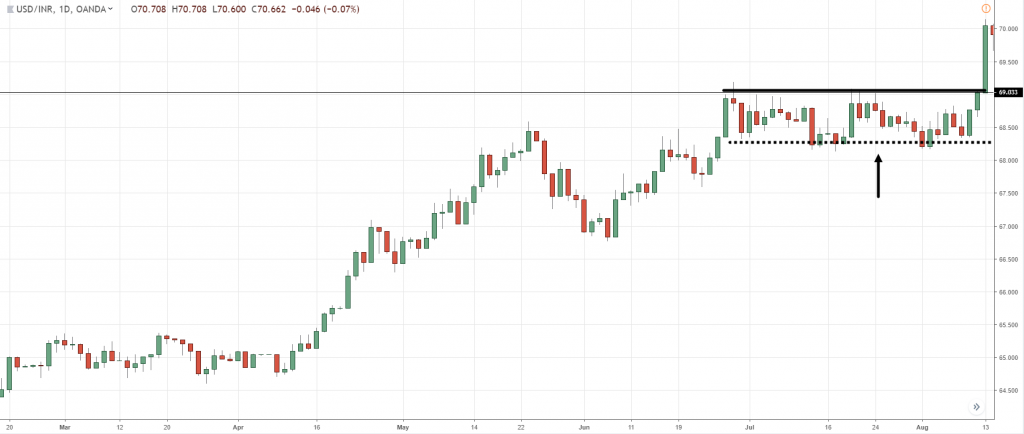
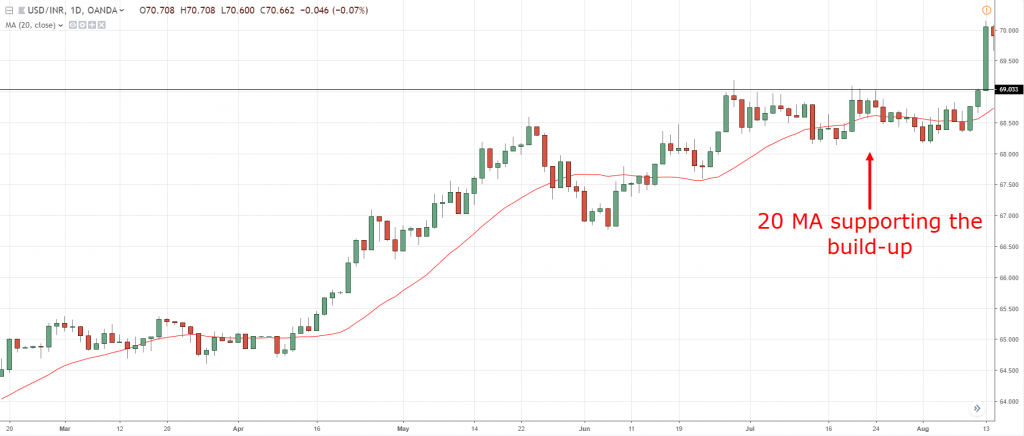
In USD/INR, we have what we call a typical build-up formed at resistance:
Notice, right?
This one is a bit different from the ascending triangle, but the concept is the same.
You have this build-up formed at resistance telling you that buyers are willing to buy at higher prices.
They are willing to buy in front of resistance!
And the MA part where I mentioned earlier, is that if you look at it, the price is somewhat being supported by the 20 MA already:
This tells you that the 20 MA is actually supporting up the price higher, getting ready to break out.
Okay, let's have a look at another example which is USD/CAD.
You might be wondering, "Hey Rayner, you seem to be really good at identifying all these cherry-picked charts.”
Yeah, it's because I actually traded all of these setups, it’s all in my head.
That's why it's all very fresh.
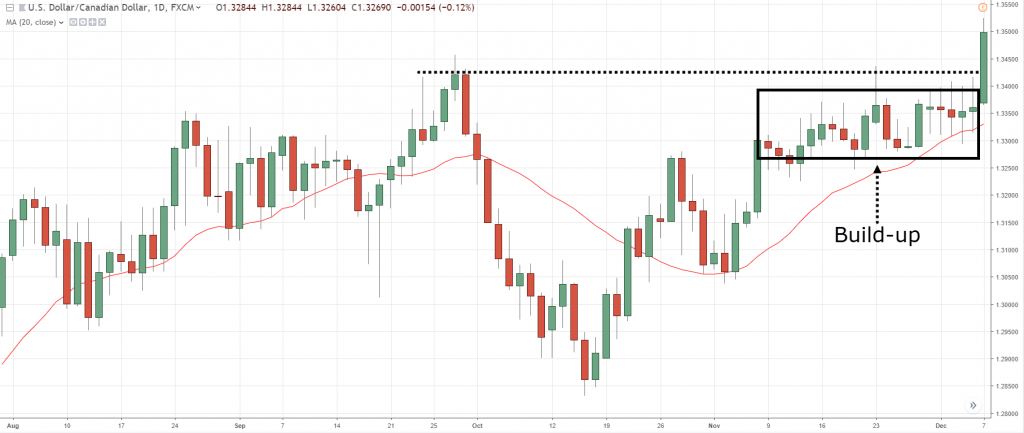
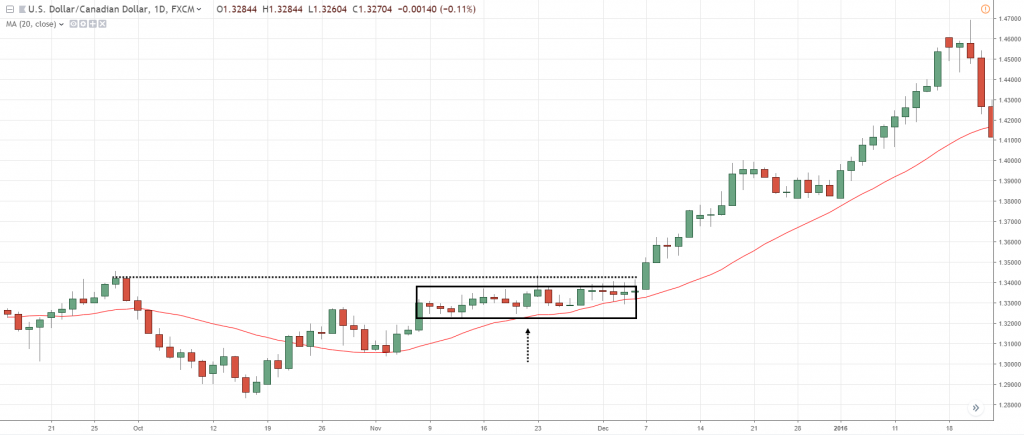
USD/CAD has a very beautiful example of a build-up:
Notice that it is in the area of resistance…
You have this build-up forming and notice how nice the moving average supports the price higher.
So, when you see this price action, please!
Don't short the markets...
This is a signal that the market wants to Breakout higher, this is a sign of strength!
Don't just blindly shout, "Oh, prices at resistance, right? Textbooks say short!"
It's going to be painful, alright?
Trust me, don't do that.
Now that you're more proficient in price action trading, you notice that there is a build-up forming at resistance.
The 20 MA is supporting the action, telling you that the market is likely to breakout higher.
In this case, obviously it did breakout:
Cherry picked by me, traded by me.
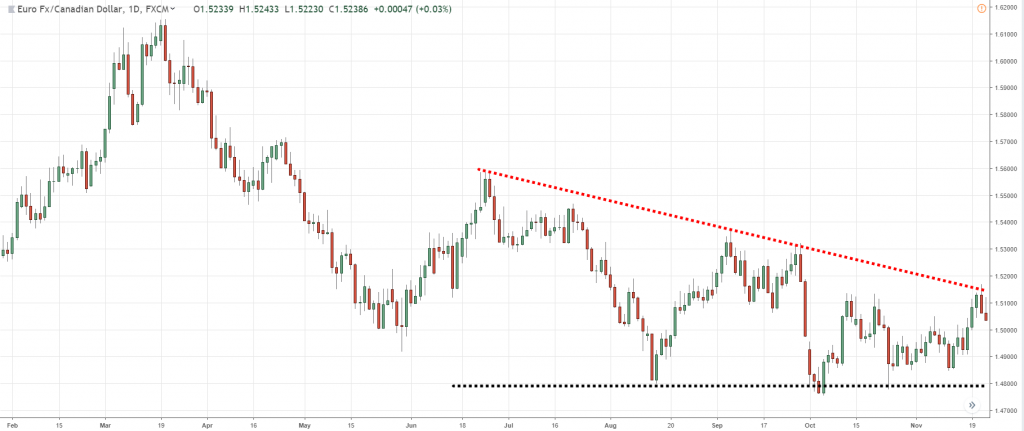
Another one is EUR/CAD forming a series of lower highs coming to support:
Let me ask you…
Do you want to be buying at this point?
Do you want to buy into this area of support?
I hope not, right?
Because after what I've just said, lower highs into support is usually a sign of weakness.
If you ask me, the market is likely to breakdown lower.
Can a market breakout higher?
Of course!
The market can do anything, but we're dealing with probabilities here my friend!
So, from the looks of it, the market is showing a sign of weakness and there's a good chance it would breakdown lower.
If you look at it from a price action analysis standpoint, notice that the buyers pushed prices higher, made a pretty strong move, then it got weaker and weaker:
Whereas the sellers, they're willing to sell at lower prices:
From the looks of it…
There's a good chance it will breakdown.
This is what I mean by lower highs coming into support. Okay?
Moving on, let's do a quick recap.
Recap
We have covered a lot in today's video, and we have just talked about one concept.
Which is support, and resistance:
- How to draw support resistance. Zoom out, draw the most obvious levels, and adjust.
- Support and Resistance Reversal. Look for strong power move into Market Structure. Large-bodied candles. Time away
- Support and Resistance Breakout. Higher Lows into Resistance. Lower Highs into Support.

