#1: Ascending Triangle Chart Pattern
Lesson 1
What is an Ascending Triangle Pattern
In this video, you'll learn how to trade one of my favorite chart patterns.
It's called the ascending triangle pattern.
Let me explain to you what this pattern is all about and why I love this pattern so much:
1. An ascending triangle is pretty much where you see higher lows into resistance.
2. A descending triangle is the opposite of an ascending triangle. It's where you see lower highs into support!
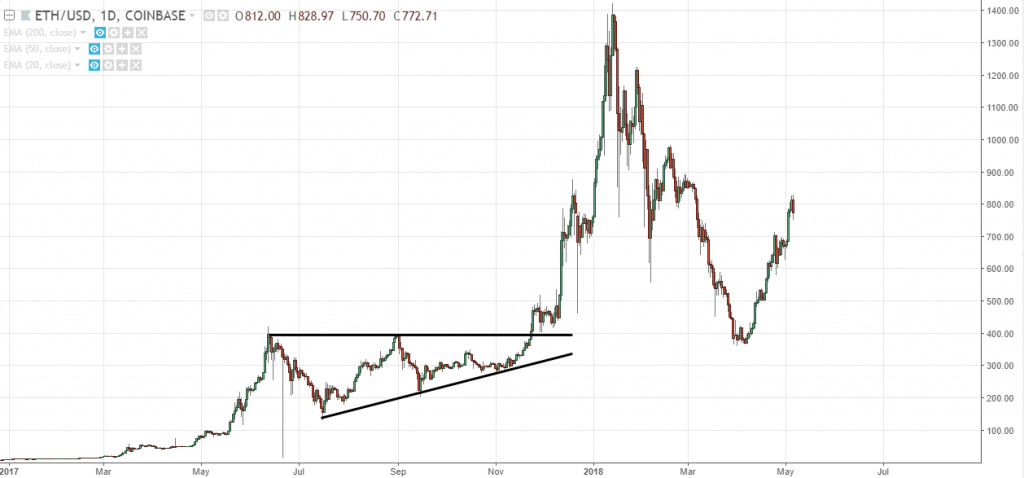
Visually, it looks something like this:
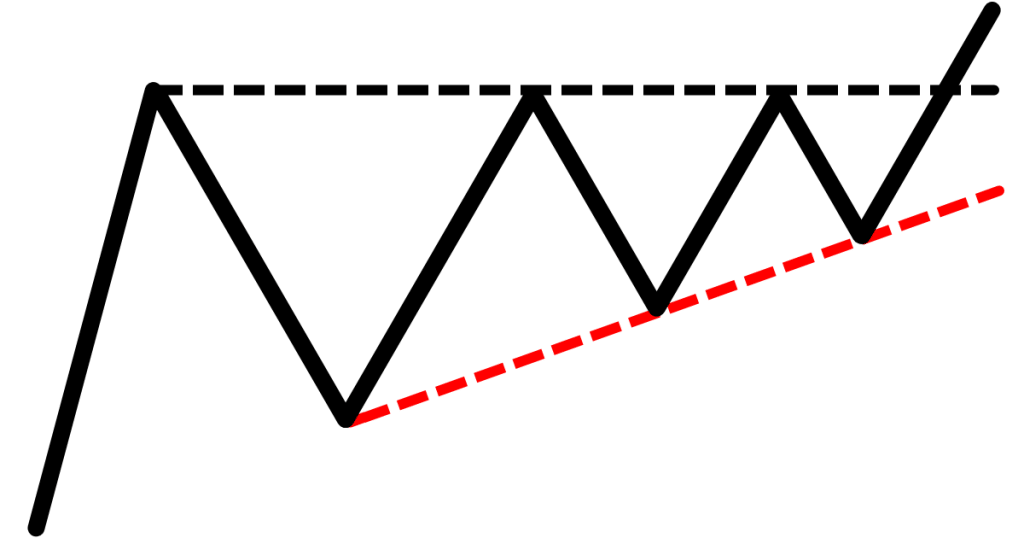
You can see the price making higher lows into resistance!
Because you can actually connect the lows.
And on the other hand, the descending triangle is simply the opposite.
You see lower highs coming into support.
Now...
The thing to note is that the longer the pattern takes to form, the more significant it is.
And I'll explain why.
But first…
Why does this pattern work?
The reason is simple.
It's because stop losses get triggered.
If you look at an ascending triangle, ask yourself...
Whenever the price hits resistance, will there be traders looking to short the market?
You can be sure there is!
Because if you study technical textbooks, you study trading courses and the internet, they tell you that when the price comes to the resistance you should short the market.
And I do agree, but only in certain conditions.
And if conditions like this, you see the market testing resistance for the third time, the fourth time...
You don't really want to short this market anymore.
Why is that?
Two things:
1. There’s a cluster of stop-loss that will get accumulated over time just above the area of resistance.
2. When you see the market making higher lows into resistance, it tells you that the buyers are in control! Because if they're not, they couldn't have possibly met higher lows into resistance.
These are the two reasons that tells you why the Ascending Triangle pretty much works in the long-run!
Because there’s a cluster of stop loss above it, and it's a sign of strength when you see this pattern.
Moving on…
How do you trade the Ascending and Descending Triangle
That's the question, right?
For me, a very simple general rule is this:
You look for an Ascending Triangle in an uptrend.
And you look for a Descending Triangle in a downtrend.
Basically, you long ascending triangle in an uptrend, and you short descending triangle in a downtrend.
Let me share with you with a few examples:
So, can you imagine the thought process of a trader who is unaware of reading price action?
They may think:
“Oh! Price is at resistance, I should be short!”
And so, they go short, and where would they put their stop loss?
Well, the textbook says, just above the high.
With enough traders shorting the market, there is a cluster of stop-loss built up over the area of resistance.
And this is a sign of strength as you see lower highs coming into resistance!
This tells you that buyers are willing to buy at these higher prices!
On top of that, you have those momentum traders piling into the trade going long on a breakout.
And then, the market breaks up higher.
Now…
Imagine if the order flow that is in your favor:
- Stop loss getting triggered. This becomes a buy order because if your stop loss gets hit when you are short, your stop loss is basically a buy order to get you out of the market.
- Traders want to break out. When they see the market breaking above the highs, they will also go long, which creates a huge demand for higher prices.
Now, I'm going to walk you through how you can go about setting your stop loss, entries, and exits.
There are a few ways to do it…
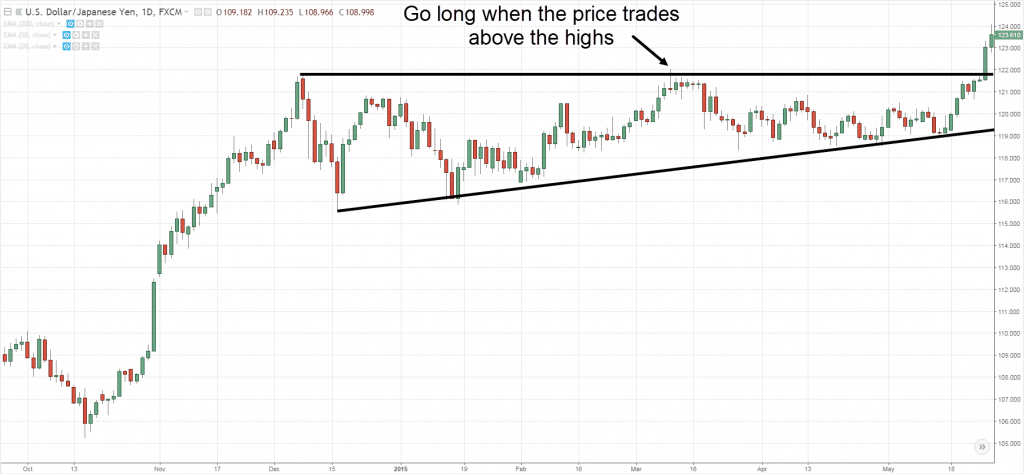
Entries
You can either look to go long on the break of the highs, or you can look to get long when the market breaks and close above the resistance level.
There's really no right or wrong to this.
Here’s what I mean:
Stop Loss
As for stop loss...
I typically recommend looking at the nearest structure low and give it some buffer below it.
You can use an indicator like the Average True Rage and set it 1 ATR below it.
Why do you want to give some buffer?
It's because you don't want a market to come down, spike you up, and then continue trading higher.
So, give it some buffer, and give your stops more room to breathe.
But when the market breaks and closes below the nearest structure low, chances are this pattern is invalidated, and you don't want to stay in this trade any longer.
This is how you can go about with your entries and your stop loss.
Take Profit
Again, there are two ways you can go about it.
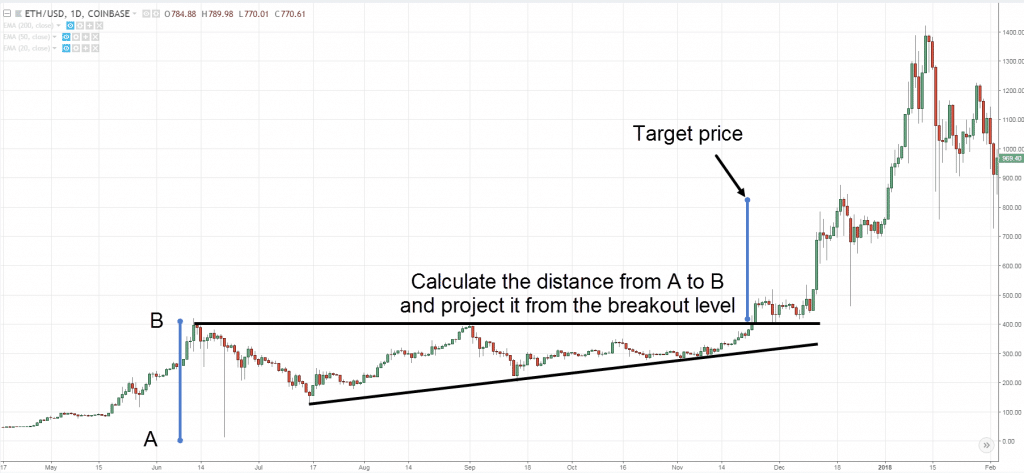
For taking profits, the first thing that you can do if you want to have a fixed target is that you can actually measure the move from the swing high to the low.
Here’s an example:
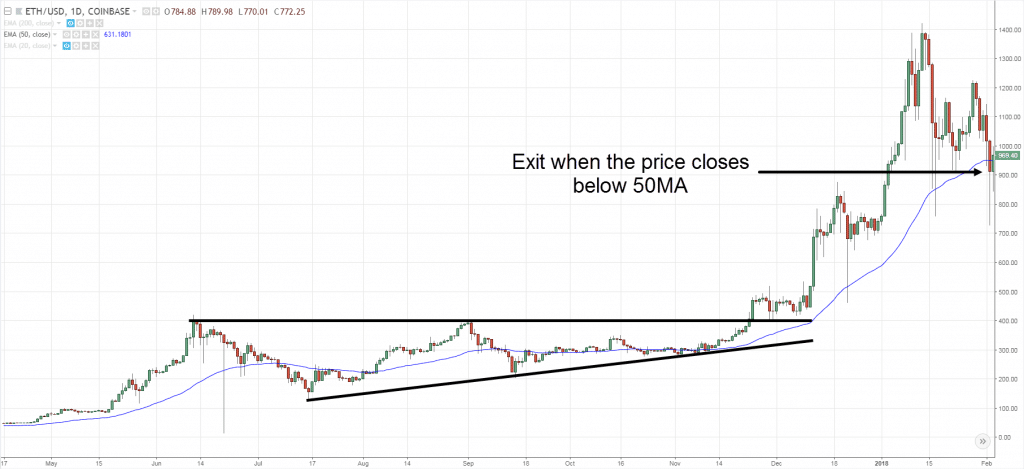
An alternative approach that you can do if you want to trail your stops, is by using a moving average.
For example, you can use a 20-period moving average.
You can trail your trade as the market trades higher and you only exit if it closes below it.
Here’s an example:
Whether you only use 20, or 50-period moving average, there's no right or wrong.
20 MA would keep you in with the short-term trend.
The 50 MA would keep you in with the medium-term trend.
It really depends on how long or how short of a trend that you want to ride.
Here's another example:
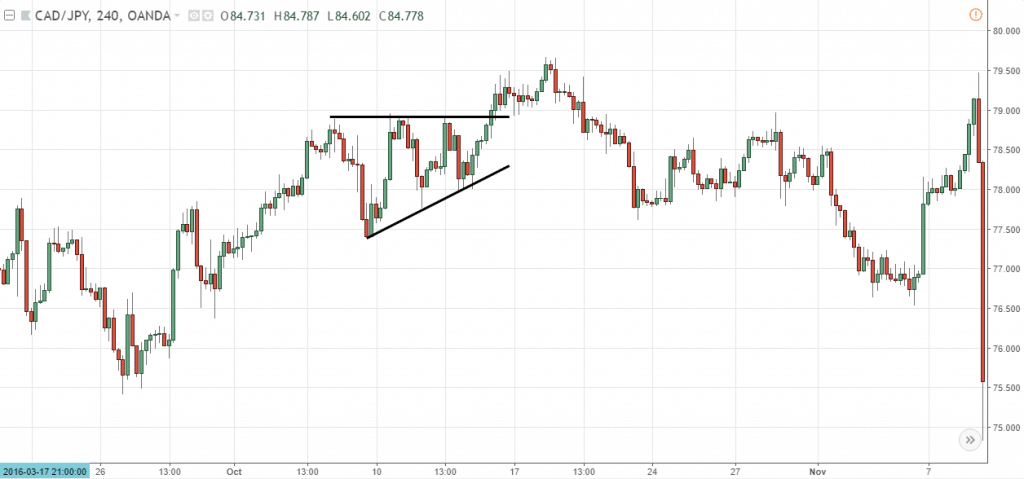
Can you spot the ascending triangle pattern?
You can see higher lows coming into this resistance and you can see that this is pretty much a losing trade.
It basically got you into the trade, you long the breakout, and collapses under which you got stopped out.
Nothing that I share on my YouTube, my blog, website, or anything, is 100%.
It's all dealing with probabilities.
So, always manage your expectations that there will be winners and there will be losers.
And finally, another example I want to share is the opposite:
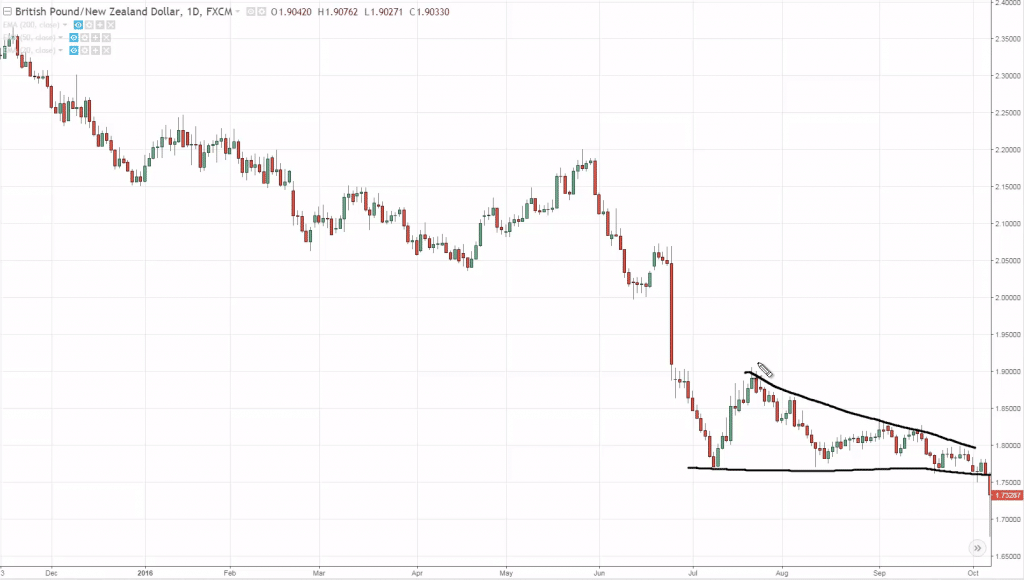
It is descending triangle in a downtrend.
You can see lower highs coming into support.
So again, how could you have traded this pattern?
You can look to place a sell stop order just below the lows or wait for the market to break in close below this support before you get short.
For the stop loss, you want to reference from the nearest swing high.
Because if the market can break in close above this downward trend line, chances are this pattern is invalidated and you don't want to stay in the trade any longer.
Where do you set your target?
Again, I mentioned that there are two ways:
1. Take the distance from the high to the low. So, if the distance from the high to the low is 500 pips, your projected target is 500 pips.
2. Trail your stop loss. Use a moving average, like the 20 or the 50 depending on the type of trend that you want to capture.
If you let your winners run, there will be small winners and small losses.
But there will be a few times, possibly one in ten trades where you catch a big move and the market just keeps on trending over a long period of time.
Let’s do a quick recap…
Recap
- An Ascending Triangle is basically higher lows into resistance, and the Descending Triangle is lower highs into support.
- The reason why this pattern work is because there is order flow at the other end of the market structure.
- If you want to trade with this pattern, trade with the trend for better odds, right? After all, the trend is your friend.
- You can either look to long on the break of the highs, or you can wait for a close after the market breaks out of resistance.
- For stop loss, I typically reference from the nearest swing low and give it some buffer.
- When is this pattern invalidated? It's when this upward trend line, gets broken, so the pattern is invalidated.
- As for Exits, you can use a price projection or calculate that distance from the highs to the lows, and this is where you could consider taking your profits.

