#3: How to use Stochastic Indicator like a Pro
Lesson 3
Hey hey, what's up my friends!
In this video, we'll talk about the Stochastic indicator.
First and foremost, I'll cover what is it and how does it work.
I know some of you might be thinking, "Rayner, the Stochastic indicator is so simple, right, below 20 is oversold, above 80 is overbought!”
Let me ask you…
Do you know how the numbers on your Stochastic indicator come about?
Why is it sometimes 50, why is it sometimes 60, 70, or 80?
I bet 90% of you watching this video now do not know why the numbers on your indicators move up and down,
and so this is why I'm going to explain to you what is it and how does it work.
Once we've nailed down the fundamentals of Stochastic then, we can learn how to apply appropriately.
The next thing we'll talk about is the biggest mistake traders make with the Stochastic indicator.
Even I, myself, I made this mistake in my early years of trading.
I'm going to share with you what it is and how to avoid it.
Then, I'll talk about how to use the Stochastic indicator the correct way.
I will share with you how to use it to time pullbacks in a trend.
I will share with you how to use it to filter your trading setup, so we can find better trading setups and as an entry trigger.
Okay?
With that, let's begin...
What is Stochastic?
According to the founder, George Lane:
Stochastics measures the momentum of price. If you visualize a rocket going up in the air – before it can turn down, it must slow down. Momentum always changes direction before price.
Now, the thing is…
How does it relate to what you see on your chart?
Let me explain:
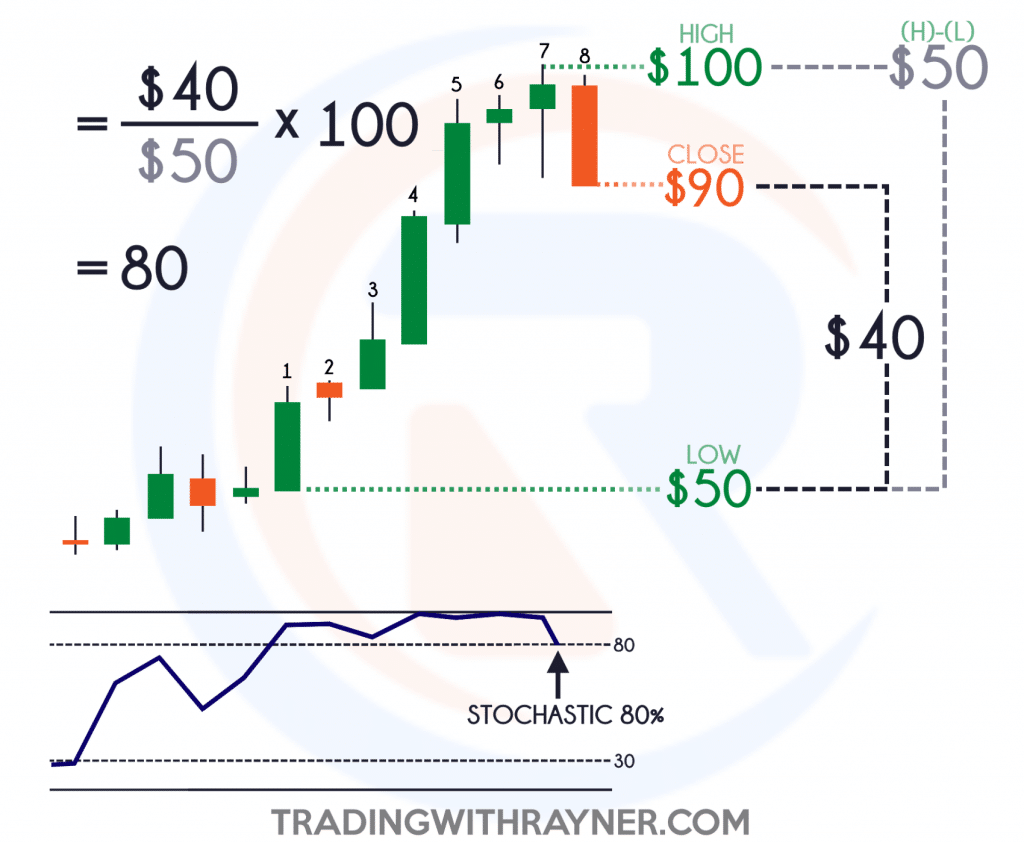
The 1st to the 7th candle is bullish, and the 8th candle is bearish.
The high price is $100.
The low price is $50
And it closed at $90.
What will the stochastic value be?
If you understand this stochastic indicator, you will know how to calculate this value, but if you don't, I will explain it to you right now.
It's actually very simple.
What you're going to do is take the range from the low to the close, and divide it by the entire range from the highs to the lows!
Right?
What's the range from 50 to 90?
It's 40.
What's the range from the low to the highs?
It's 50.
Why 40?
You take 90 minus 50. That's why you get 40.
Why 50?
You take 100, which is the highs, minus the lows, which is 50.
What you get this 0.8
You multiply it by 100.
You will get 80.
And this is what will appear on your stochastic indicator, a value of 80.
There you have it.
If you have come to this far, you probably know how stochastic numbers are derived.
And you're ahead of 90% of other traders who use stochastic but don't understand what it means.
With that said…
What is the mistake that traders make?
You've learned earlier that stochastic is a measure of momentum.
A mistake that traders make is that they blindly trade overbought and oversold signals.
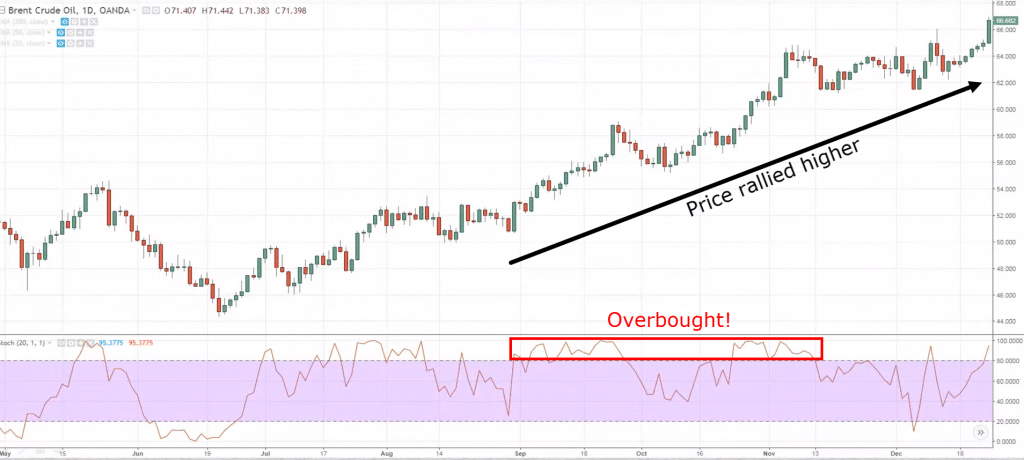
If you look at this, right, you can see the stochastic.
Often, you hear traders say, "Oh, look, stochastic is overbought! Price is above 80. Stochastic is overbought, let's go short!"
You can see that the market rallied:
You can see that if you go short, the market continued to rally!
Here's what it means…
As a trader who really knows what the stochastic means, you can see this chart clearly in an uptrend.
Earlier, you read and you learned that the definition of stochastic is a measurement of momentum!
Essentially, what you're doing when you go short when stochastic is overbought is that you are shorting against the trend, against the strong momentum.
Let that sink in for a while...
It's no surprise thatif you do this, you constantly get stopped out over and over again!
This is a mistake that traders make.
Do not blindly short just because stochastic tells you that it's overbought or oversold.
What should you instead?
Read on…
How do you use Stochastic
The first way you can use it is to help you time when the pullback will end in a trend.
Let me explain...
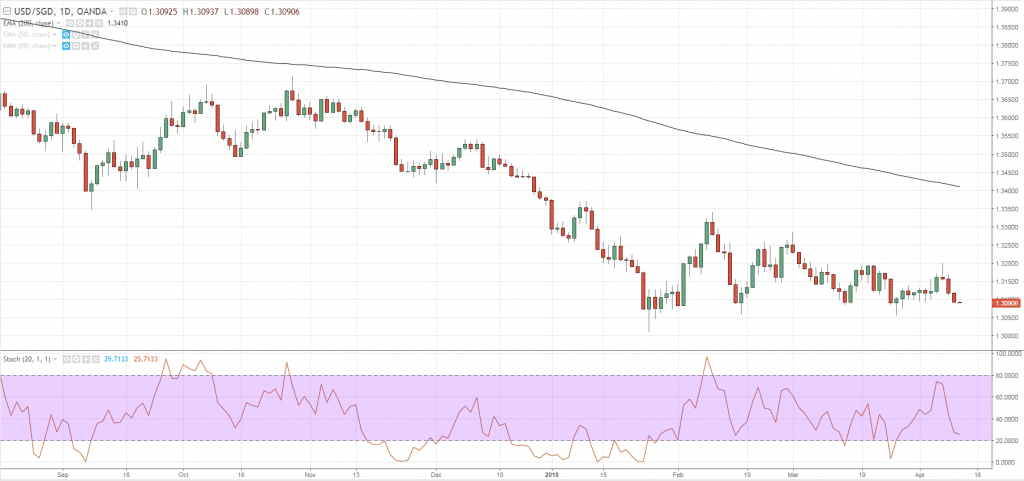
We can see over here:
This market is in a downtrend.
Why is that?
This is because, the price is below the 200-period moving average.
My definition of a long-term trend is that if the price is below it, then the long-term trend is down.
If the price is above it, right, then the long-term trend is up!
Earlier, you've learned that you don't want to blindly short just because it's overbought, or long just because it's oversold!
However, if you have a trend filter now, then things could make sense!
For example, this is a downtrend.
What if, Stochastic can help you know the time when the pullback will end in a downtrend?
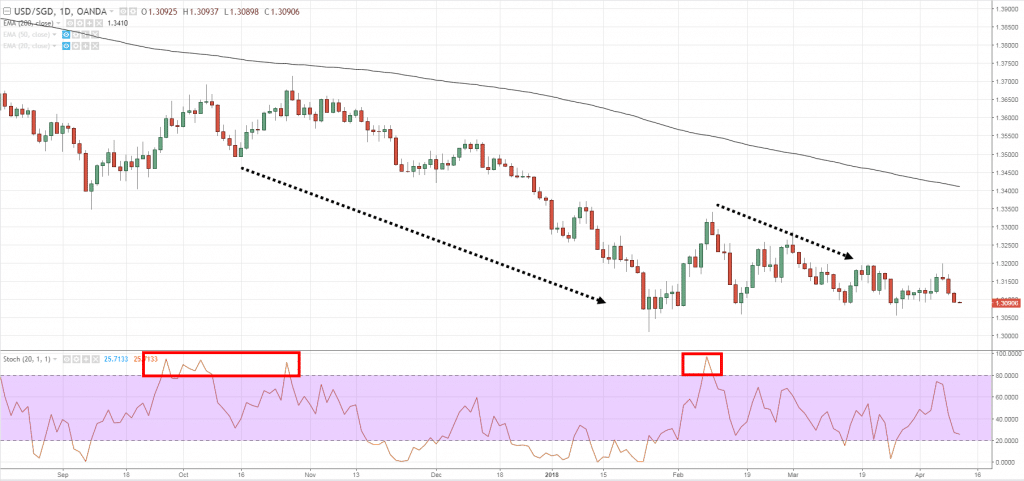
For example, if the market is in a downtrend, then what we are looking for is overbought areas on your Stochastic indicator to tell you where the pullback may potentially end!
If you look at it...
If the market is in a downtrend, then you look for overbought areas.
If the market is in an uptrend, then you look for oversold areas.
In this case, you can see that this trend is down, and these are overbought areas on your Stochastic:
This all pretty much coincide with near to where the pullback will potentially end.
Now, don't mistaken me…
I'm not saying go short just because the market is overbought.
All I'm saying is that the overbought area in the downtrend is potentially where the pullback could end.
If you want to trade this type of setup, you would still look for an entry trigger like a bearish reversal candlestick pattern.
This is just to serve as a purpose to alert to you to where the pullback may potentially end.
Let's look at another example:
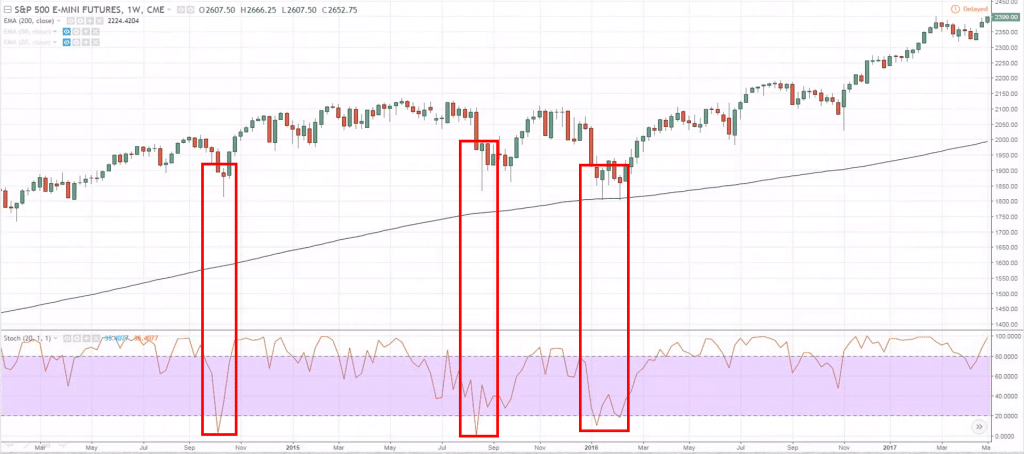
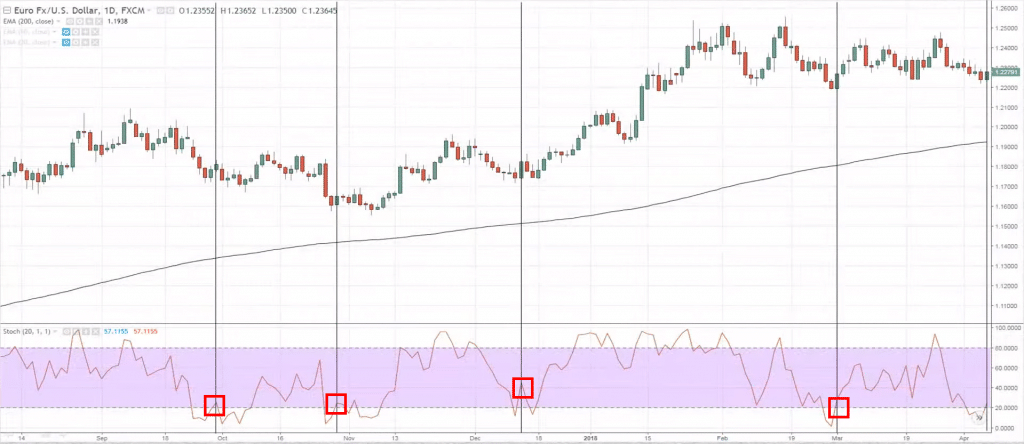
This time this is in an uptrend!
Again, in an uptrend, right, we're going to look at oversold areas on your Stochastic chart.
Which is below 20 that is oversold.
It pretty much coincides with the swing lows.
Again, it could alert to you where the pullback may potentially end in an uptrend.
Another way you can use Stochastic is to serve as a filter.
I'm sure you heard the word "filter" before.
Right?
A filter could serve as something to tell you whether you should be long or short.
So, how can you use the Stochastic indicator to filter your trading setup?
How to use Stochastic - Filter
For example:
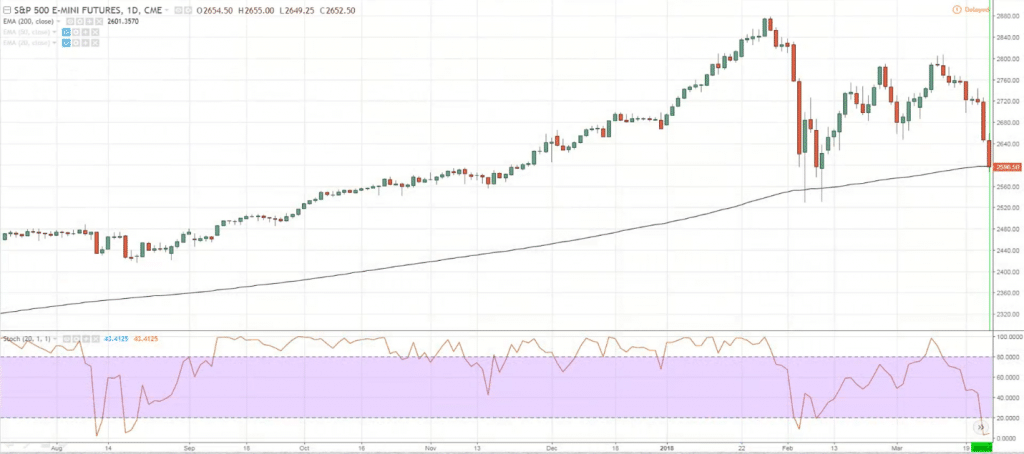
This is the S&P daily time frame and you notice that Stochastic is oversold in an uptrend!
This should tell you that the market or rather the pullback could potentially end!
If you are trading off the lower time frame (1-Hour) and you see something like this:
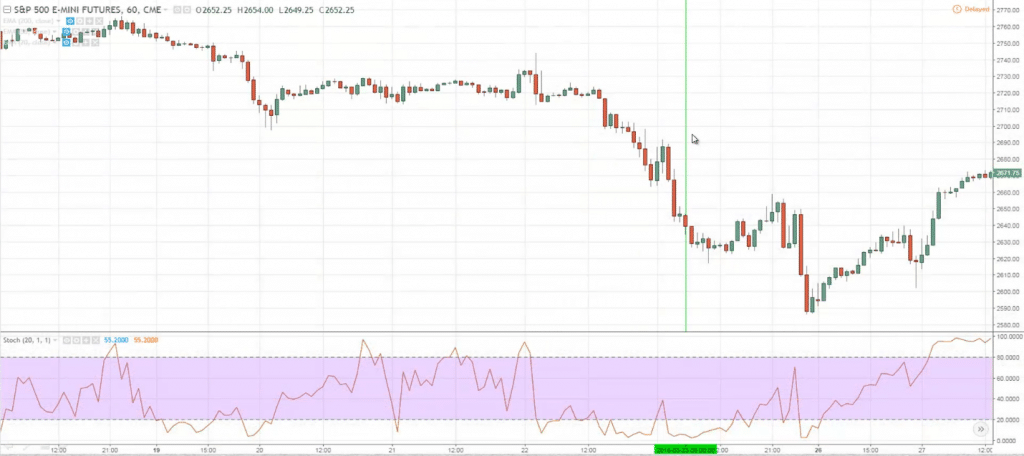
This green vertical line you see.
That should alert to you that you don't necessarily want to short too aggressively, because the higher the time frame, Stochastic is oversold!
Maybe you may want to choose to not take any short trades altogether.
Or maybe if you want it short, you're going to be quick in taking profits because the market is possibly near the end of a pullback on the higher time frame.
This is how you can use Stochastic as a filter for your trading setup.
Lastly, you can also use Stochastic as an entry trigger.
What is an entry trigger?
Entry trigger serves as a confirmation, as an entry timing tool to enter the trade.
Common entry trigger could be a bullish hammer, candlestick patterns, etc.
Stochastic can also serve as an entry trigger.
How do you do it?
It's that when the market trades above the oversold levels or below the overbought levels, that could serve as an entry trigger.
You can see over here:
The Stochastic has clearly risen above the oversold level.
This could be an entry trigger to go long.
Don't mistake me that, “hey, just go long when the Stochastic rise from oversold levels.”
That's not what I mean...
What I'm saying is that it could serve as an entry trigger if you have already had a bias to long.
You look at other confluence factors that tell you that the market is about to trade higher.
Then, hey, that could be an entry trigger.
A tool to tell you to enter the market right now.
This is how you use the Stochastic as an entry trigger...
If you rise above the 20 level, you can look for long setups.
If it falls from the 80 level, you can look for short setups.
This is how you use it as an entry trigger.
Now, some of you might wonder, "hey, Rayner, why does your Stochastic only have one line, right? Mine has two lines. Why is that?"
Simply put, right, because this is the settings of my Stochastic indicator.
The K is 20. Right? It looks past the last 20 candles.
The D is one.
The D is simply the moving average of this line you see.
If you put in five, right, it will be a five-period moving average of the line that you see on the chart example.
To me, there is no point having two lines on a chart.
I can't see the purpose of it.
I removed the second line by just changing it to one.
This is why I only have one line on my Stochastic indicator!
Let's do a quick recap of what you've learned today…
Recap
- Don't blindly trade overbought and oversold signals. You want to understand what Stochastic mean.
- You can actually use Stochastic to help you time when a pullback will end.
- It can help you filter your trading setups, whether you should be long or short.
- It can be an entry trigger.

