#2: Bollinger Bands Trading Strategy
Lesson 2
In this video, you'll learn all about the Bollinger Bands trading indicator.
Specifically, you'll learn:
- What this indicator is about and how does it work.
- The biggest mistake that I see traders make with this indicator and how you can avoid it.
- Three practical trading techniques like how to identify explosive moves in the market before it occurs using Bollinger Bands.
- How to use Bollinger Bands to better time your entries.
- How to use Bollinger Bands to ride massive trends in the market.
There's a lot to cover, and I want to dive straight in...
What are Bollinger Bands
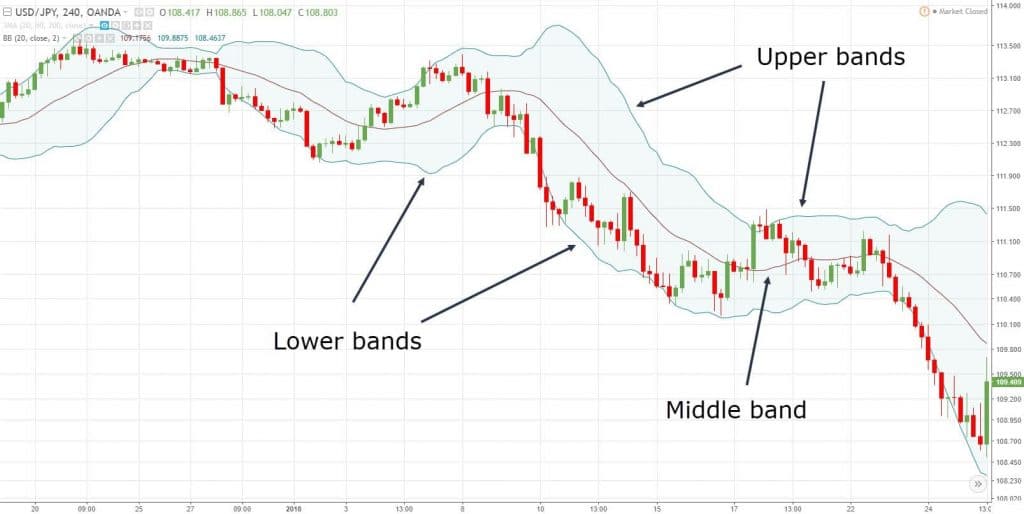
To understand this indicator first, you must know that it is three components to it...
So I want to explain it to you:
The first component is basically the middle band. This is a very simple 20-period moving average.
Then the lower band and the upper band are simply two standard deviations away from the mean!
Or rather, away from the middle band.
They're just two standard deviations away from it.
Some of you might be wondering what is the standard deviation?
It's basically to determine how overstretched the market is.
When you say that something is three standard deviations away from the mean, it's telling you that it's pretty darn overstretched.
Because it's three standard deviations away!
The higher the standard deviation, the more overstretched the so-called market is.
One thing to understand is that just because the market is overstretched or it's at a far standard deviation away, it does not mean that the market will immediately reverse.
This is something to bear in mind and take note of.
But I just want to break it down to you the concept of standard deviation.
Basically, it's to illustrate to you how to tell how overstretched the market or price is by using this concept.
A big mistake…
A big mistake that traders make when they are trading with Bollinger Bands is taking the standard deviation for granted.
Because they see the market, "Oh! It's at this outer Bollinger Band is two standard deviations away from the mean, I should go short!”
You know, if you go short, you can see that it's going to be very painful as the market continues to grind higher.
First and foremost, a big mistake that traders make is taking it for granted that just because the price is at the outer Bollinger Band they will blindly go short.
Or just because the price is hugging the outer Bollinger Band, it means that it's a good time to go short, not especially when the market is in an uptrend.
One thing to bear in mind is that always pay attention to the trend.
You want to be trading along with the trend.
Okay?
It doesn't matter what an indicator says.
It doesn't matter if it's overbought or oversold or very overstretched, and blah, blah, blah.
Pay attention to the current trend .
From then on, if you trade along with the same direction of the trend, you would tend to make better trading setups and trading opportunities.
Okay, so this is a big mistake.
Don't just blindly short because the price is at the outer band.
Moving on, I want to share with you three techniques that you can use when trading with Bollinger Bands...
How to find “explosive” moves
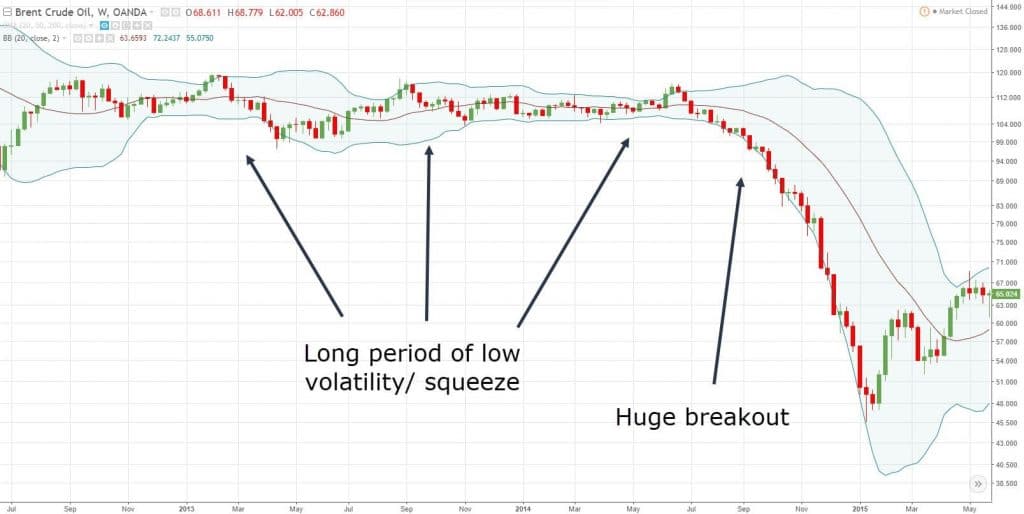
The first one is what I call the Bollinger Band squeeze.
What this means is that when you notice your Bollinger Bands getting tighter and tighter.
Like for example, you look at this outer band:
It's getting tighter and tighter, looking like a very squeeze top sausage.
It's telling me that the volatility of the market is shrinking!
What happened is that if the volatility of the market is shrinking, there’s a good chance that volatility will expand sometime in the future.
We can see that volatility has shrunk and that one then what happens is that boom!
Massive breakdown over here on crude oil.
The Bollinger Bands could give you a signal, telling you that this market could possibly have a breakout move.
This Bollinger Band squeeze gives you a potential heads-up!
Like, "Hey, warning, this market could possibly break out sometime in the future."
This is how we can actually go about finding explosive moves in the market by paying attention to the Bollinger Bands.
I pay attention to the squeeze because when the market breaks out and volatility expands...
You look at the bands, it looks like a balloon right now.
Prior to the huge breakout, you notice a sausage-looking squeeze.
The bands are somewhat in a horizontal, not yet like an inflated balloon.
It's still like a very tight sausage.
Okay, so this is one tip, the first tip that I want to share with you.
Second thing…
How do you actually better time your entries when trading with Bollinger Bands
This is useful, especially when the market is trending.
Because when the market is trending...
Say, for example, the market is in a range, breaks out.
A lot of times, traders will look for a previous resistance, turned support.
Hoping the market will come down lower, get long, and then trade the upside.
But more often than not, the market doesn't give you this retest so beautifully.
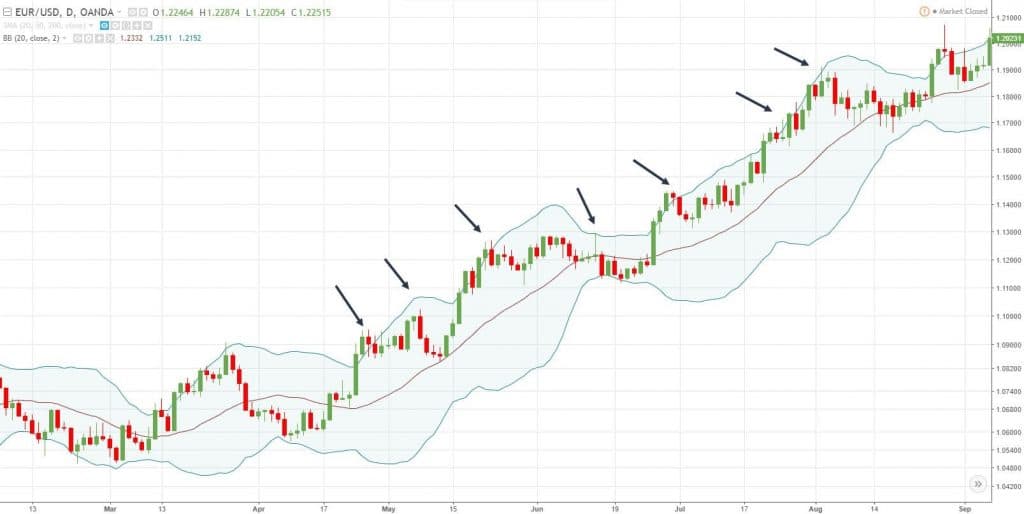
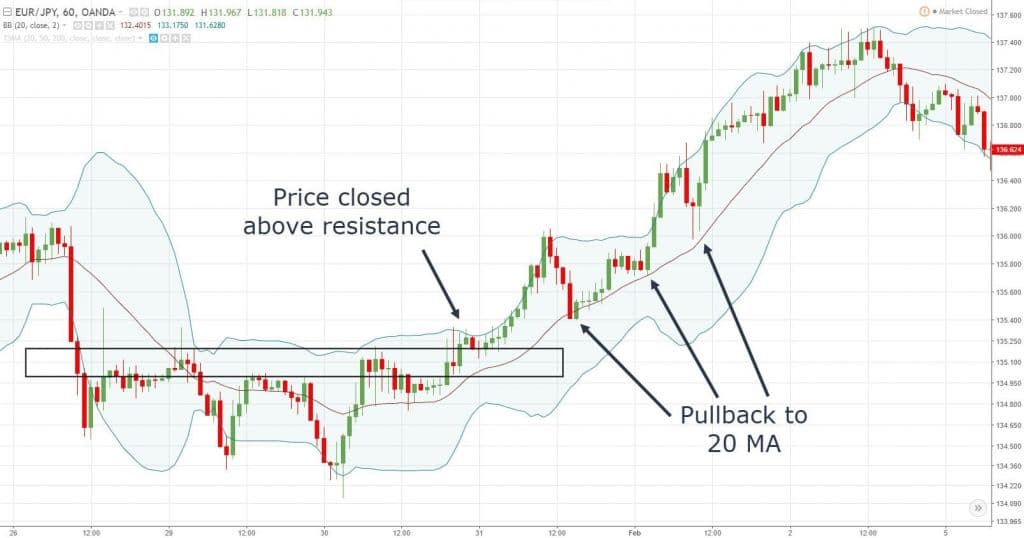
What you can do to time your entry on the pullback.
Especially if the pull-back doesn't retrace deep enough into this previous resistance turned support!
What you can do is you can use the Bollinger Band:
If you recall, the middle band is the 20-period moving average.
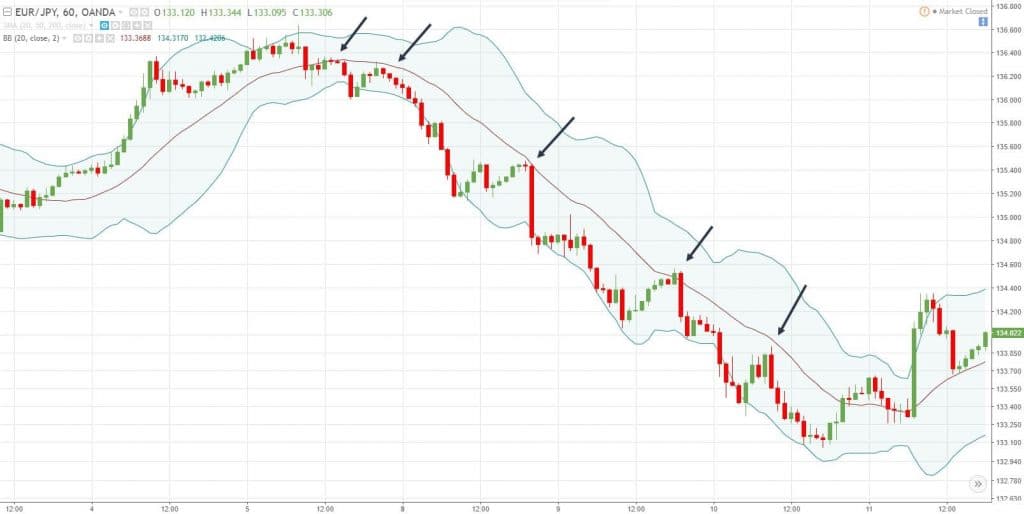
You see that the Bollinger Band or where the market is trending...
It tends to retest back to the 20-period moving average before continuing lower!
To a trader, this 20-period moving average could present you trading opportunities.
A potential area where the pull-back could end, and then continue to trade in the direction of the trend.
When the market retraces back towards the 20-period moving average, that could be a potential area of value.
A potential area that might want to initiate an entry trigger for you for your trade.
So, this 20-period moving average is an area of value that you can pay attention to, to better time your entry.
Here's another example:
We can see over here, the market broke and closed above the area of resistance, came back, retest the 20-period moving average, continued higher, almost resting it, then continued trading higher.
We can see that the 20-period moving average is an area of value.
A potential area where you can actually time your entry to trade with the trend.
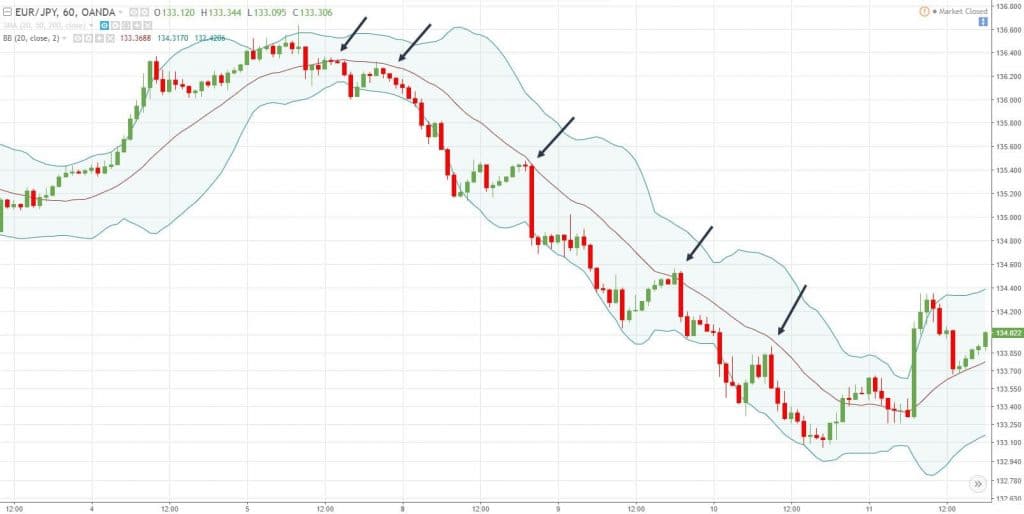
One last tip is to share with you is how to use Bollinger Bands to ride big trends.
So again:
We're using the same concept of the 20-period moving average, you can trail your stop loss.
That means you will remain in the trade until the market breaks and closes above the 20-period moving average, and then you exit your trade.
Alternatively, if you want to give your trade more room to breathe.
What it can do is that you can also trail it using the outer Bollinger Band.
In this case, if you use the outer Bollinger Band, you would only exit when the market breaks and closes above the outer Bollinger Band.
So, give your trade more room to breathe and increase the odds of capturing a longer-term trend.
This is also another way on how you can actually use Bollinger Bands to ride the trends.
Just a quick recap to what you've learned today…
Recap
- Be aware of trading against the trend. Don't blindly short the outer band just because the market is overextended.
- A Bollinger Band squeeze is likely to be followed by a breakout. If you see the Bollinger Band like a sausage, there’s a good chance that it could break out in the future.
- You can time your entries when trading with the Bollinger Band. Pay attention to the middle band. That is where the market could possibly retrace to.
- You can ride big trends in the market by trailing your stop loss by using the middle band or the outer Bollinger Band.

