#2: The Limitations of Candlestick Patterns
Lesson 2
Limitations using Japanese Candlesticks
First and foremost, understand that this is not the Holy Grail...
There is no Holy Grail in trading!
Japanese candlestick is just a technique for you, or rather a tool that you can use in your trading to help you make better trading decisions.
That's about it.
It's not a Holy Grail.
It is not a trading system by in itself.
Okay?
So, with that said I want to share with you three limitations of candlestick chart:
- It doesn't tell you how the price move.
- It doesn't tell you the big picture.
- Gap
Let me explain what I mean…
How the price moved
Let's say you have a bullish candlestick chart on the daily.
It opens, and it closes higher.
The thing about this is that it doesn't tell you how the price moved within the day!
Maybe the price moved up, moved down, consolidates, and close somewhere during the day.
Here’s what I mean:

You can see that there are three different ways that I have come up with on how the price could potentially move!
Of course, there are more than three ways, most likely countless possibilities!
But a candlestick will not tell you that.
The “big picture”
A lot of times, traders look at candlestick patterns like the shooting star! bullish hammer! and stuff like that...
But looking at this pattern itself, it does not tell you the big picture.
If you're not careful and if you just treat these patterns in isolation, it can be disastrous.
So, the thing is, if you look at a bearish pattern and go short, then you know you're going to be in for some trouble.
Because you always have to take into consideration what is the prevailing trend.
And this is something that no candlestick pattern will tell you.
It will tell you what has happened momentarily, but it doesn't tell you what is the long-term trend.
So, bear this in mind...
That candlestick patterns just tells you what happened momentarily at one particular point in time.
It does not tell you anything else outside of that.
With that said...
That is the second limitation, the big picture.
And the third thing is…
Gap
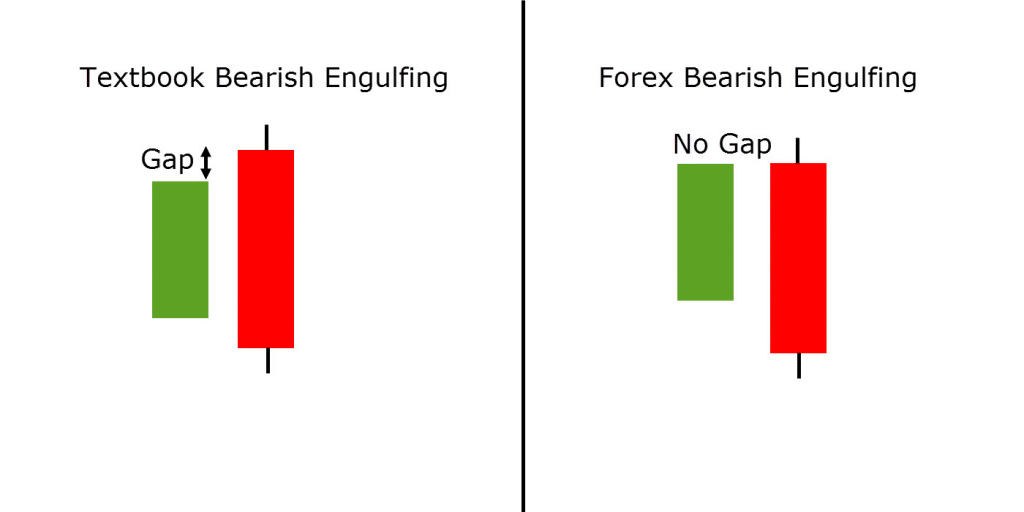
Traditionally, candlestick pattern comes with a gap.
For example, engulfing pattern the pattern has to gap.
It has to gap above and below the prior candle.
Here’s what I mean:

If you don't understand don't worry.
We'll cover that later…
Just understand that traditionally, candlestick patterns come with a gap.
So, if you're trading markets like the Forex market which is open 24/5
You hardly have gaps, because it's open for almost 24 hours a day!
What happens is that you have to remove a gap portion according to the textbooks.
And slightly tweak the definition of bearish engulfing for the Forex market.
With that said, let do a quick recap into the limits of candlestick pattern…
Recap
- It doesn't tell you how the price move.
- It doesn't tell you what's the long-term trend.
- You need to modify patterns that involve a gap, especially if you're trading 24 hours market like the FX market and even some in the futures market.
