#1: Introduction to Candlestick Patterns
Lesson 1
What is a Japanese Candlestick
A Japanese Candlestick is basically a way to interpret your charts.
Candlestick isn't the only way.
You also have the line chart, bar chart, and Renko charts.
Candlesticks are just one type of method that you can use!
It's very popular because it reveals quite a bit of information on the chart.
Where did Candlesticks originate
Candlesticks originated from Japan from a Japanese rice trader called Munehisa Homma from Japan
It was brought to the western world by Steve Nison.
He wrote the famous book called “Japanese Candlestick Charting Techniques.”
This is how the western side of things get to know about Japanese candlestick.
How to read a Candlestick
If you look at a Japanese candlestick, you will only see two types of bars:
- Bullish Bar
- Bearish Bar
Let me explain…
Bullish Bar
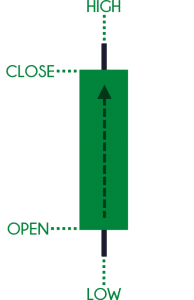
If you look at a Japanese candlestick and you see a bullish bar:

All you need to know is that the open is at the bottom.
Then, the price moves up higher and eventually close at the top.
Above the close is the high of the candle referencing a particular point in time.
Below the open is the lowest point referencing a particular point in time.
What do I mean by a particular point in time?
This means that the high and low is determined by the type of candlestick you're looking at.
Let's say your candlestick is based on a daily chart, then the highs and lows represent one day.
If your candlestick is an hourly chart, then the highs and lows represent one hour.
This is how you read a bullish candlestick chart!
Bearish Bar
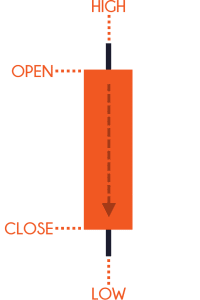
A bearish one is just the opposite for the open and close, but the highs and lows remain the same.
A bearish one is just the opposite for the open and close:

If you think about this, for a candle to bearish, it has to close lower.
For it to close lower, the open has to be at the top and then eventually close lower.
Again, the high and low depends on the timeframe you're looking at.
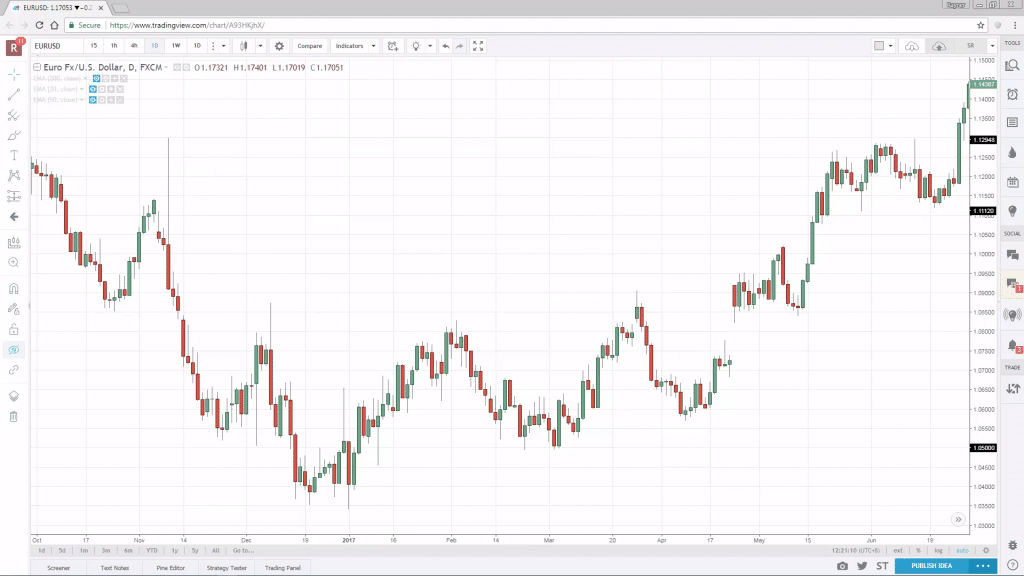
Let's have a look at an actual chart:
This is the FOREX market chart EUR/USD.
And you can see that this is a daily timeframe.
Each candlestick in this chart represents the high for the day and the low of the day.
A bearish candle, as you can see, has a red colored body.
A bullish one basically has a green color body.
With that said, let's do a quick recap…
Recap
- In a bullish candle, the open is below the close.
- For the bearish candle, the open is above the close.
- The wick basically represents the high or low for a given period.

