#9: How To Avoid Losses
Lesson 9
Hey, hey, what's up my friend?
In today's video, you’ll learn how to avoid losses.
Because here's the thing:
I know many of you get into trading but you face losses after losses. If you keep getting stopped out of your trades, only to see the market reverse back in your favor, or maybe you keep losing without knowing why this lesson is for you.
Let's get started...
1. Don't trade far away from the area of value
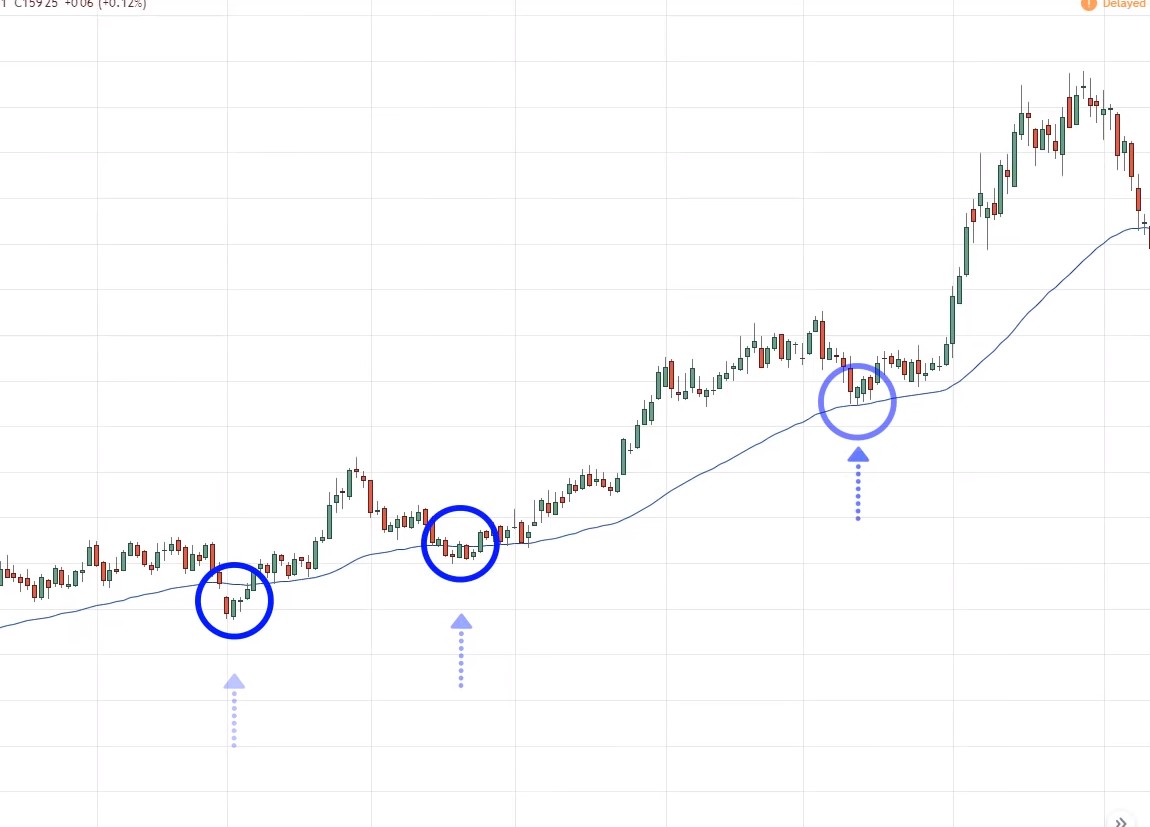
In certain market conditions, especially when the market is in a healthy trend, the market tends to pull back towards the mean. The mean can be a moving average, a trend line, etc.
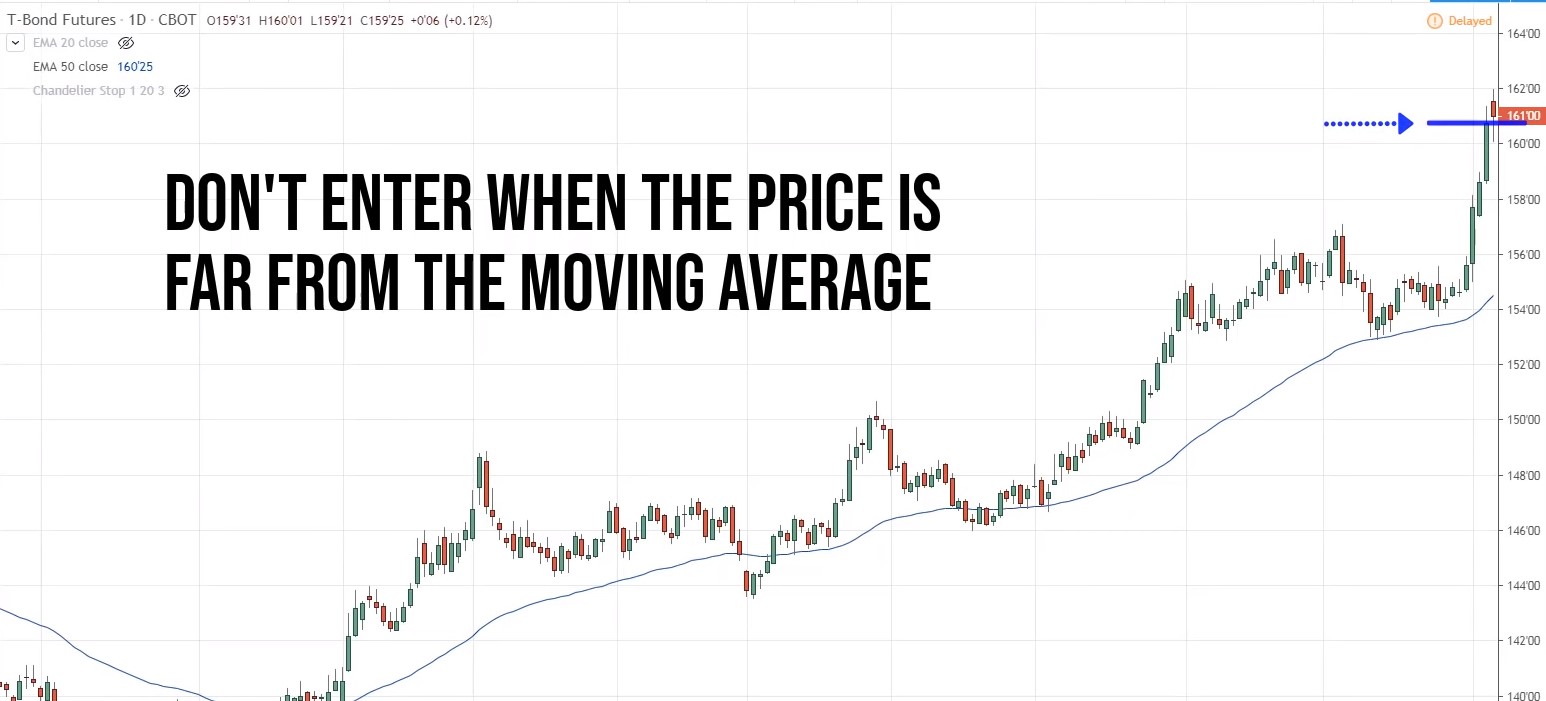
If the market respects a moving average, you don't want to be entering when the price is far away from the moving average. That's because when the market does a pullback, you'll probably get stopped up and boom, you get a loss.
Let me share with you an example of what I mean. For this 30-year Treasury bond, you can see that the market tends to respect this 50-period moving average:
If you see a market respecting a moving average, you don't want to be entering your trade when the price is far away from the moving average. For example, if you look at this point in time:
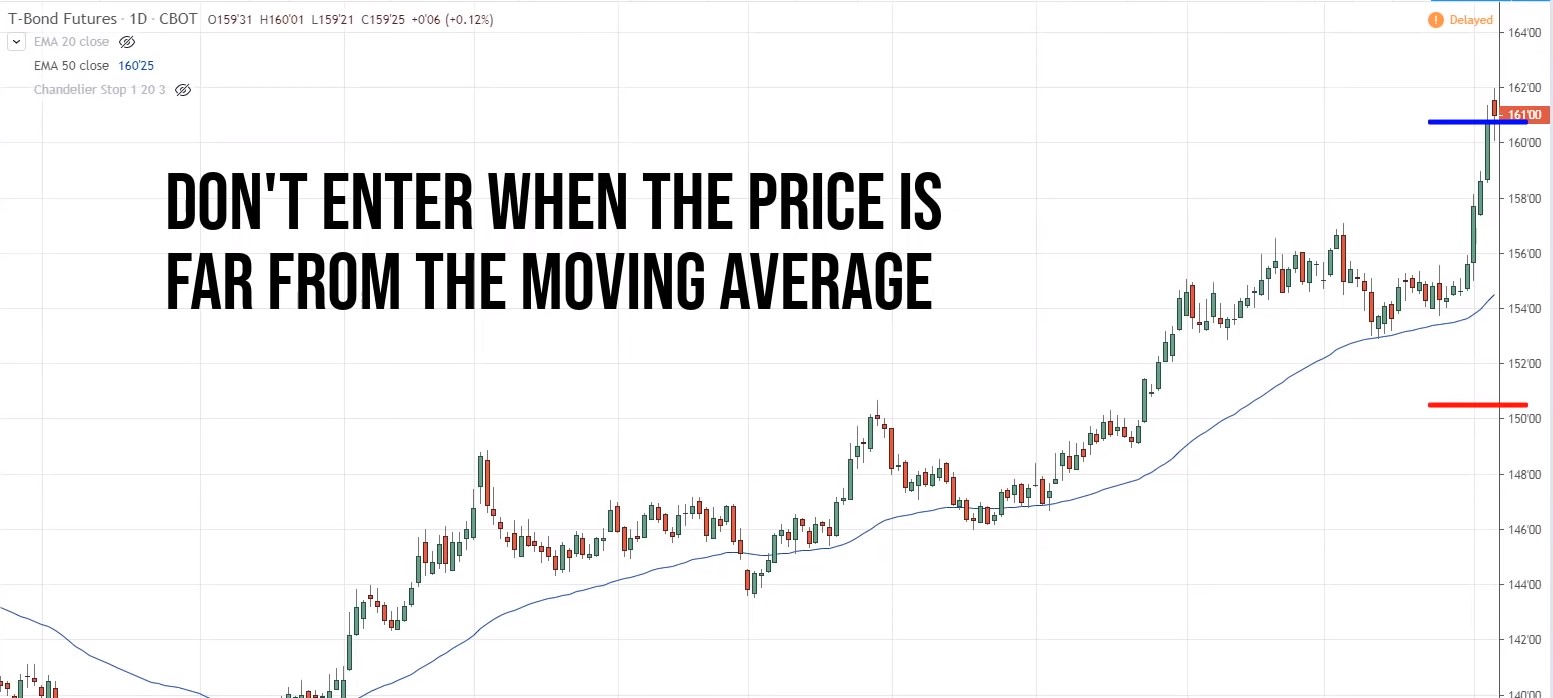
You don’t want to be buying at this high. Because of the pullback occurs, there's a good chance you’ll get stopped out of your trades unless your stops are pretty wide, let's say below this swing low or somewhere here:
Then yes, there's a good chance that you’ll be able to hold onto the trade.
But let me ask you, honestly, will you put your stops over here? Unlikely, because it's too wide, you’ll get a very poor risk-reward ratio. That's why you don’t want to be buying when the price is far away from the moving average.
More often than not, you’ll get stopped up on the pullback here. And also when the price is far away from the area of value, the market is likely to do a pullback.
This is the first tip that I have for you, don't trade with the price is far away from the area of value and this can be moving average, trendline, etc.
2. Don't chase breakouts
I know it's exciting to chase breakouts, “Look, Rayner, look at how bullish that candle is! Look at the strong momentum, it's time to buy, buy, buy!”
And when you do that, the market is more likely to do a pullback and you’ll probably get stopped out as well. Because the reason is that when you chase breakouts, it is near difficult to find a logical place to set your stop loss.
Example #1:
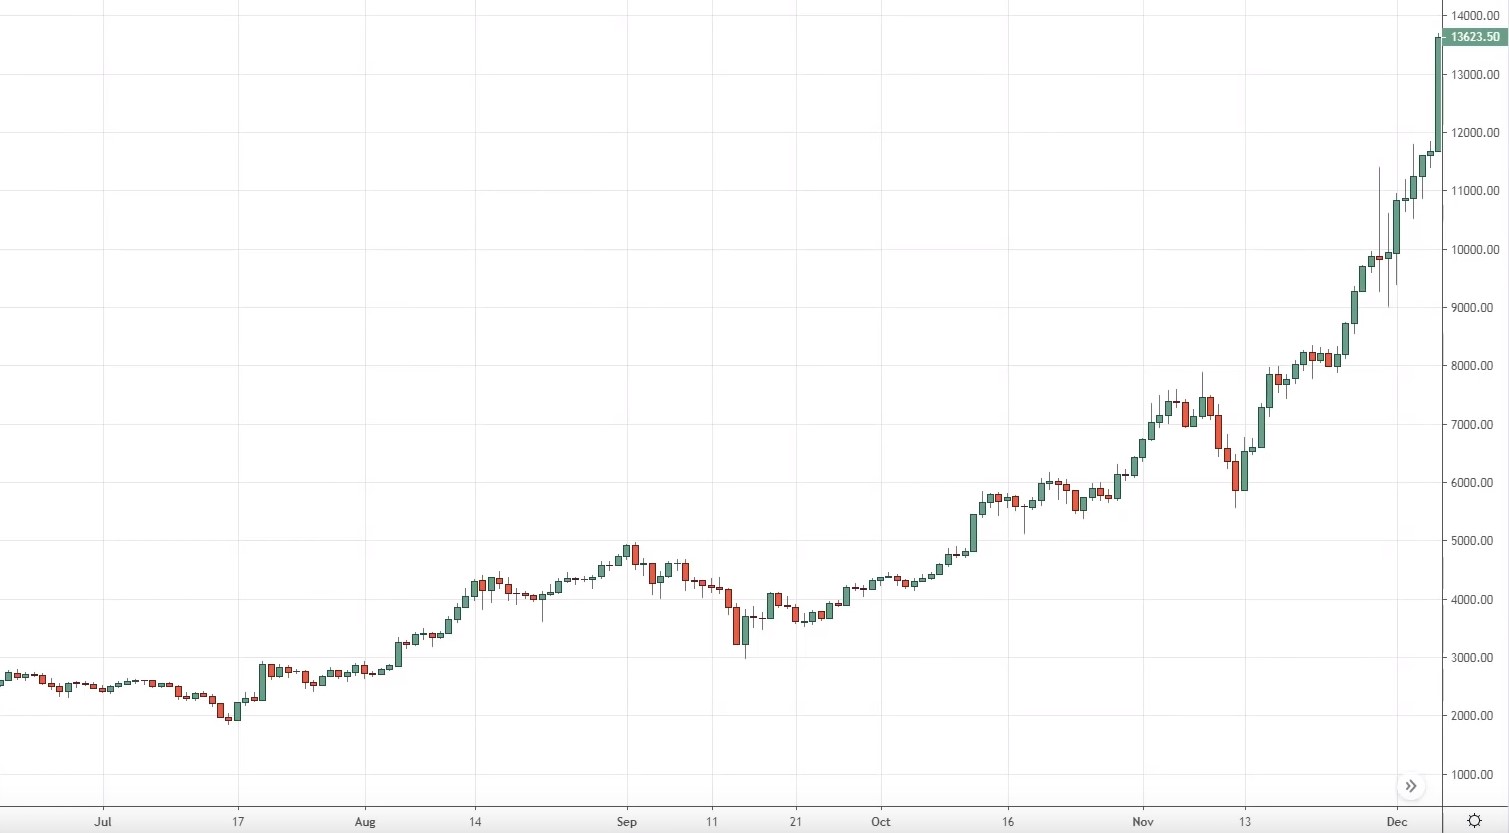
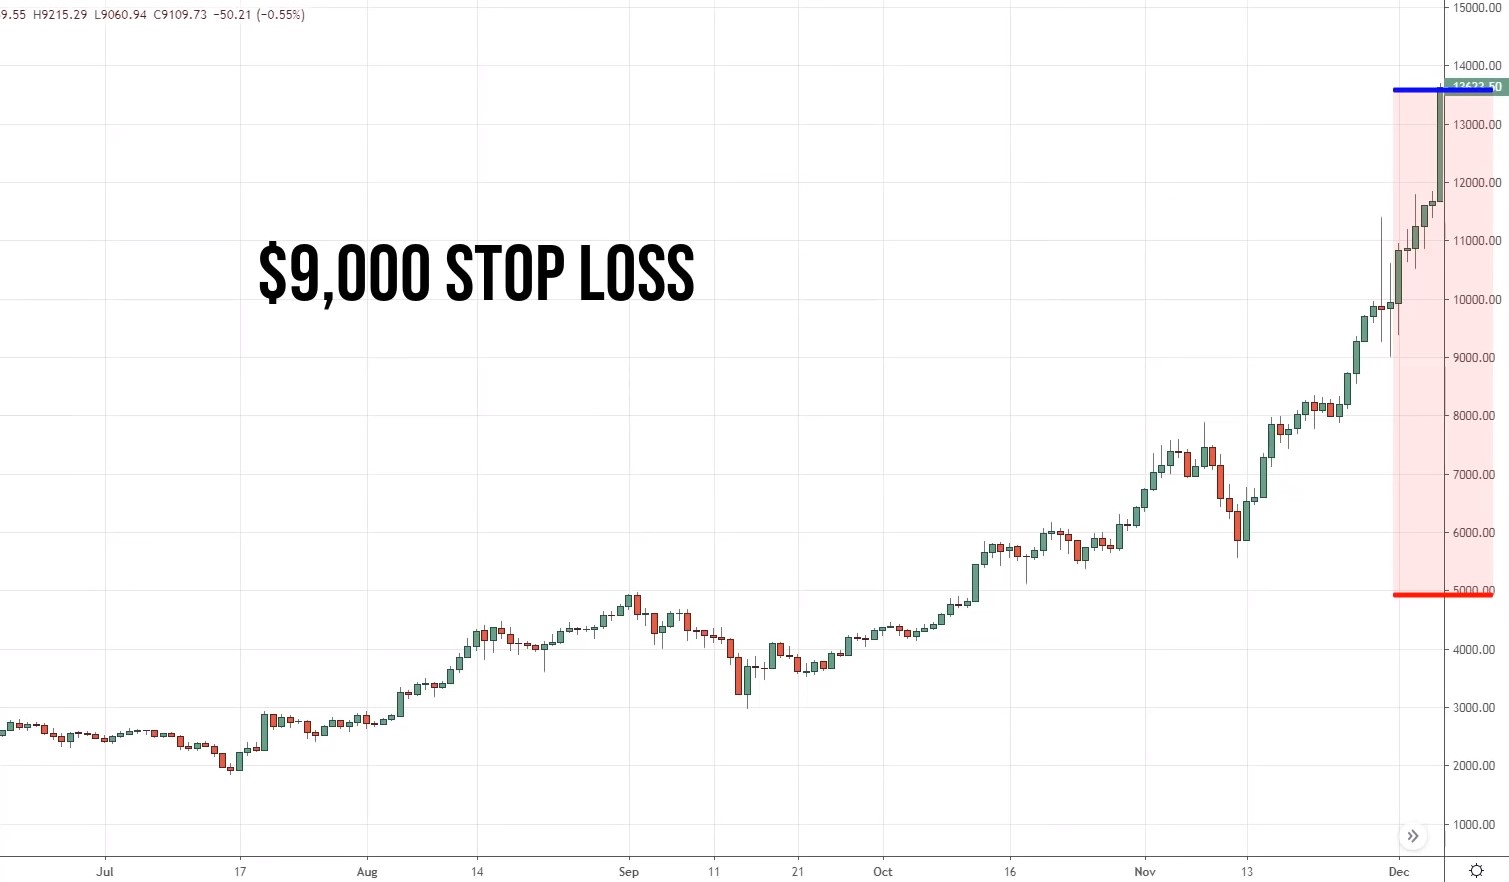
Let me give you an example of this. Let's talk about Bitcoin, this is the market that many traders chase into the $20,000 price level.
Bitcoin hit the highs of $20,000 before it reversed. Before it reversed, look at how bullish the price action is:
Traders will be thinking, “Oh, the market is going to the moon!” I even see commentaries of Bitcoin, someone predicting Bitcoin going to $100,000.
If you look at this, ask yourself, honestly, where are you going to set your stop loss?
Where is a logical place to set your stop loss? And if you look at this chart, there is no logical place to set your stop loss unless you're willing to swallow a stop loss of this from this highest all the way down to let's say the previous swing low:
Your stop loss is about $9,000 on Bitcoin. Let me ask you, will you have a $9,000 stop loss on Bitcoin? Let me phrase it another way, for you to make a one to one risk-reward ratio in Bitcoin, the market has to move $9,000 in your favor. That's ridiculous.
That’s why you don't want to be chasing breakouts because:
- There's no logical place to put a stop loss
- More often than not, the market is will do a pullback or consolidate
And when that happens, you’ll again likely get stopped out of your trades.
Why is that? Because for most traders, they'll just put some random stop loss on the chart wherever their accounts justify. Will the market care where your stop losses?
No. It’ll reach back to the nearest market structure like the previous swing low or previous resistance turned support. That's where potential buying pressure would come in. It doesn't care where you've set your stop loss and that's why you get stopped up.
Example #2:
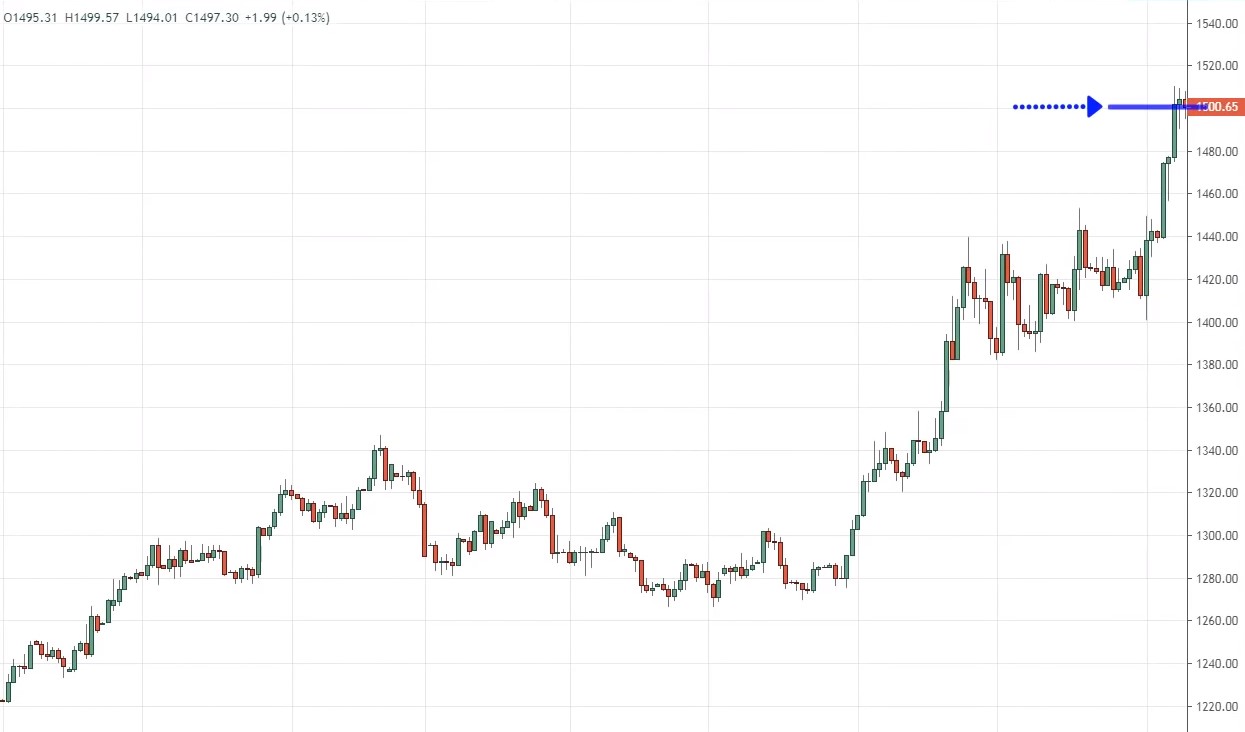
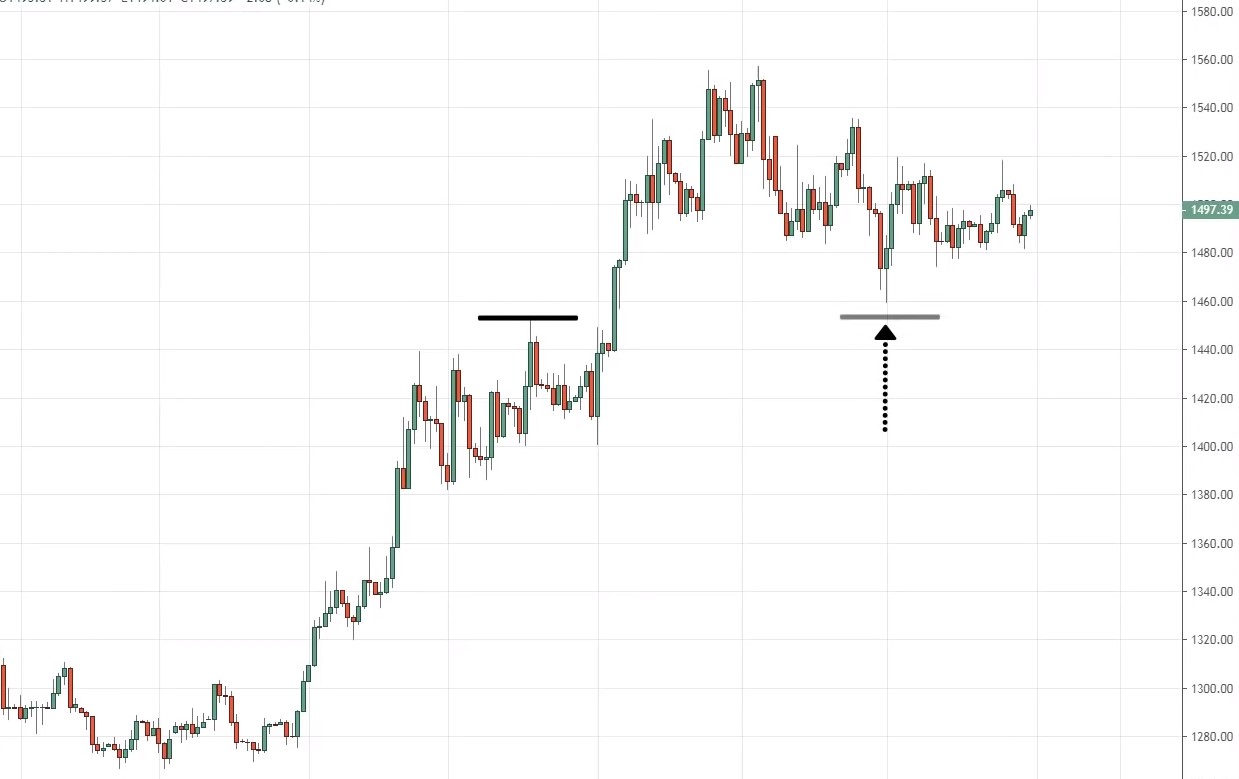
Another one is Gold. At this juncture, you don’t want to be buying at these highs:
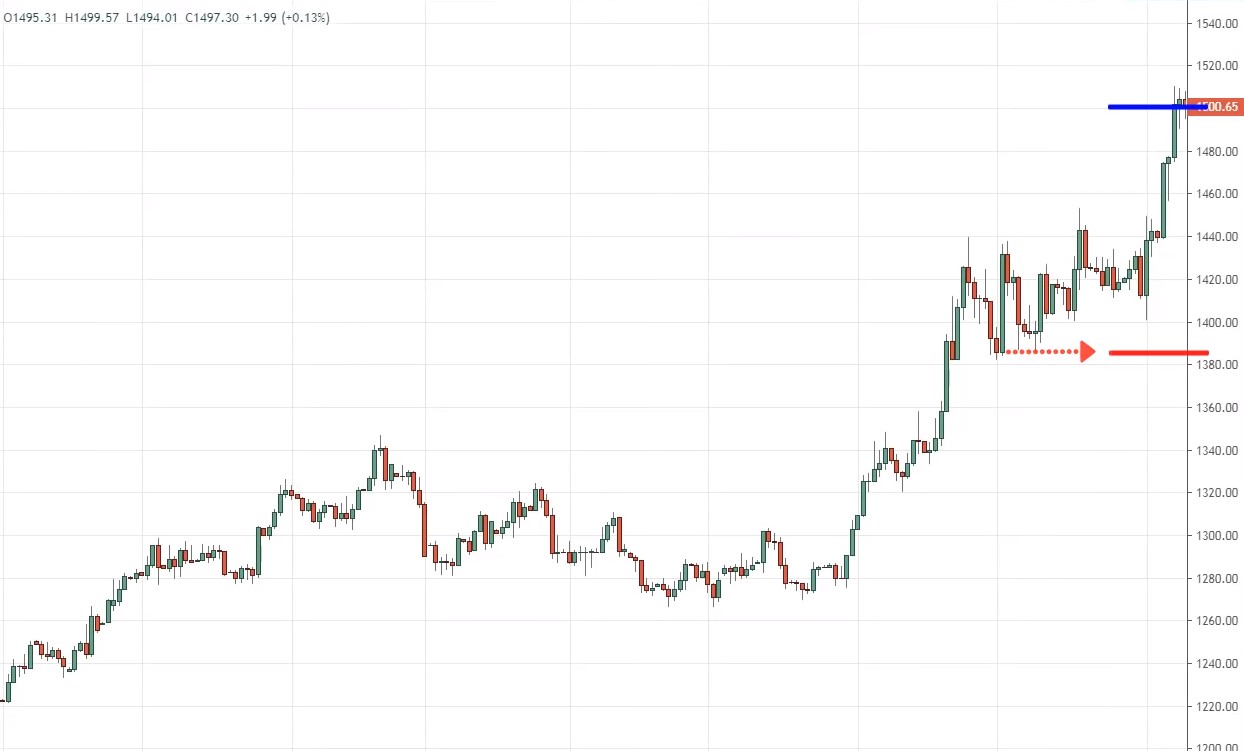
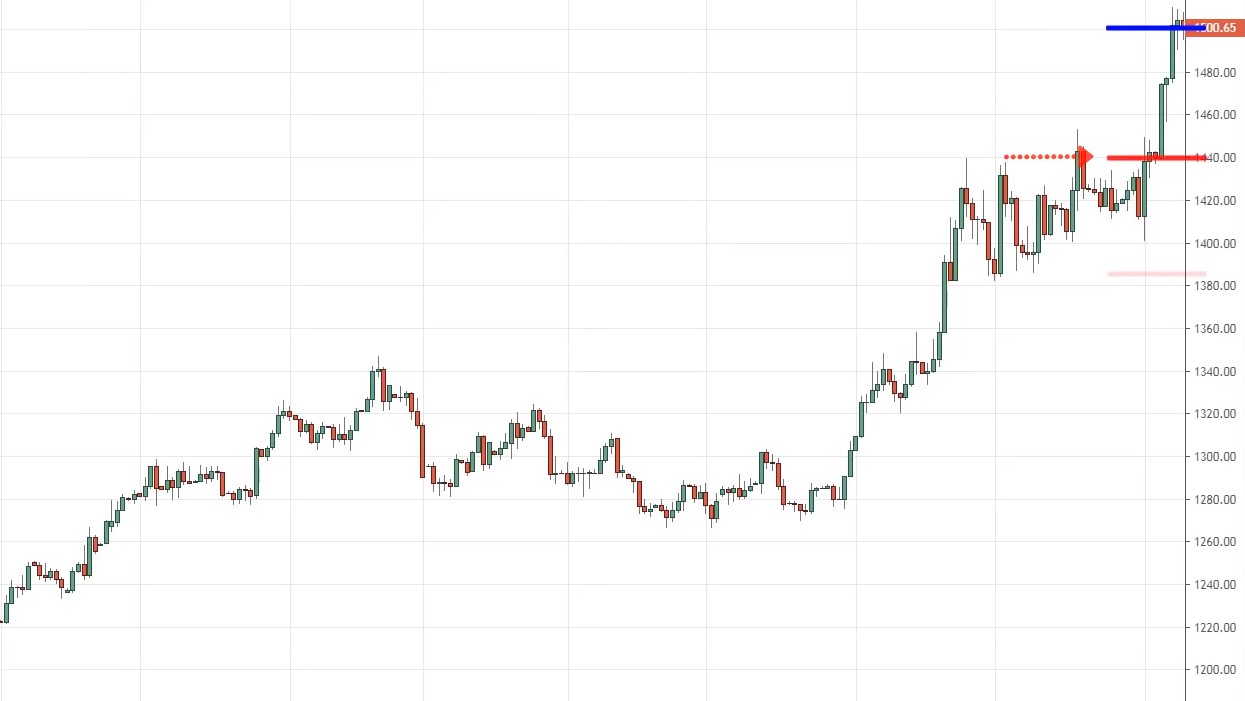
Because you'll be chasing the market. If you want to do it, where's the logical place to set your stop loss? A couple of options…
Option 1, below this, this swing low over here:
Option 2, could be this previous resistance turned support:
You could even set it somewhere slightly below that as well.
If you look at this chart, do you want to be chasing this market? Although this is not as bad as the Bitcoin one, I would rather stay out of the trade. Because if you can’t set a logical stop loss, then when the market does a pullback or consolidates, you’re going to get stopped out.
This market did almost retest this previous high over here, where it became a previous resistance turned support:
You can see that if you set your stops at random levels based on what your account feels like or whatever money is left in your account, you’ll probably get stopped out.
So the second technique, I want to share with you is that don't chase breakouts. And in fact, this is just a variation of the first technique I just shared with you. They are kind of similar but different.
Moving on...
3. Don't trade into obstacles
What do I mean by this? Let's say you're bullish and you want to buy it. But when you buy, you don't want to be buying at this price level over here:

You don't want to be buying here because there’s an obstacle coming in your way, which is this area of resistance. If you buy it over here, the market could possibly just go up a little bit in your favor and then collapse back lower back towards the area of support.
You also don't want to be shorting into support, because that's where potential buying pressure could be coming to reverse the price against you. And you’ll likely get stopped out.
Example #1:
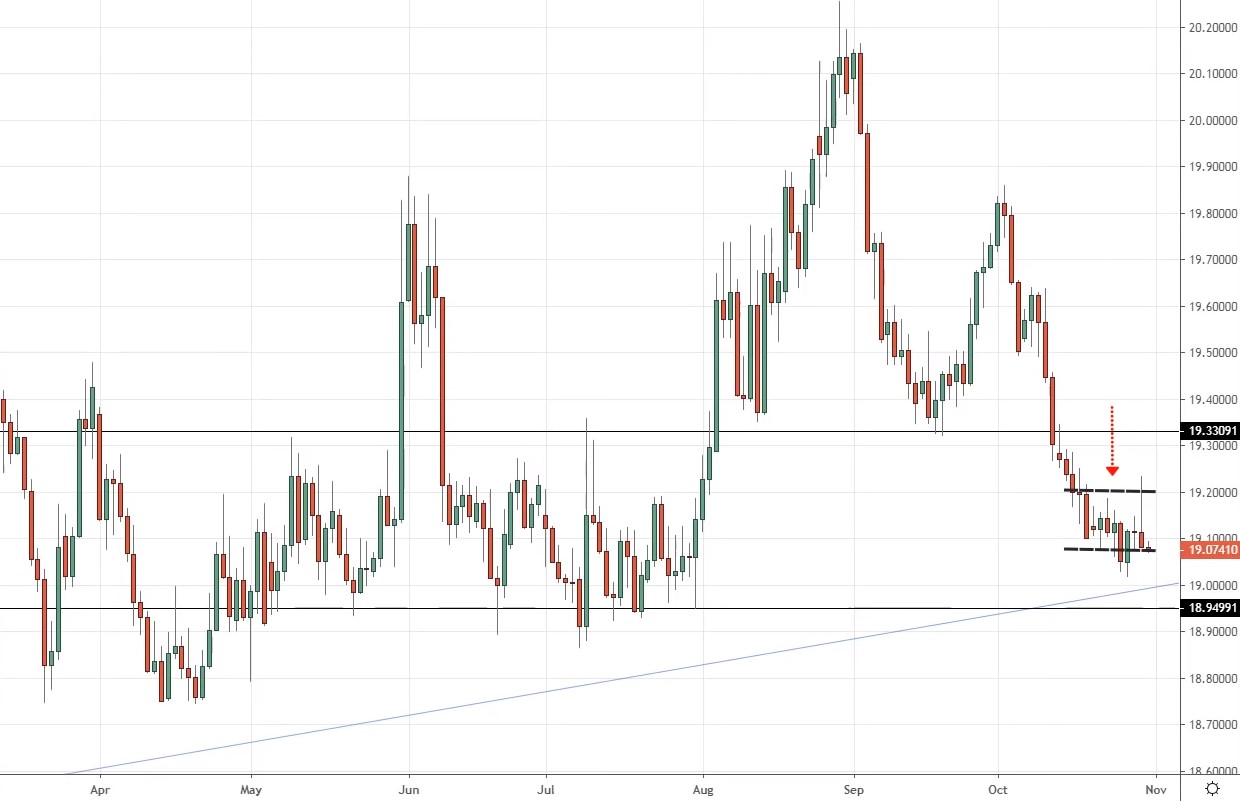
Let me share with you an example of USD/MXN. You can see that now price is consolidating a little bit over here:
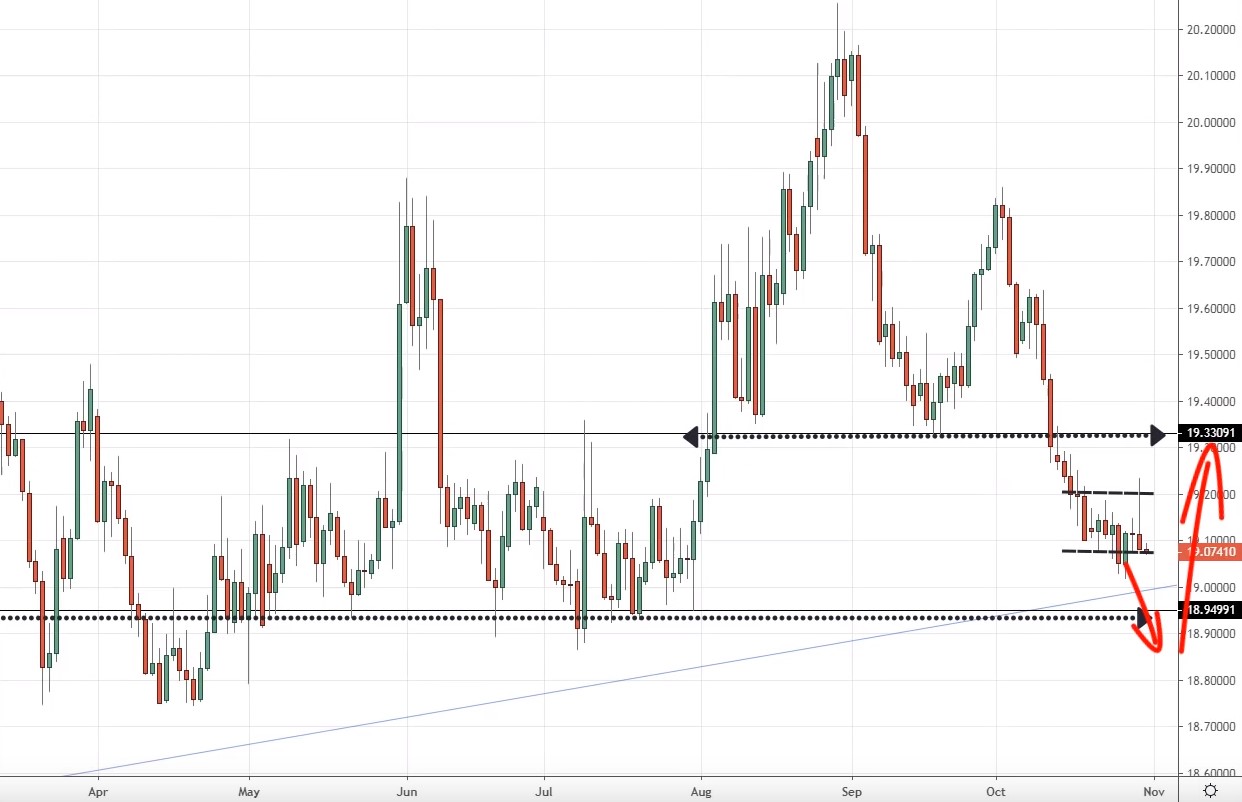
But do you want to be shorting over here? I hope not. Because if you look left, you’ll notice this area of support around the $18.90 level.
This means even if the market does break down below this lows, it could just trickle down lower a little bit before buying pressure could potentially come in and push the price up higher, possibly retesting back this previous support now turned resistance:
So don't trade into obstacles. This is important. If you just apply this one technique, you’ll realize that a lot of trades will be filtered away because most of the time the price is just in no man's land or it's near an obstacle, so it's a trade that you want to skip altogether.
Example #2:
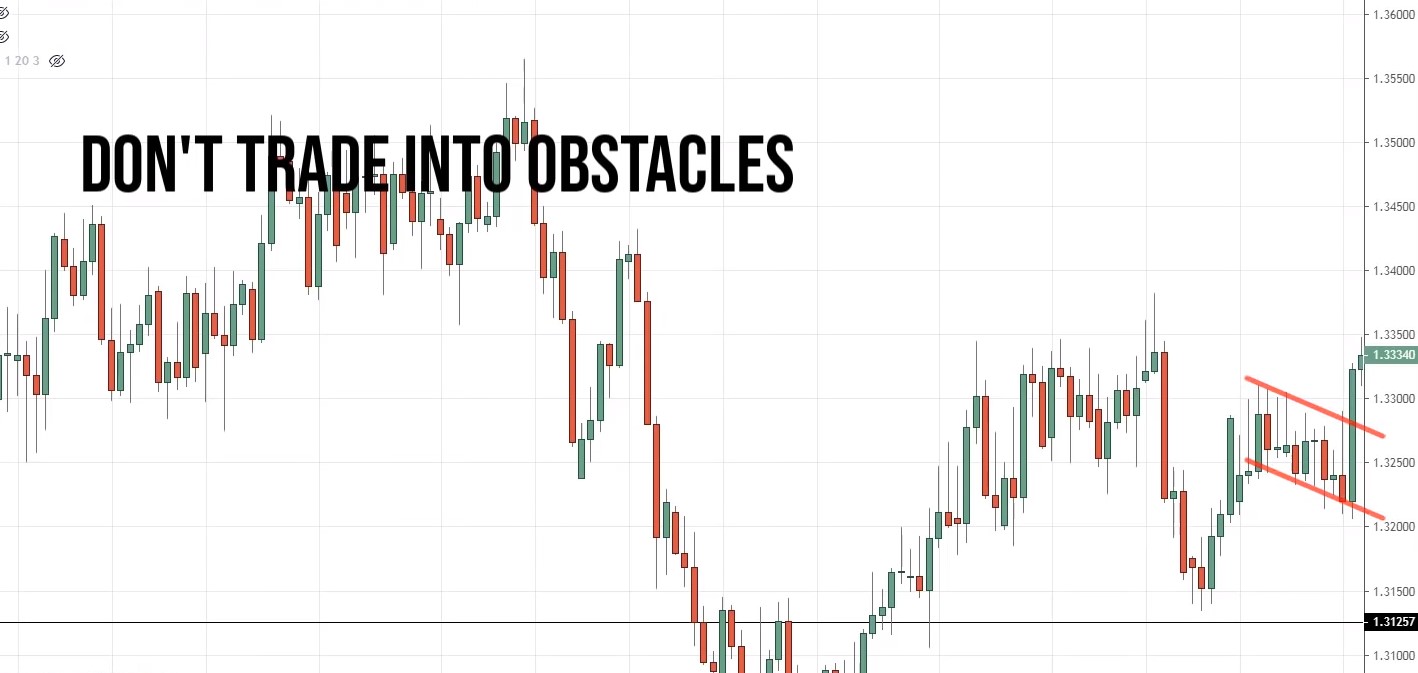
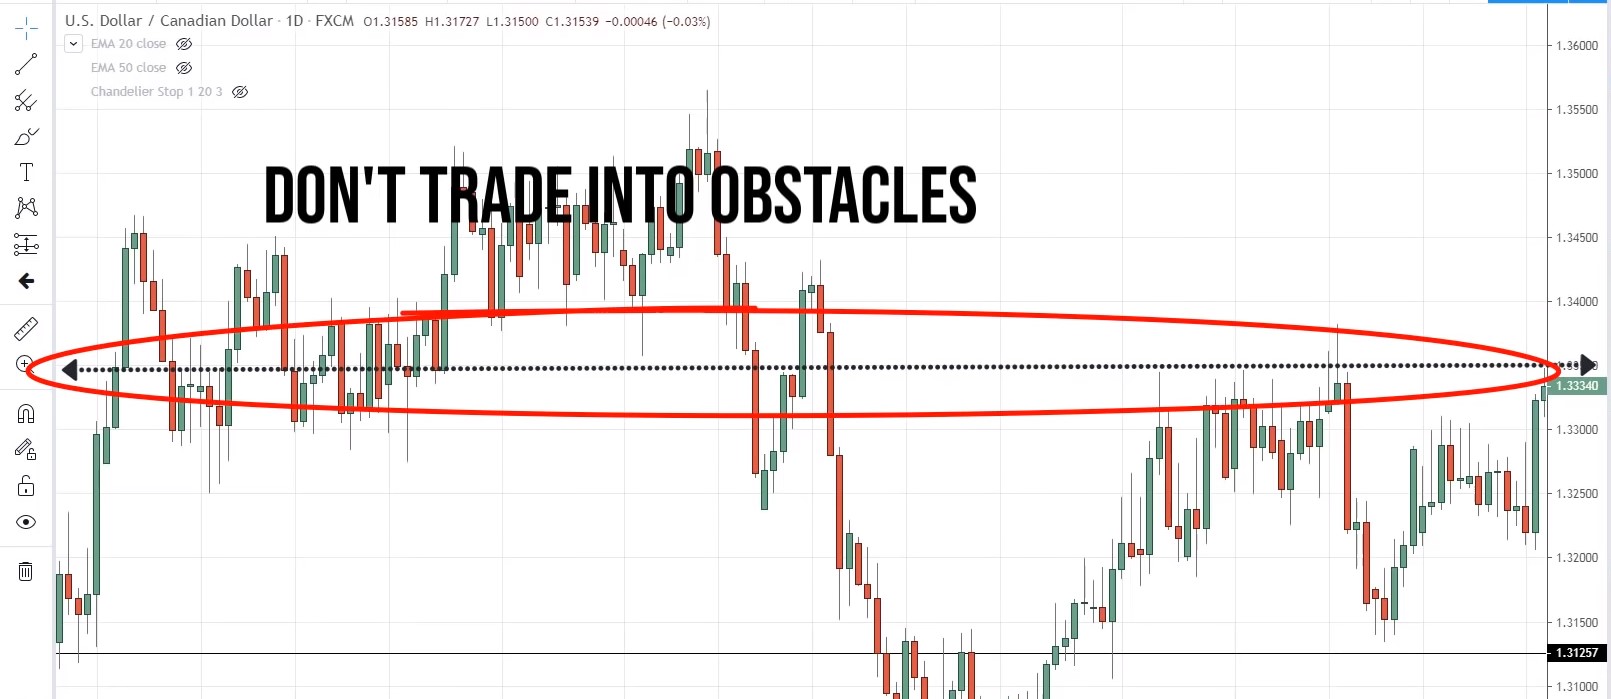
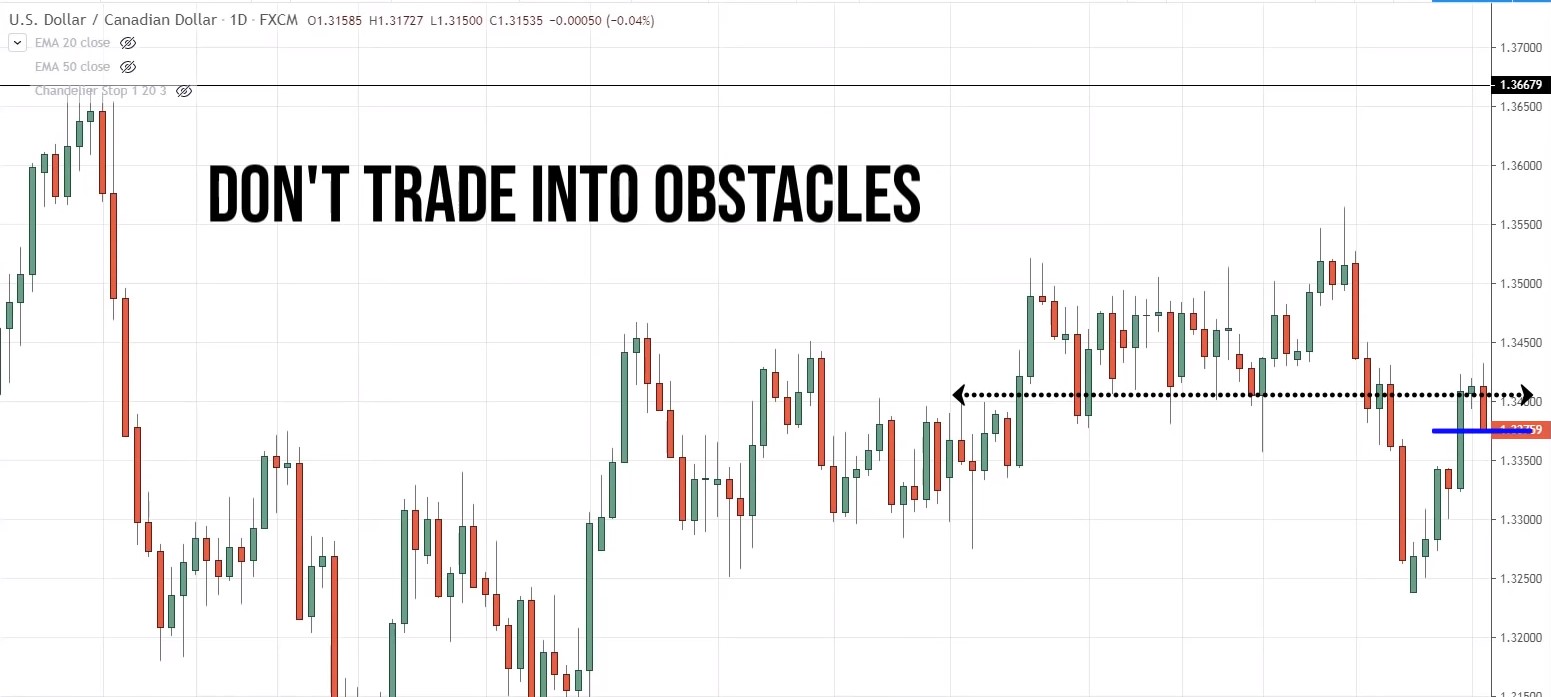
Let me share with you another example, the USD/CAD.
Traders will look at this and say, “Rayner, look at this bull flag pattern, the price goes up higher, and there's a retracement, then the price breaks and closes above this swing high. The flag pattern is completed, let's buy!”
And where are they buying into? Smack into this swing highs, into this area of resistance:
That's where potential selling pressure is lurking. You don’t want to be buying into an obstacle. In this case, the market then reversed down lower from here.
Let me explain, how you want to approach it when you enter your trade.
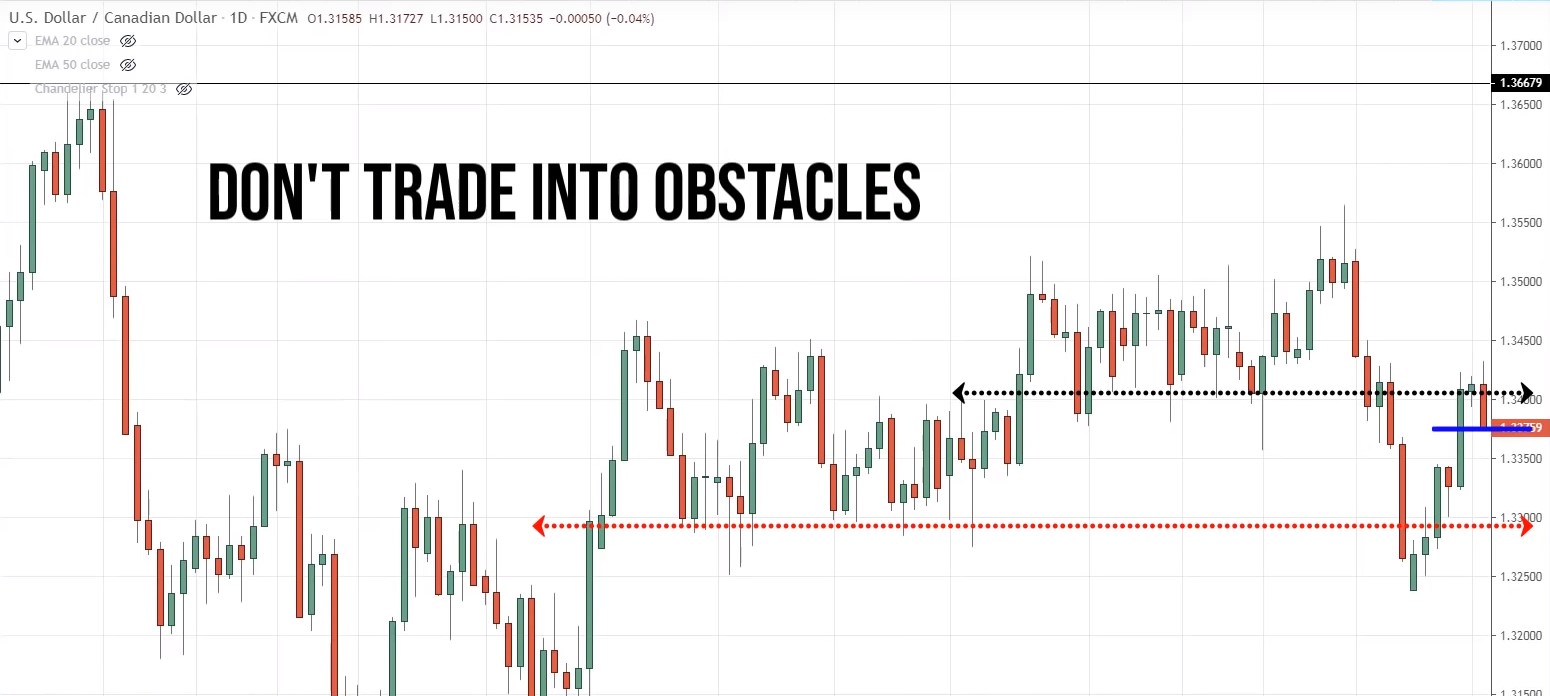
Enter from an area of value
You want to enter from an area of value. You want to enter where the price could potentially move that justifies the risk you're taking on your trade, known as the risk-reward ratio.
In this case, hypothetically, let's say this top line is resistance and you went shot somewhere here:
Ask yourself, where’s the nearest obstacle on this chart now? The nearest obstacle is possibly at this area level over here at this point:
From your entry point to the first obstacle, there’s enough meat in the move to justify picking the trade. And these are the things that you want to look out for, whether there’s enough meat in the move to justify taking the trade.
This is what I mean by don't trade into obstacles:
- Avoid shorting into support
- Avoid buying into resistance
Now the next technique that I want to share with you is called…
4. The BOS technique
It stands for Break Of Structure. And in this approach, you’re looking for confirmation that the buyers are in control before you establish a long position. Or if you want to short, then you want to see that the sellers are in control before you establish a short position.
Let's say market approaches into an area of resistance. You don’t want to be just selling at this area of resistance because you have no idea whether he might push up higher before it reverses or maybe it might just break out of resistance altogether.
You want to look for confirmation, that the sellers are stepping in before you take a short position. And one technique to share with you is what I call the Break Of Structure technique.
Let's say earlier the price reached resistance on the Daily timeframe. You can go onto a lower timeframe, let's say the 2-Hour timeframe and look for a break of market structure.
And what I mean by look for a Break Of Structure is that you want the market to show you a series of lower highs and lower lows before you take in a short position.


At this point, you don't have a lower high and lower low telling you the sellers are in control and about to push the price lower. This is one way to identify the strength or weaknesses in the market.
This is what I call the Break Of Structure technique.
Another very common variation to it is a classical chart pattern. For example, the price comes up higher, then it forms a head and shoulders pattern.
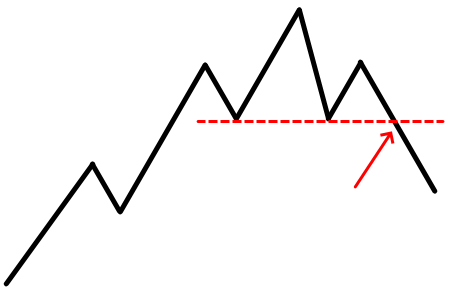
Or maybe price starts to consolidate and then form lower highs into support before it breaks down:
This is getting another Break Of Structure. There are a few variations to it, but if you understand price action, you’ll understand all the different nuances that come along with it.
Let me share with you a few examples of this.
Example #1:
The first one is the AUD/JPY.
At this point, the market came into this area of previous support turned resistance. Again, you have no idea where the market is going to reverse.
But if you use the Break Of Structure technique, you could go down to the 2-Hour timeframe, and see where the Break Of Structure technique come into play.
This is the resistance you saw earlier on the Daily timeframe:
On the 2-hour timeframe, you can see the sellers are starting to come in to take control of the market. You'd notice that previously you have a series of higher highs and higher lows.
But at this juncture, when the price broke below this area of support here, you now have lower high and lower low, and this tells you that the sellers are now in control. There's a good chance the market could continue lower from here.
I'm not asking you to trade this particular pattern in isolation. I'm not asking you to trade descending triangle, head and shoulders pattern in isolation. What I'm sharing over here is just to look for confirmation that the sellers are in control before you take a short trade.
Because you've seen the earlier on the higher timeframe, the market is in a downtrend at an area of resistance and what we're looking for is just sort of like an entry trigger, a confirmation that it's time to enter the trade.
This is what I mean by the Break Of Structure technique.
Example #2:
Let's look at NZD/USD.
Market at this point retested previous support turned resistance. But here's the thing, If you trade live, you’ll always be wondering which resistance will the market retest:
There’s a lot of possibilities when you're trading in the live markets, you’ve no idea at which exact level the market will reverse. This is where the Break Of Structure technique comes into play.
Again, go down to the 2-Hour timeframe. At this point, what you have is something like a quintuple top, and tested resistance 5 times. And then this is the area of support:
Price broke down and formed this somewhat of a bear flag looking pattern, and when it
breaks below the swing low, you have a Break Of Structure, you have a lower low and lower high. This tells you that it's a good chance the market could continue lower from there.
And this is how you use the Break Of Structure technique, to let the market show signs of strength or weakness before you enter a trade.
5. Don’t put your stops at obvious levels
I don't know how many times I've come across, books, courses or forums which tell traders to place their stops below support or above resistance because that's what the books say, that's what the guru says.
Well, the problem with putting your stops at obvious levels is that they get hunted very easily before the market reverses back in your favor.
Let me just share with you a few examples.
Example #1
If you look at this over here the GBP/USD over here:
The market broke down below the area of support. It's bearish, and it forms somewhat of a pullback. Traders either went short on the break of the swing low or on the break of the downward trendline.
But where would they put the stop loss at?
Most traders put a stop loss somewhere here:
And the problem with setting your stops at this level is that it's very easy to get stopped out. Because at these 3 price points, there’s nothing to stop the market from heading higher.
There’s no other swing high nor resistance. You can see that afterward, the market did another pullback, wiping out all the stops only to reverse down lower.
If you're always getting stopped out and you see the market reverse back to your favor, it's probably because of this.
How should you handle this? Well, give your stops more breathing room.
Set your stops away from the market structure. When you set your stop loss, you gotta ask yourself, where’s the market structure. Give it some breathing room, give it some buffer.
And one way you can do it is to use the ATR indicators. I usually go with 20-period, but in this case, the default is 14 period. But it doesn't matter actually.
And what you want to do, is to find out what’s the ATR value. in this case, the ATR value is about 80 pips:
You’ll find out what is the highs over here, and you just plus 80 pips to the highs. If you do that, you can see that even if the market spiked above the highs, your stops should be away from it, and you won’t get stopped out prematurely.
Example #2:
One more example, NZD/JPY.
Price pulls back, then breaks down. Then where would traders set their stop loss? Again, probably above this high because that's what the textbook says.
In this case, you probably get stopped out as the market retest the levels twice and then reverses from here:
I'll be honest, even if you set your stop 1 ATR from that high is you’ll still get stopped out.
It's not foolproof, but it should prevent, or avoid losses for you, especially if you have the tendency to just set it in the middle of nowhere, or just above the highs or the lows. This technique will help you.
It's not foolproof. Nothing here is foolproof. Trading is all about probabilities, never certainties, and you've got gotta embrace it.
With that said, let's do a quick recap...
Recap
- Trade near an area of value
- Don’t chase breakouts
- Don’t trade into obstacles
- Don’t enter your trades too early. Use the BOS technique to time your entry
- Set your stops away from Market Structure

