#7: What is a Hammer
Lesson 7
What is a Hammer Candlestick Pattern
So, in this video, we will be discussing Hammer.
It's hammer time!
Anyway, Hammer looks something like this:

Let me walk you through how it works.
Basically, for a Hammer candlestick pattern, the price opens at a high level.
Then the sellers quickly came in and took control and you can see that the price is being pushed all the way down lower.
What happens is that the buyers (the bulls) came in and has taken control back from the sellers, pushing price all the way back up higher.
And finally, closing near the highs of the day.
This candlestick pattern is essentially telling you that there is a tug of war between the bulls and the bears.
And eventually the bulls have won, right?
So, essentially this candlestick pattern is a bullish reversal pattern.
Buyers are momentarily in control.
Ideally, the length of the wick is at least two times the body!
The longer the wick, the greater the price rejection.
So, how you want to define Hammer is that the body is small.
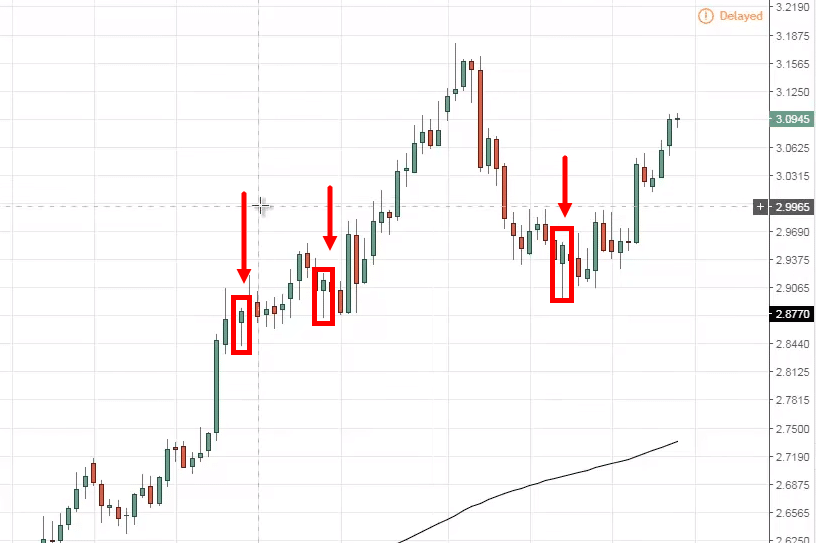
Let me point out to you few a Hammers that you can see on this chart over here:
One thing to clarify is that you might have come across in works or materials online that says that If you spot a Hammer in the uptrend...
It's a sign of weakness, that sellers are stepping in.
For this, I can't agree...
Because when you see a Hammer in an uptrend, to me that is a sign of strength.
Because it tells you that there are sellers coming in.
But, eventually the sellers are overrun by the buyers, and prices now close bullishly higher.
With that said, let's do a quick recap of what a Hammer is…
Recap
- A Hammer is basically a bullish reversal pattern, telling you that the buyers are momentarily in control.
- The length of the wick ideally needs to be at least two times the length of the body. And needless to say, if the wick is much longer than the body, that's created a price rejection.
- And last but not least, don't trade it in isolation.

