#17: Do You Make These Pullback Trading Mistakes?
Lesson 17
Hey, hey, what's up my friend?
In today's training, I want to share with you pullback trading.
I know many of you trade pullback and are making one of these mistakes. And that probably lead suffering a series of losses.
You're trading pullbacks, but not getting the results that you want. Somehow your losses are always larger than your gains.
What is going on?
Well, that's because you're probably making one of these mistakes…
Mistake #1: You only wait at support and resistance
Let me give you an example.
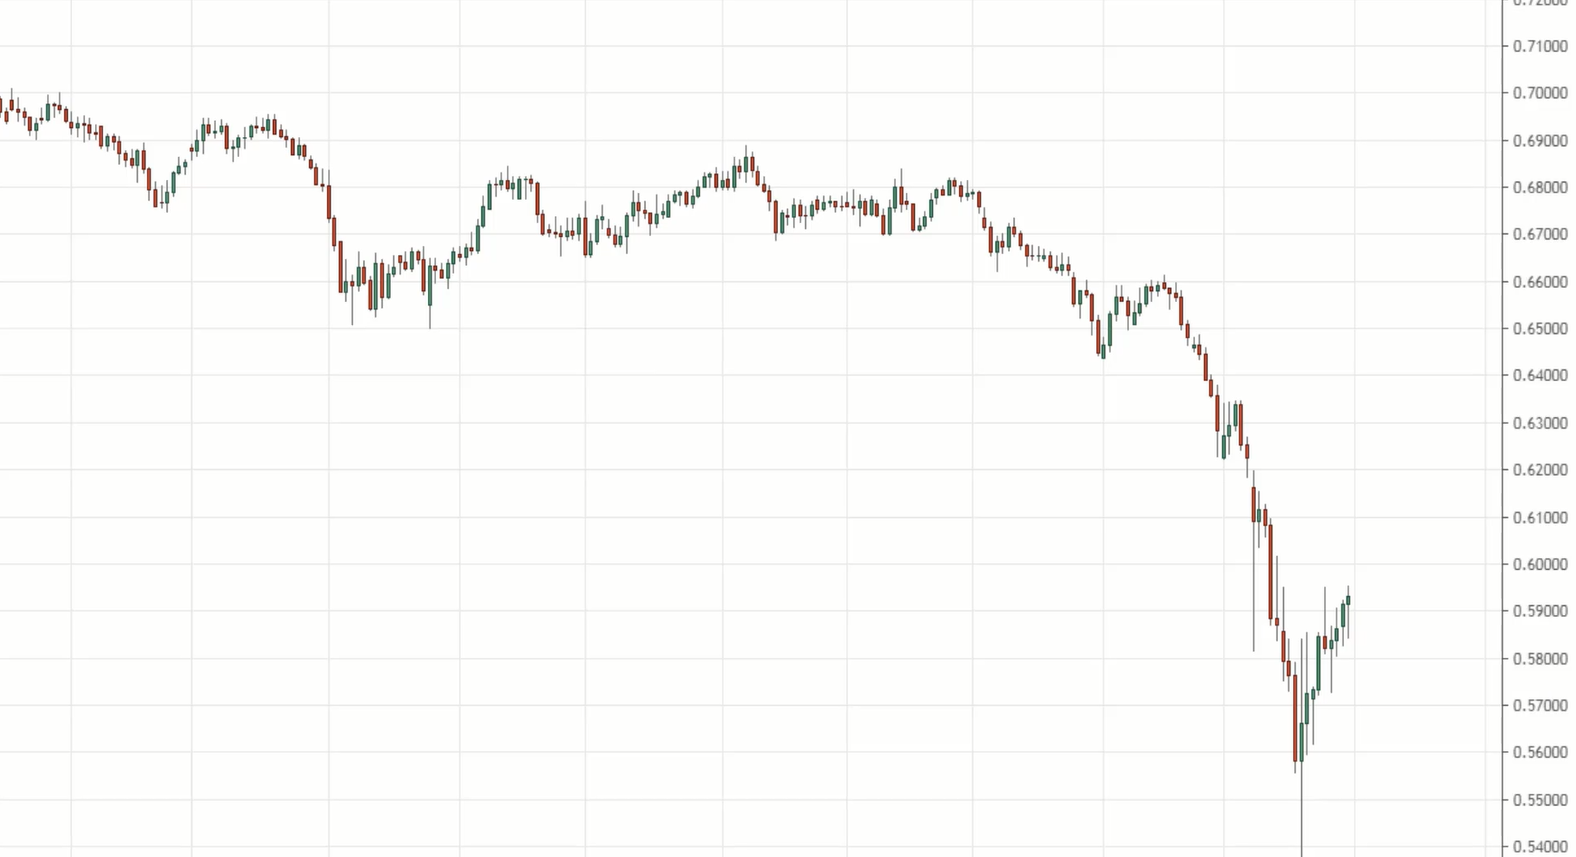
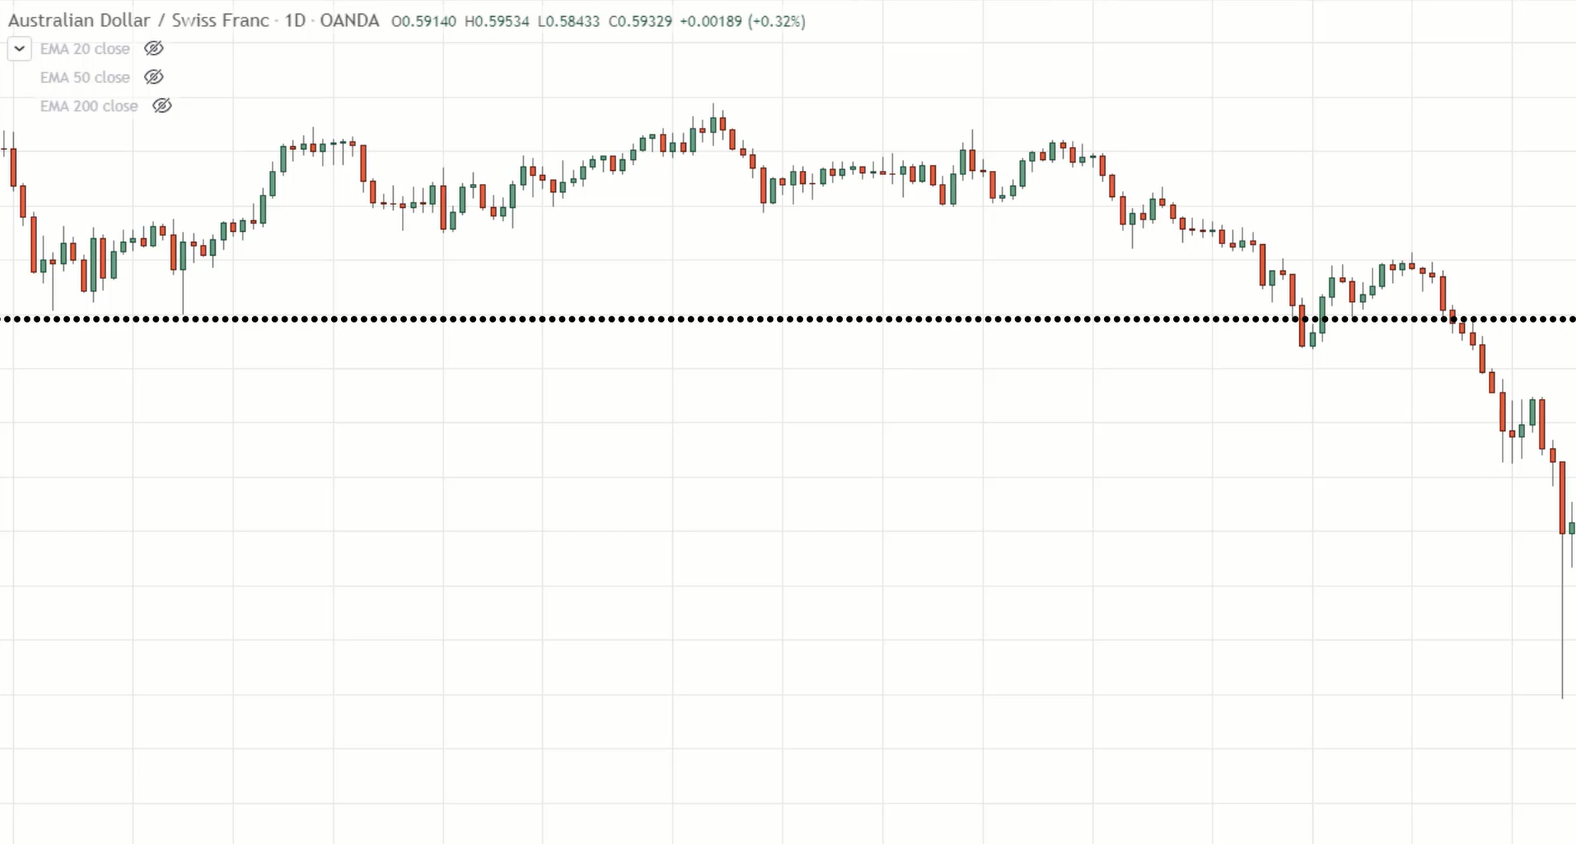
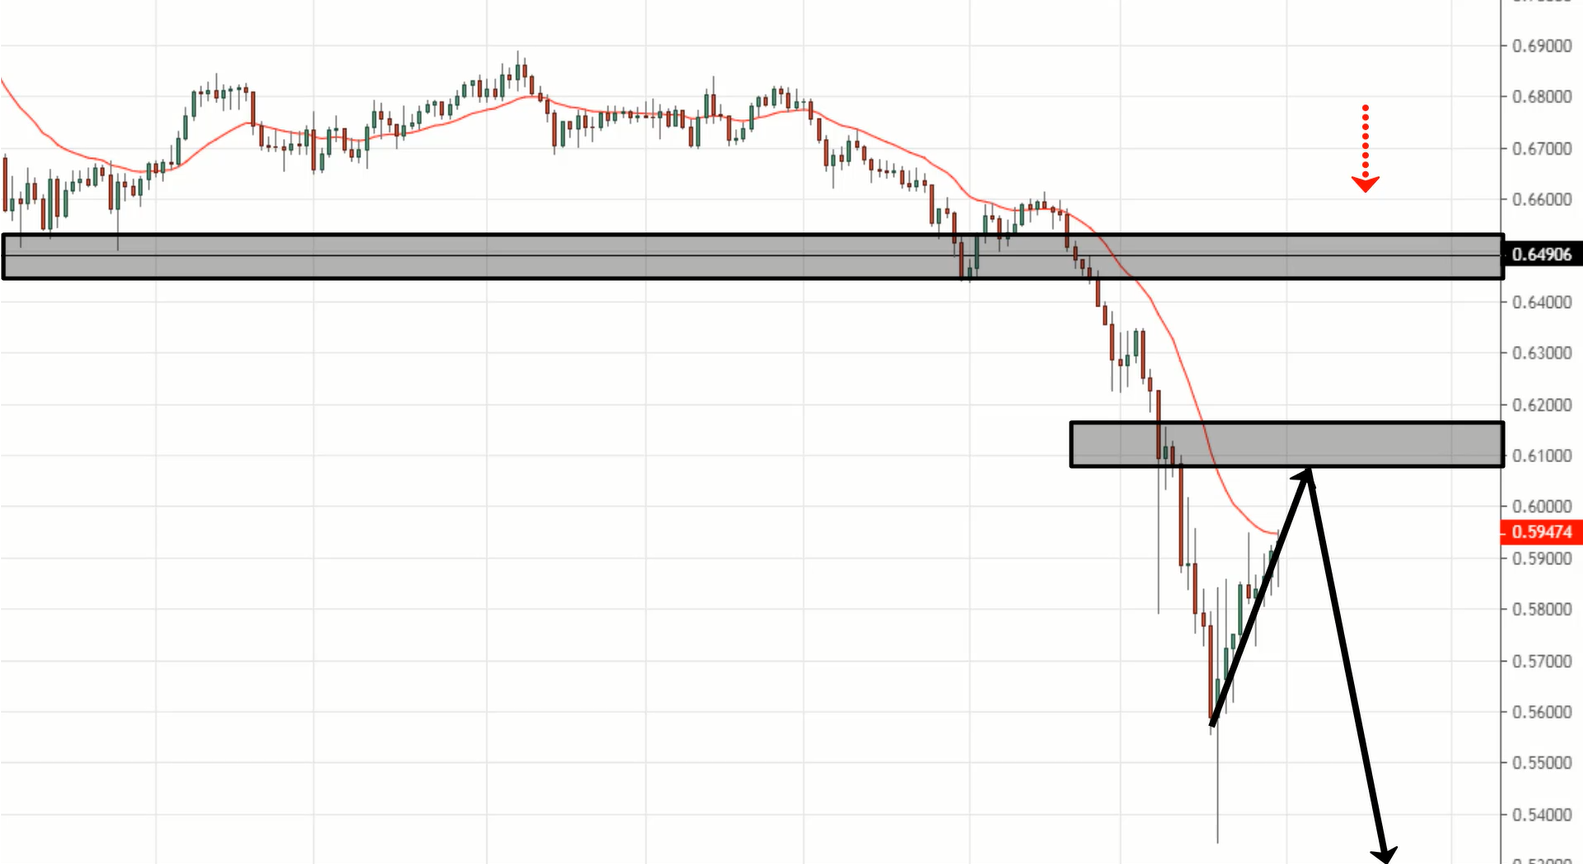
This is a chart of AUD/CHF:
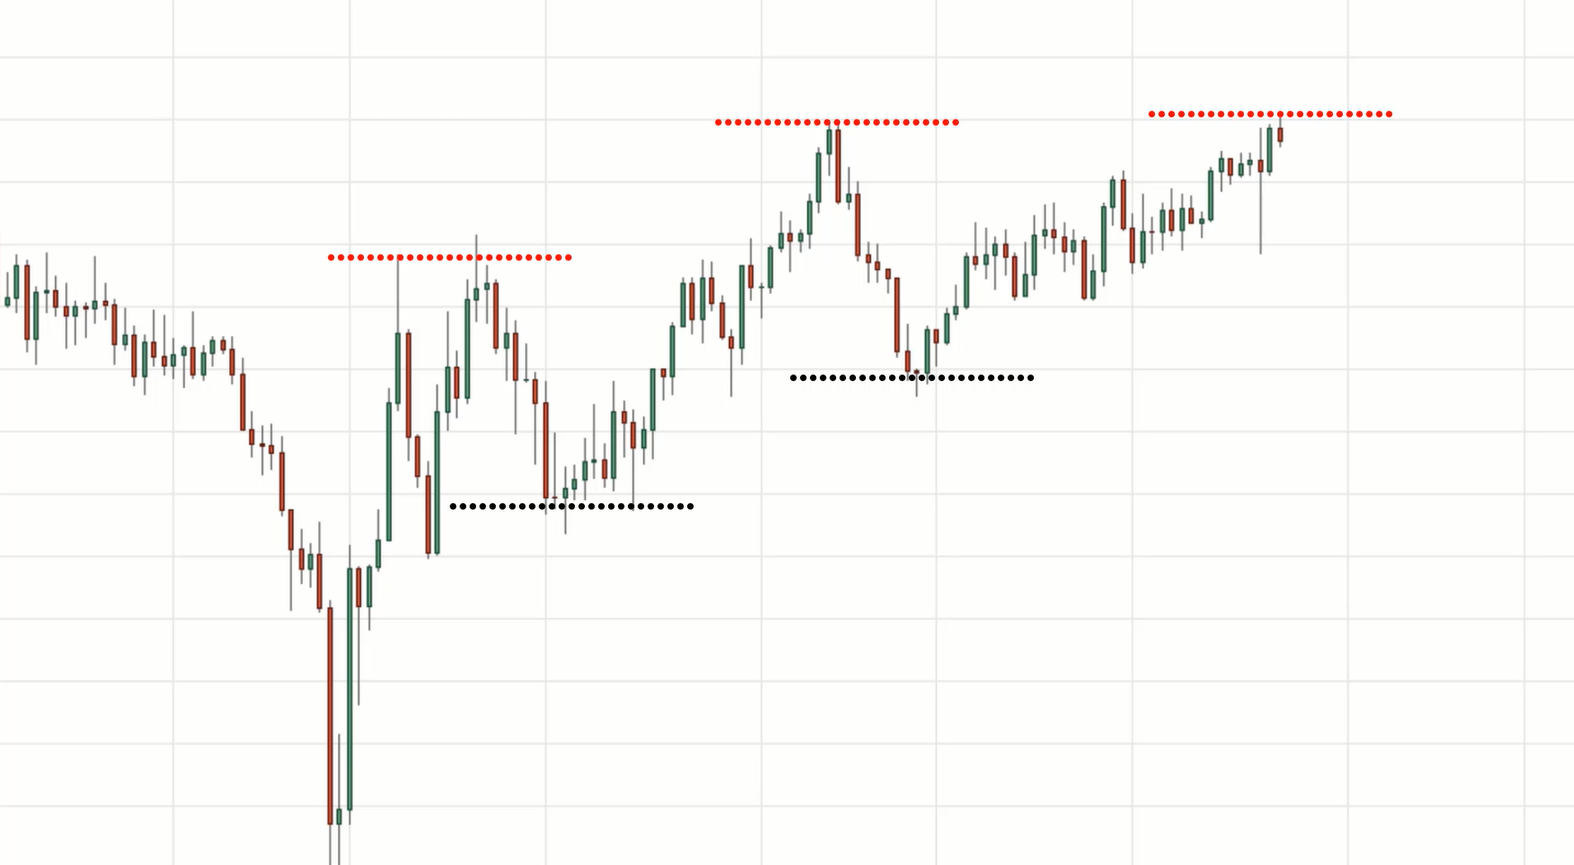
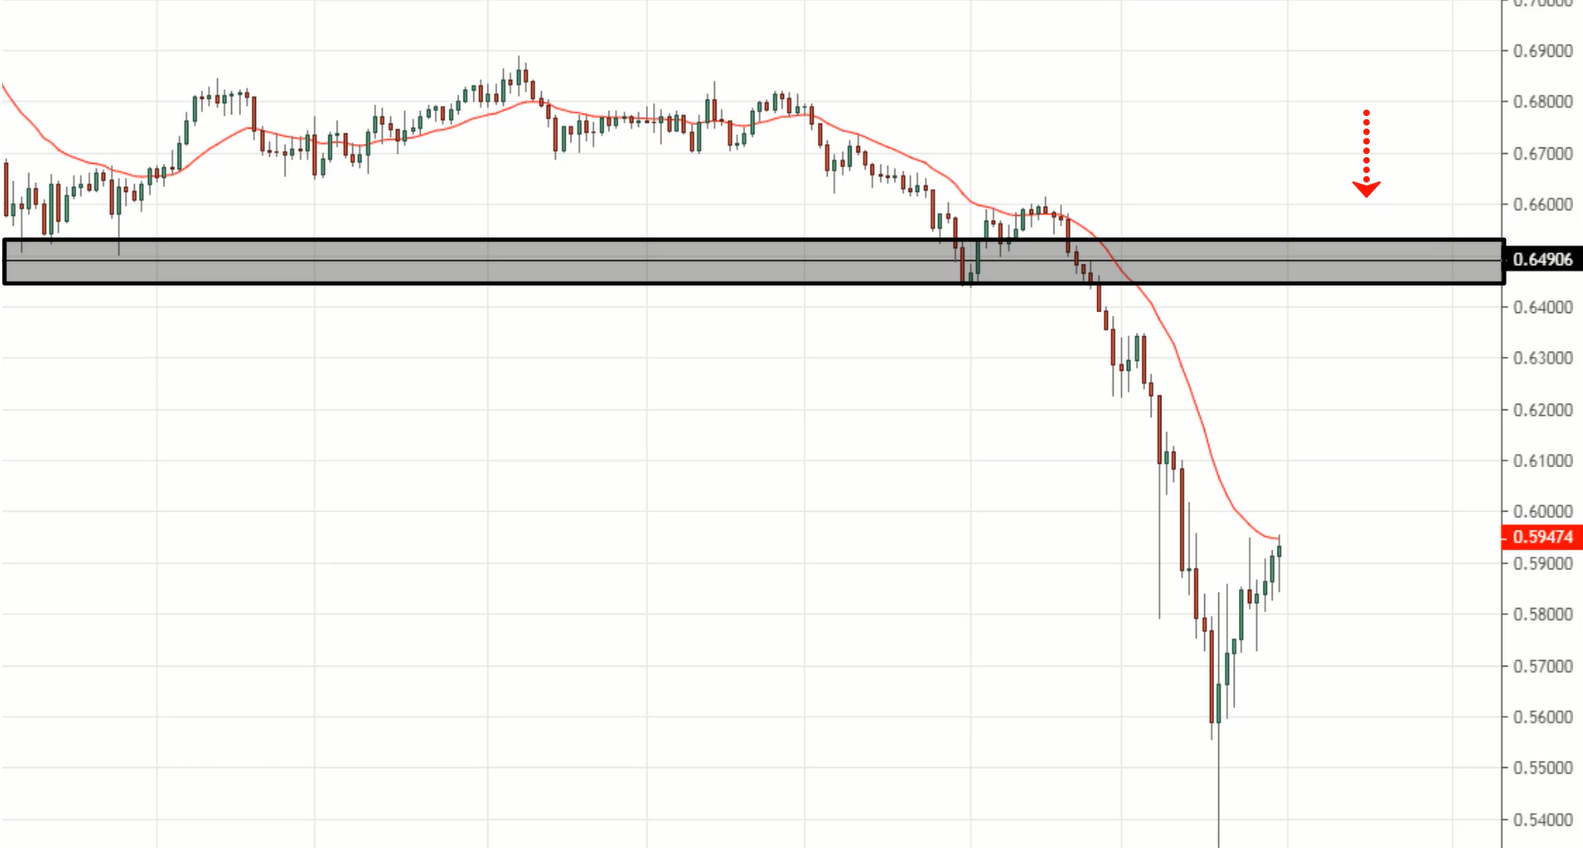
And you can see that this market is in a downtrend. It has lower highs and lower lows.
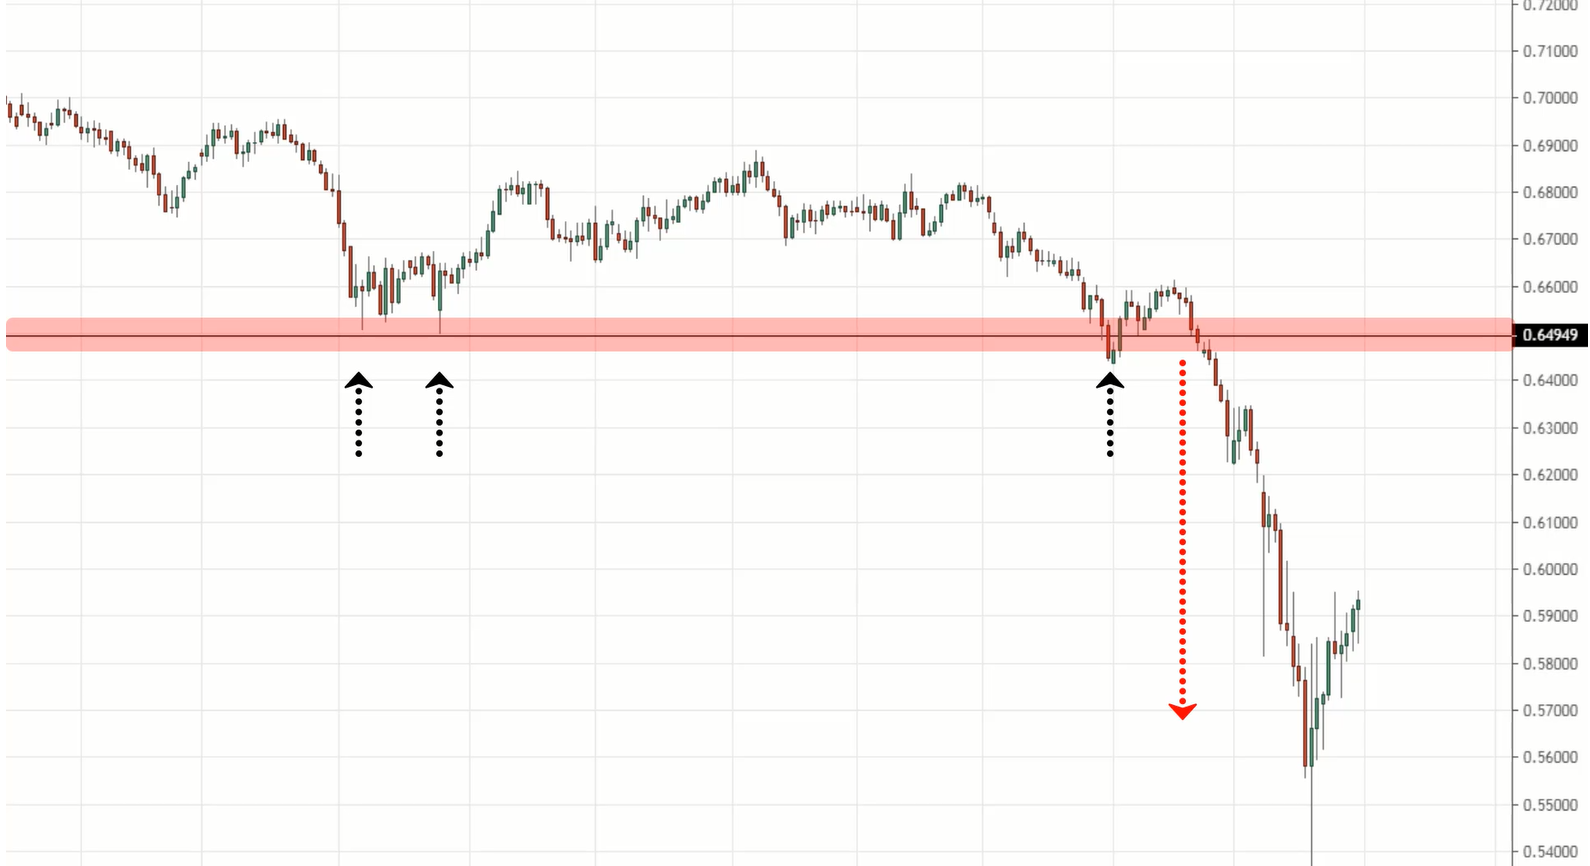
What many traders will plot support over here:
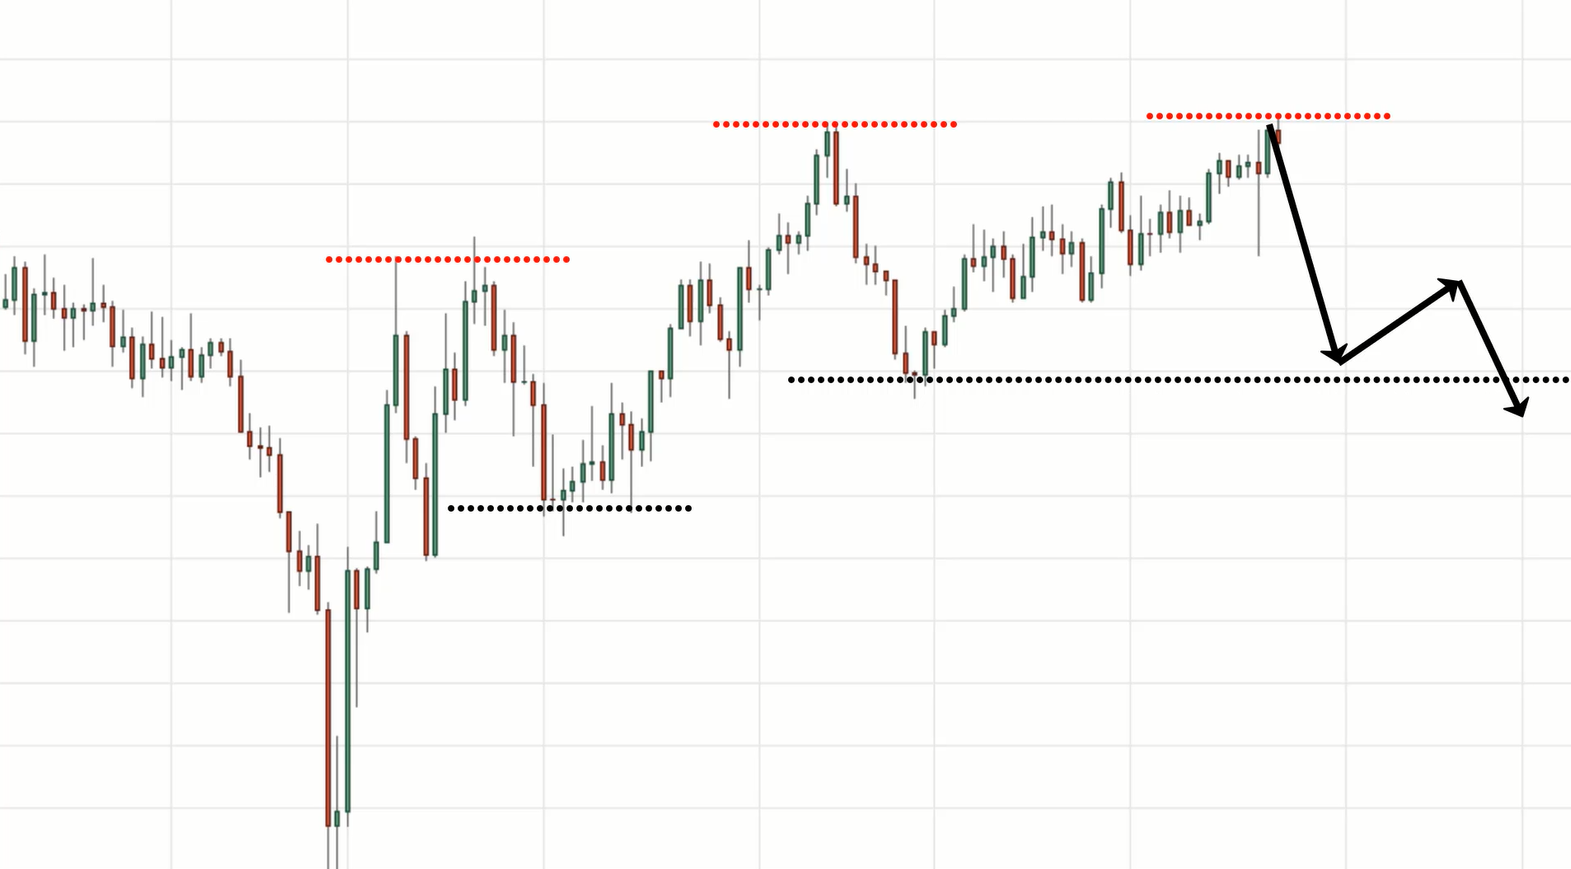
You can see that the price touched support a few times then it broke down. Now support is likely to become resistance in the red area.
Now, what's the problem with this?
Well, if this is the only area that you're looking to short the market, then you're missing a lot of trading opportunities because the market might not retest this level.
It might just make a slight pullback and then continue lower.
And when that happens, you're going to be only watching from the sidelines, because you’ve wasted the opportunity.
Why is that? Well, that's because you only know how to identify one area of value and it's support or resistance.
(But there's more to it, which I'll explain later.)
So this is the mistake that many traders make, they only wait at support and resistance. And that's not how pullback trading is meant to be.
There are other areas of value to trade from (which I'll share more later).
Let me give you an example.
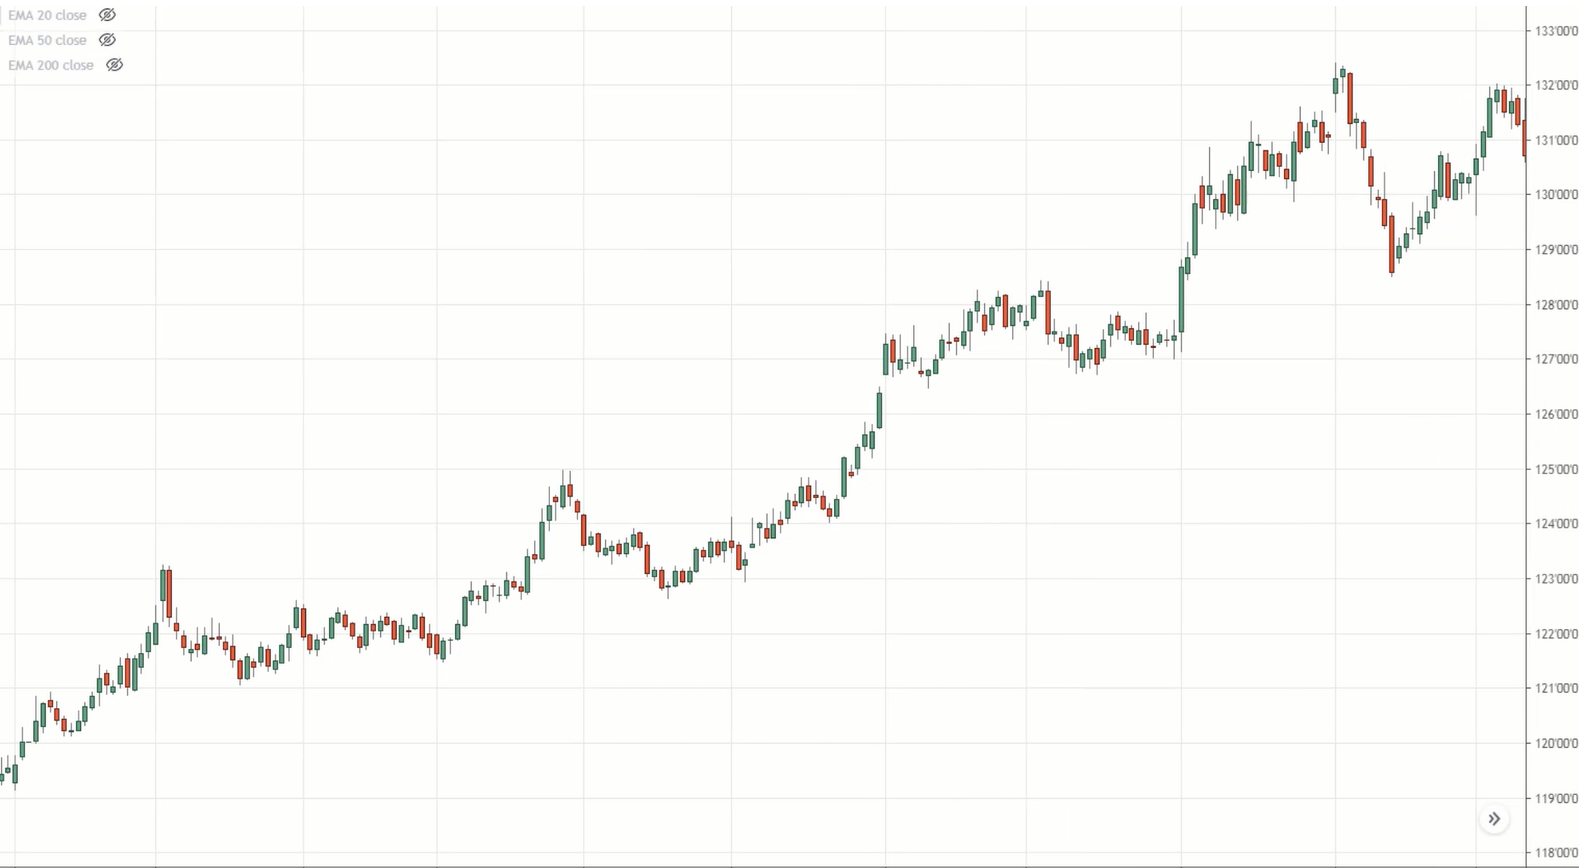
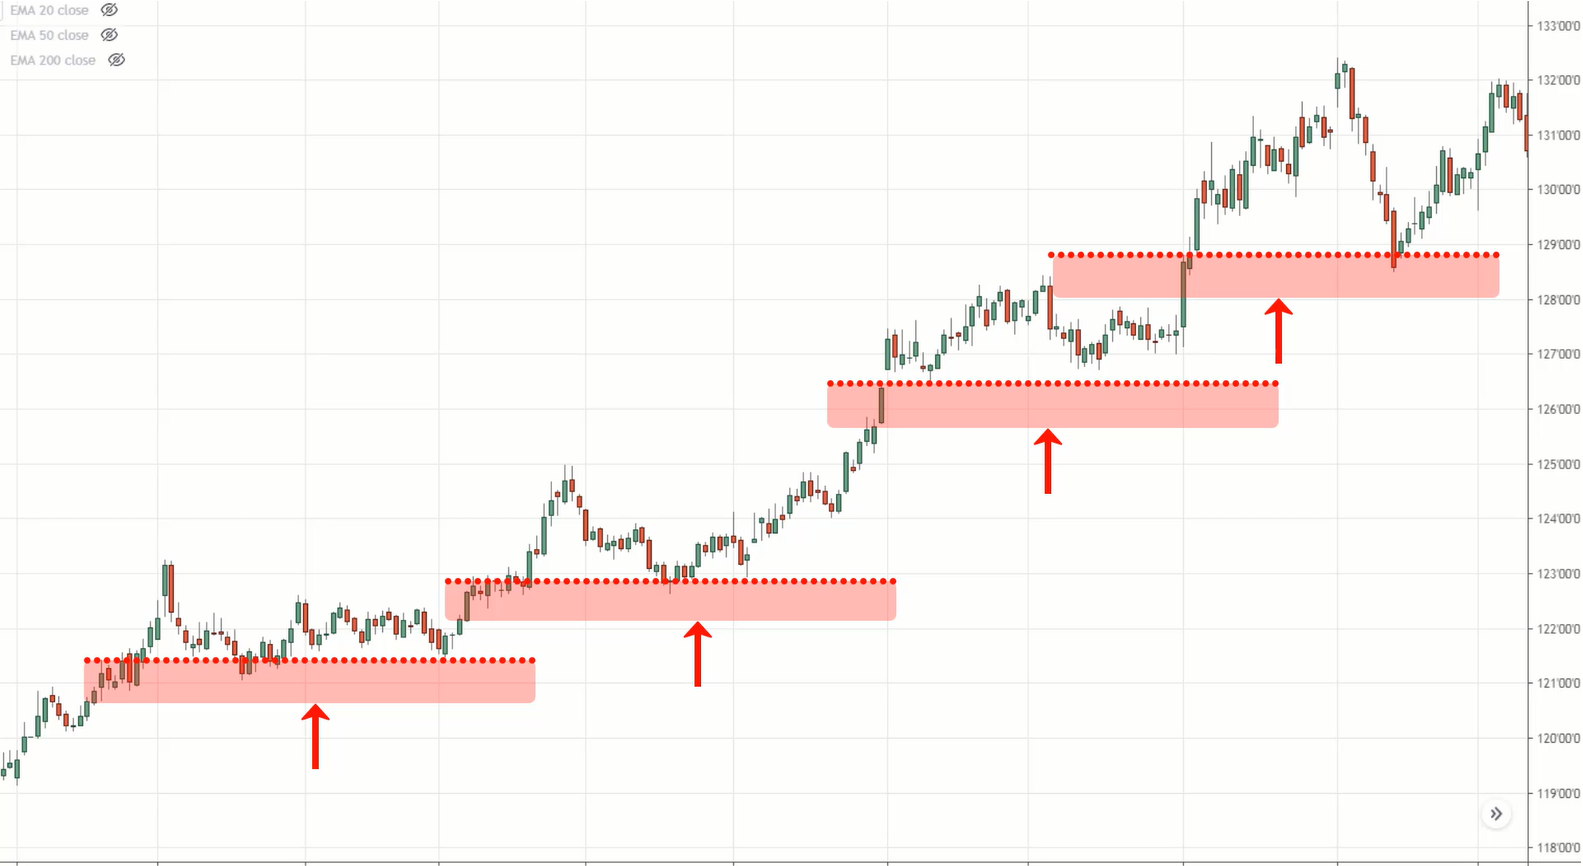
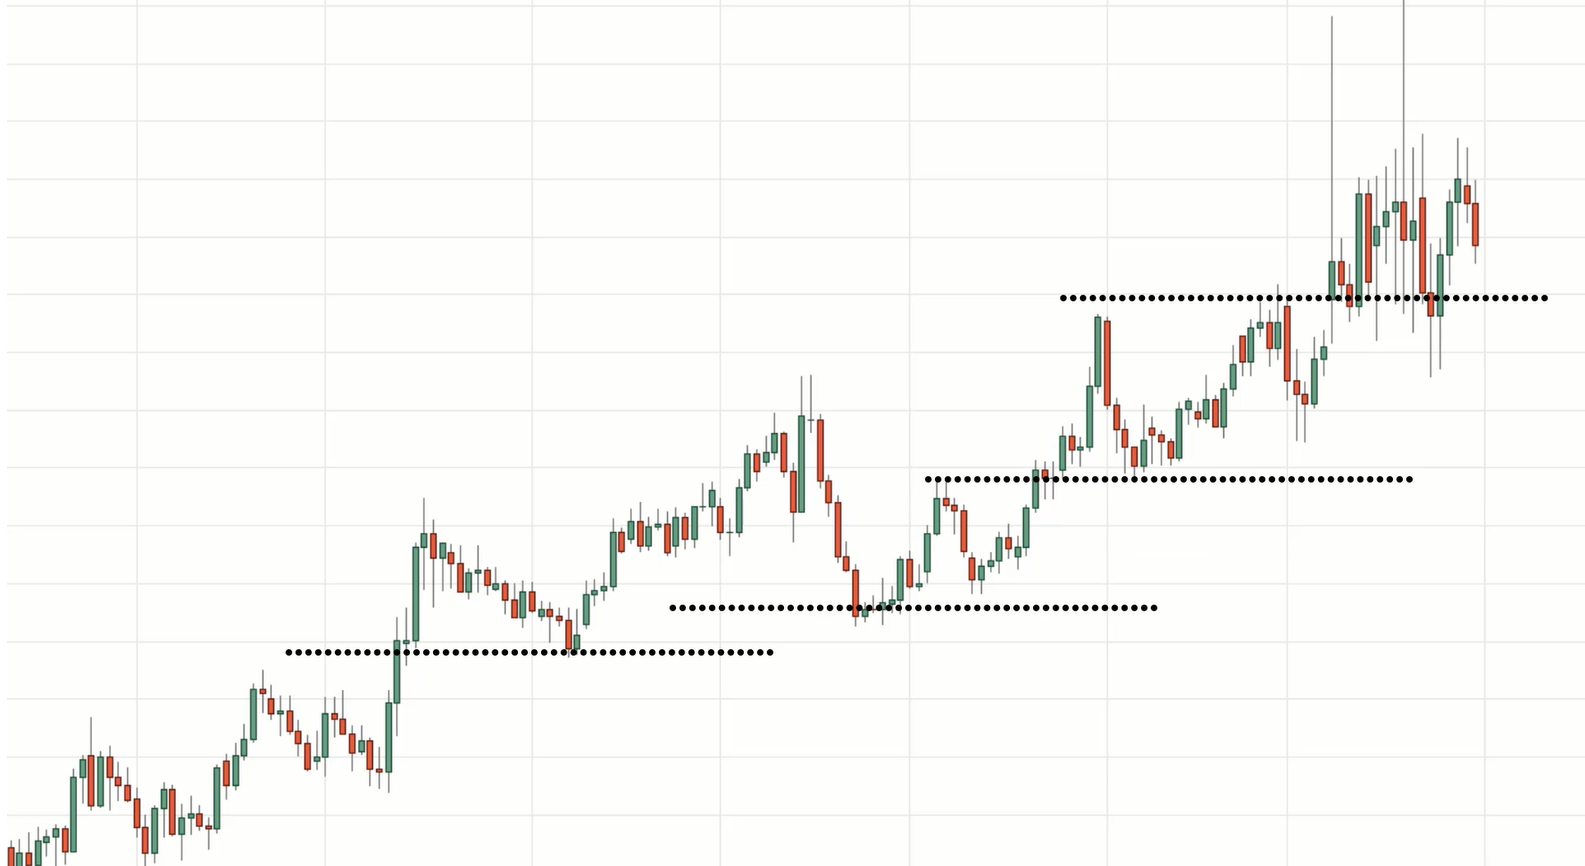
Look at the chart of the 10-Year Treasury Note Futures:
And again, when traders look at this chart, they know it's in an uptrend and since they are trend traders, they’re looking to buy. And where do they look to buy?
They only look at one specific area of value, which is support.
Now let me ask you, how many times did the price retest these areas of support?
You can see that for this market, you won’t have the opportunity to buy at support.
So this should really make you think that trading pullback is more than just support and resistance.
(I'll share with you later what else you should be looking at.)
This is the first mistake many traders make, it’s that they wait only at support and resistance.
And by the time the price comes to support or resistance, that's when the pullback ends and it becomes a reversal, and they get stopped out of the trade.
Next…
Mistake #2: You enter your trades too early
Imagine the market pulls back and you buy, but the market collapses lower.
What's going on? Well, It's because you buy or you enter your trades too early.
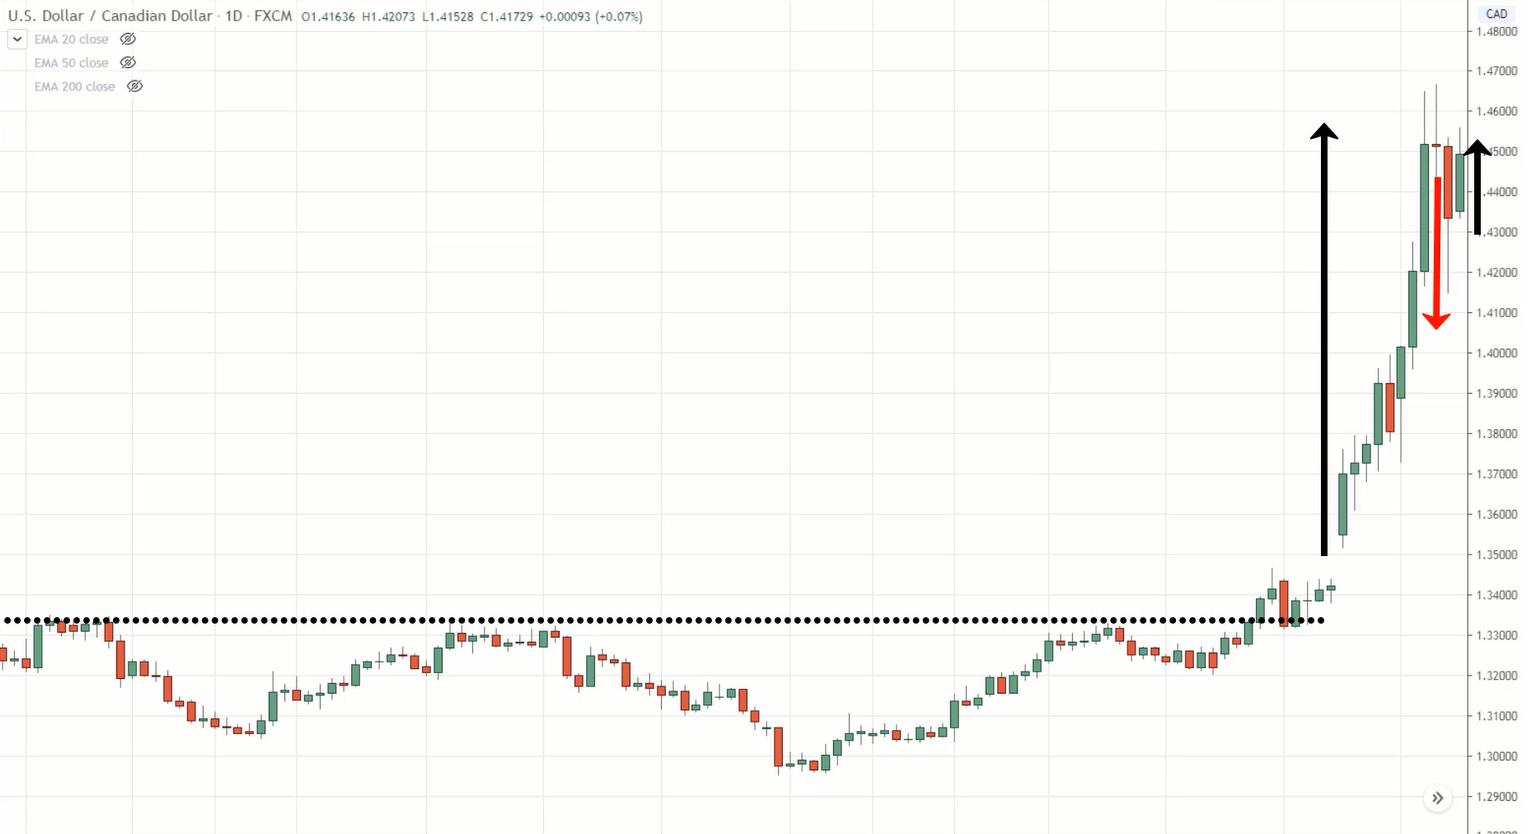
Let me give you an example. Let’s look at USD/CAD here:
Look at how bullish this market is. The market broke out of resistance, makes a pullback and candle on the right has closed higher for the day.
And at this point, traders who miss the trade are anxious to get in, thinking the pullback is coming to an end. Let me buy, buy, buy.
And when they buy at this price, they wonder why they get stopped out of the trade. I'll explain to you why shortly.
But this is a mistake that traders make when they trade pullback – they enter their trades too early.
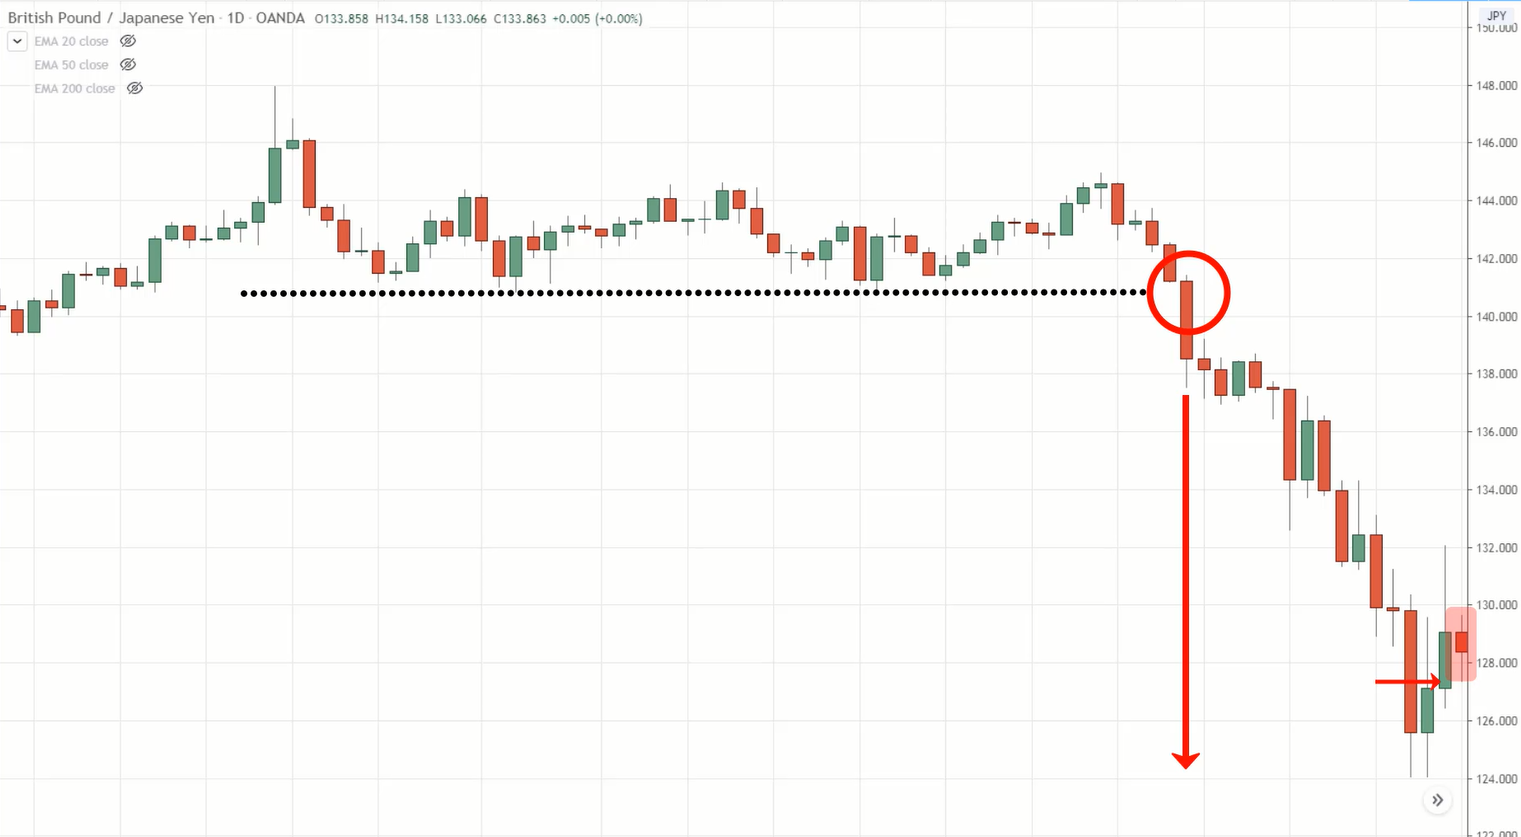
Another example is GBP/JPY:
The same thing, the market broke below this area of support with strong bearish momentum, did a slight pullback on the last two candles.
And for the last candle, it was actually trading near the lows over here, it was actually pretty bearish. Many traders got excited thinking, “Oh man, the pullback is coming to an end look at how red this candle is. Time to short!”
Then what happened?
Well, they entered their trades too early and they got stopped out again.
That's the second mistake traders. They enter the trades too early when they are trading pullback.
And now this brings me to my next point. How should I trade pullback?
Pay attention to market structure
The key thing that you must know when you're trading pullback is you must pay attention to the market structure.
Now I can't give you a full lesson on market structure, so I’ll just talk about market structure in a trending market.
Here's the thing…
Not all trends are created equal. Some markets are in strong trending behaviour, some are in a healthy trend, while some are in a weak trend.
Let me point out to you the subtle differences.
Strong trend:
In a strong uptrend, the price tends to stay above the 20 MA.
In a strong downtrend, the price tends to stay below the 20 MA.
Healthy trend:
In a healthy uptrend, the price tends to pullback or retrace towards the 50-period moving average. The market also tends to retest previous resistance turned support.
(And for a downtrend it’s just the opposite.)
Weak trend:
This is where the pullback is usually very steep and deep. It tends to retest the 200 MA or the previous support resistance area.
Let's look at some examples illustrate these points that I just shared with you.
Once you understand market structure, trust me, you’ll never look at pullback trading the same way again.
Example #1 (AUD/CHF in strong trend):
Many traders are waiting at this previous support that could become resistance.
But no, if you understand market structure, you’ll know that’s not the only area of value to trade from.
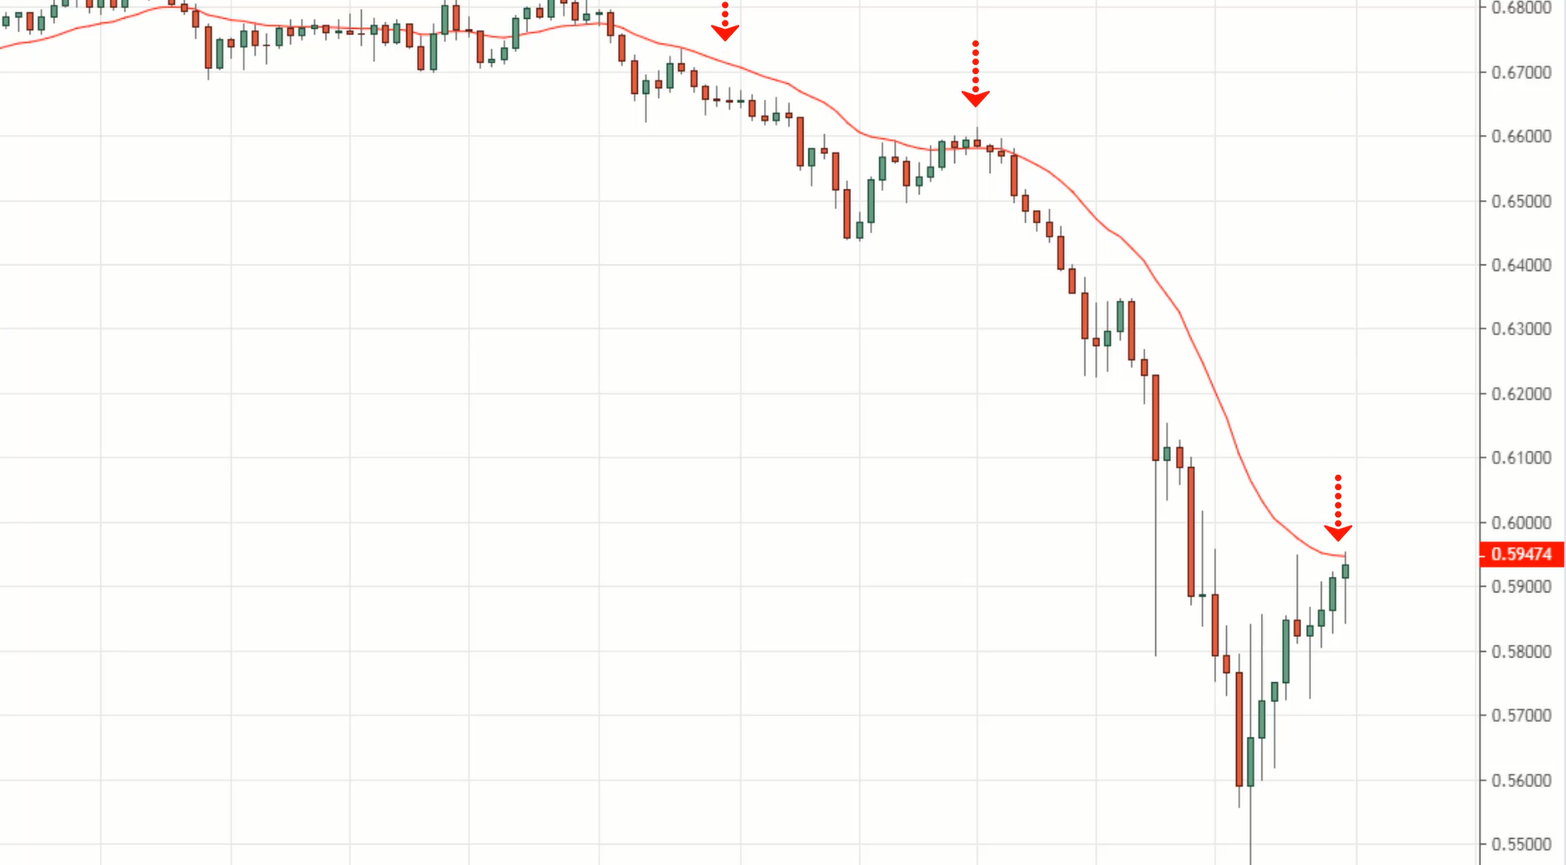
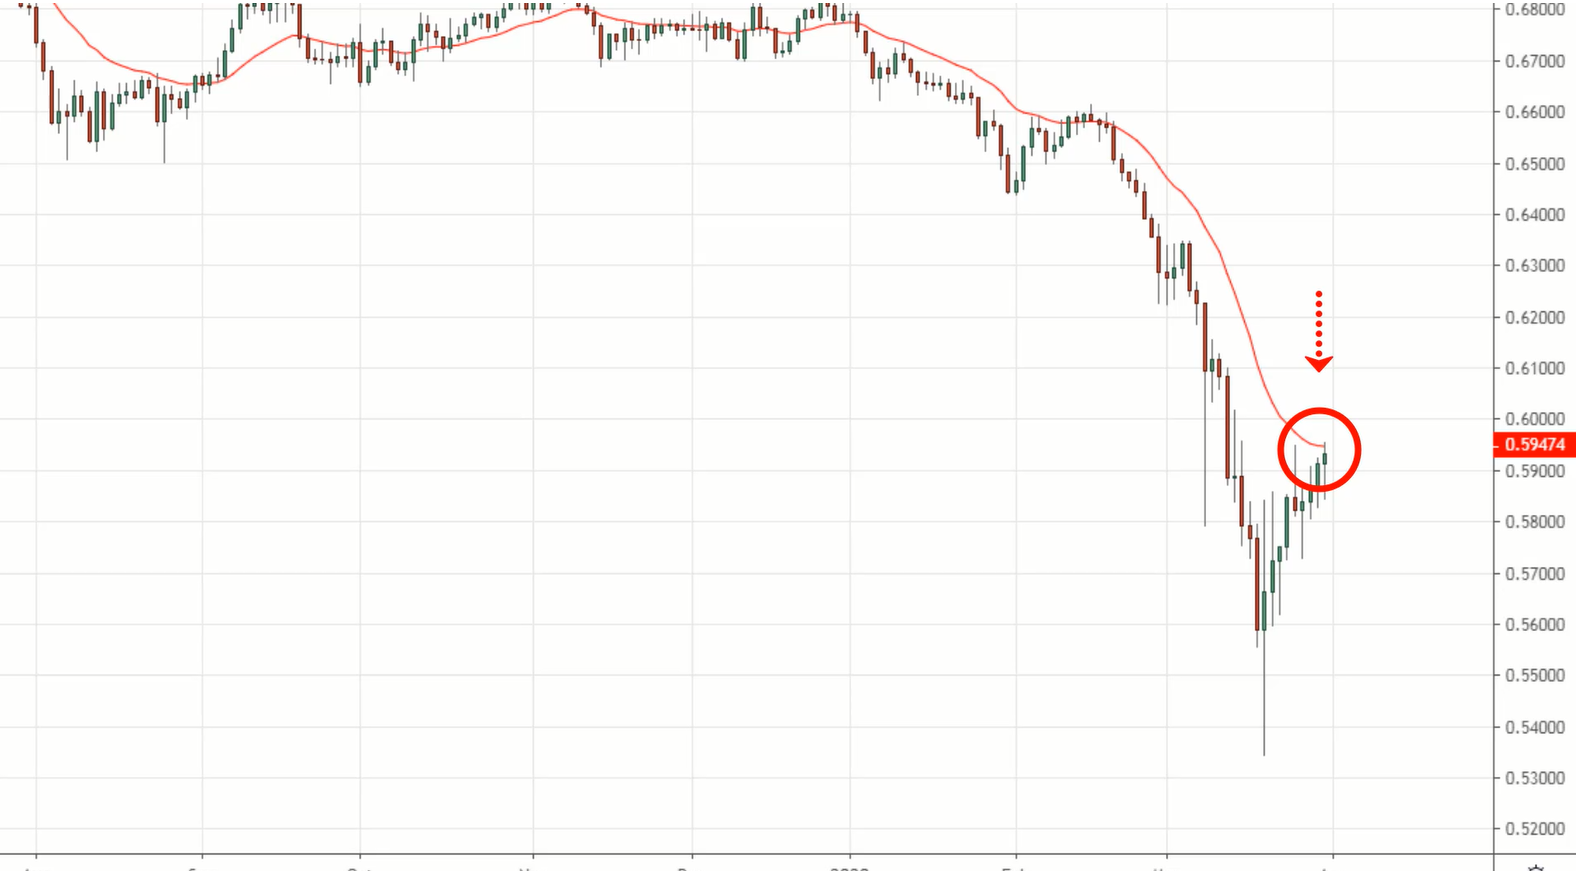
Because you can also trade from other areas of value. For example, the 20 MA. Because if you look at this market, it is now in a strong downtrend.
It's consistently below the 20 MA:
It has tested the 20 MA thrice. So at this point, I wouldn't only be looking to sell at this area of resistance.
I will be looking at the 20 MA for trading opportunities. The market has given me clues that it has respected the 20 MA, and it will be a key area that I'll be looking to trade the pullback.
And how can I trade the pullback? Let me give you a couple of ideas on how to trade the pullback.
Look for bearish price rejection at the 20 MA
This could be in the form of a shooting star, a bearish engulfing pattern.
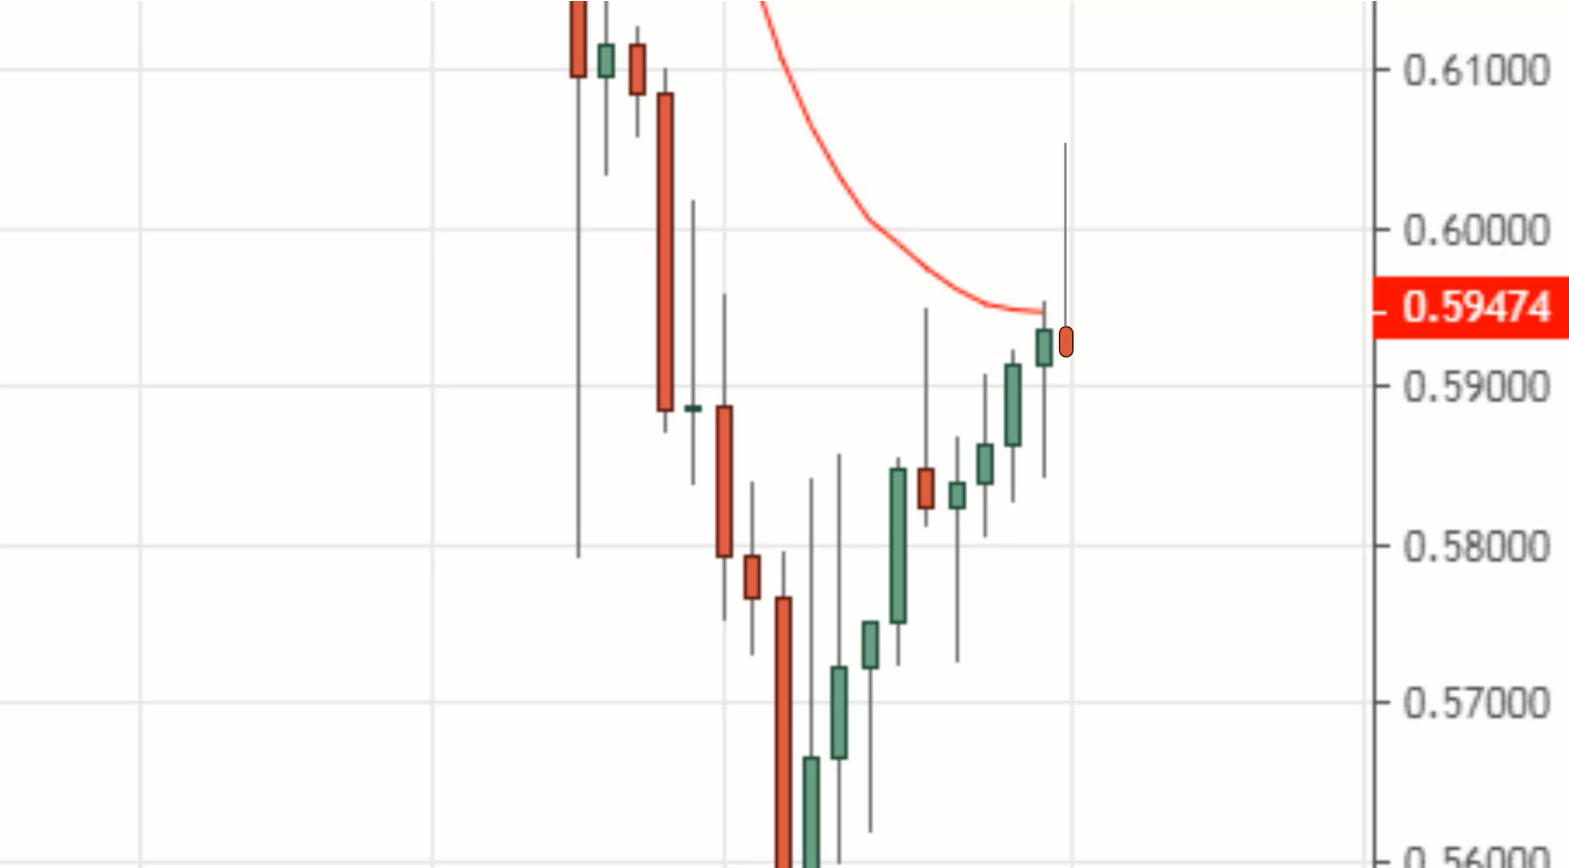
For example:
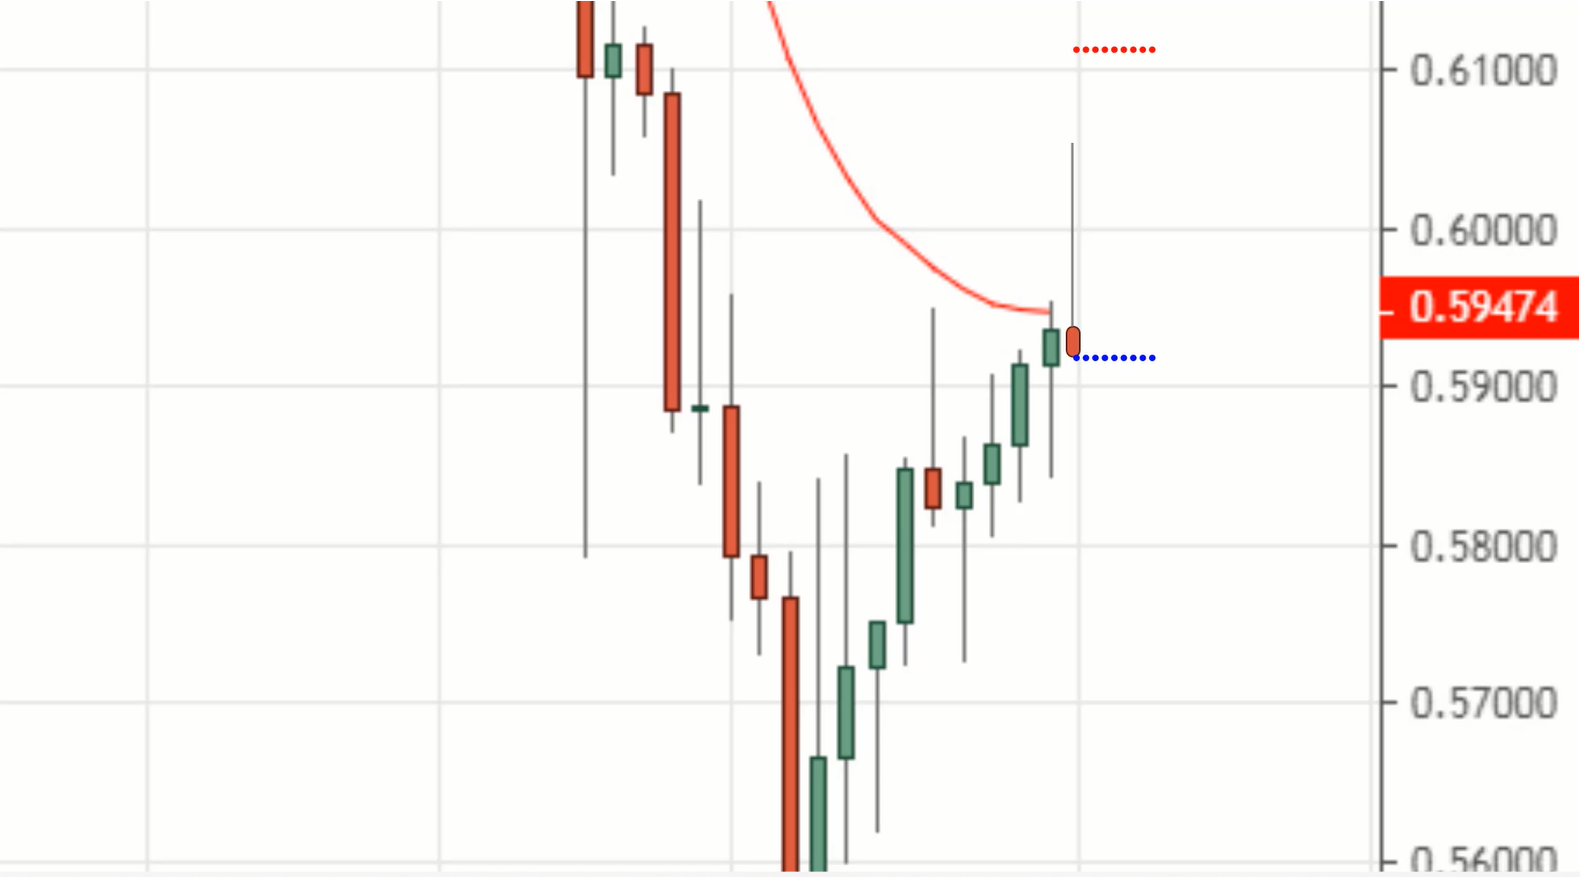
Imagine the market breaks out higher, but it suddenly reverses to near the lows and closed lower for the day.
This is a form of price rejection, and that's one way to time the market because this tells you that the buyers have difficulty pushing the price higher and the sellers came in to control and pushed the price near the lows of the day.
When that happens, you can look to sell on the next candle’s open. Your stop loss can go above this candle’s high:
So that's one approach. Another approach that I like is what I call the break of structure technique.
Look for a break of structure
If you've gone down to a lower timeframe (for that same example), like the 2-hour timeframe, you can see that now the price is being controlled by the buyers.
How do I know that? Well, you see a series of higher lows and higher highs. So I don't want to short the market just yet because the buyers are still in control.
But one thing that I do know is that on a higher timeframe, the daily timeframe, as we have seen earlier, the trend is towards the downside and the price is at an area of value, which is at the 20 MA.
What I can do is that on a 2-hour timeframe, I can use this timeframe as an entry trigger to short the market.
And the entry trigger could be as simple as a break of structure with the price making a series of lower highs and lower lows.
One possibility is that the market could head down lower, bounce up higher and then break below this area of support.
I will now have a series of lower highs and lower lows. This tells me that the sellers are about to come in to push the price lower.
So this can serve as an entry trigger to short this market and to time your pullback. Does it make sense? Hopefully, this one is clear for you to trade in a strong trending market.
What about a healthy trend?
Example #2 (in a healthy trend):
If traders were to wait at support, they probably wouldn't find too many trades because the market didn't retest those previous areas of support.
Now how can we trade this market? First and foremost, ask yourself what is the current market structure?
I know it's in an uptrend but let's get more specific. What type of uptrend is it? What is the current trending market structure?
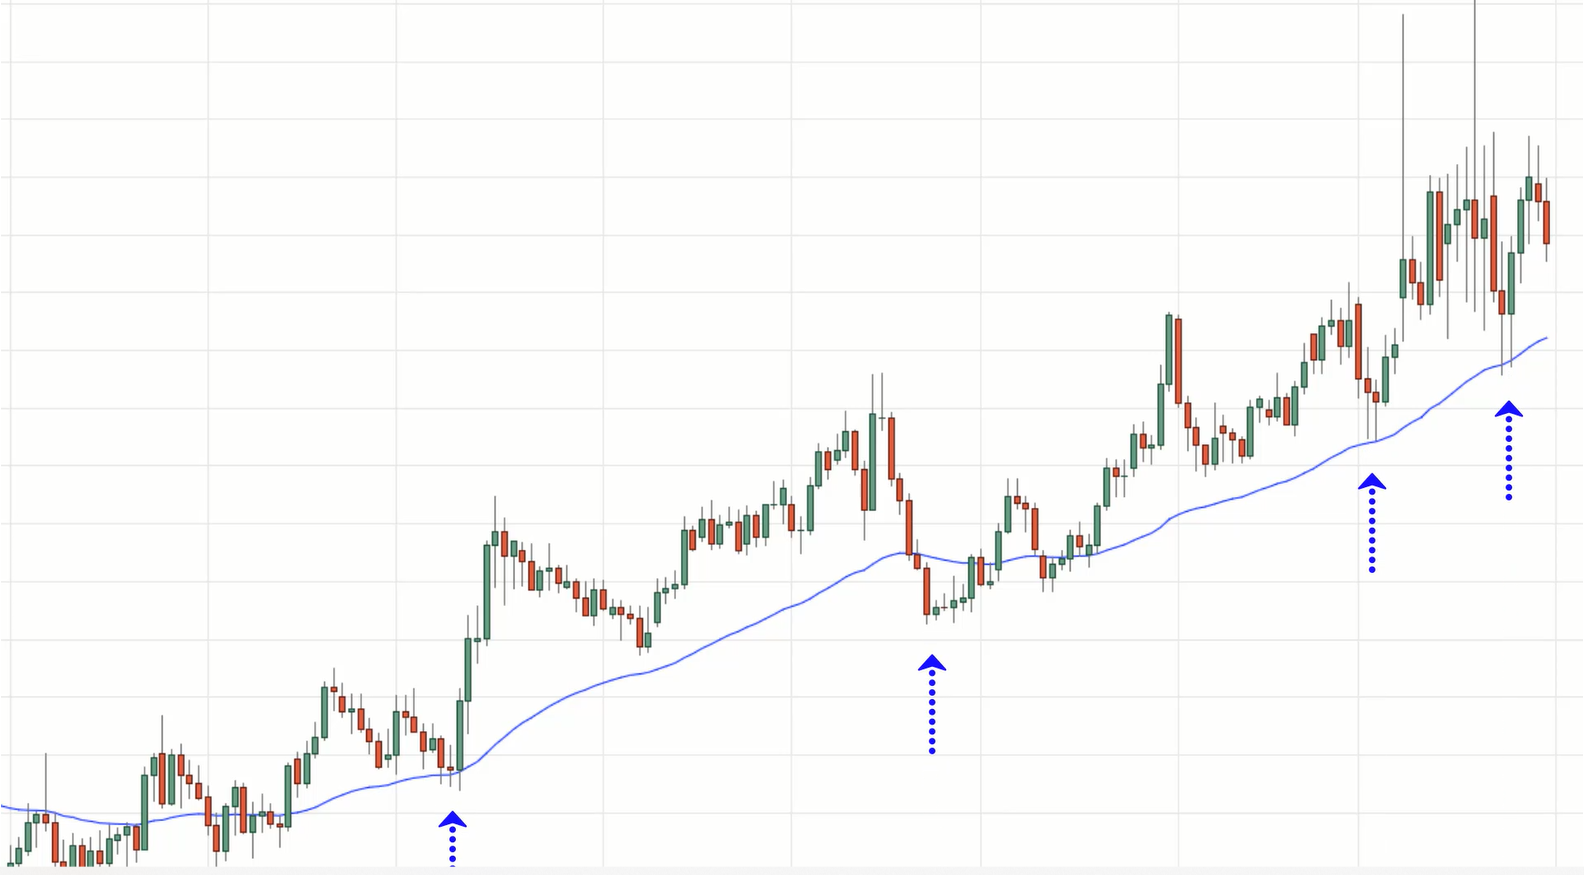
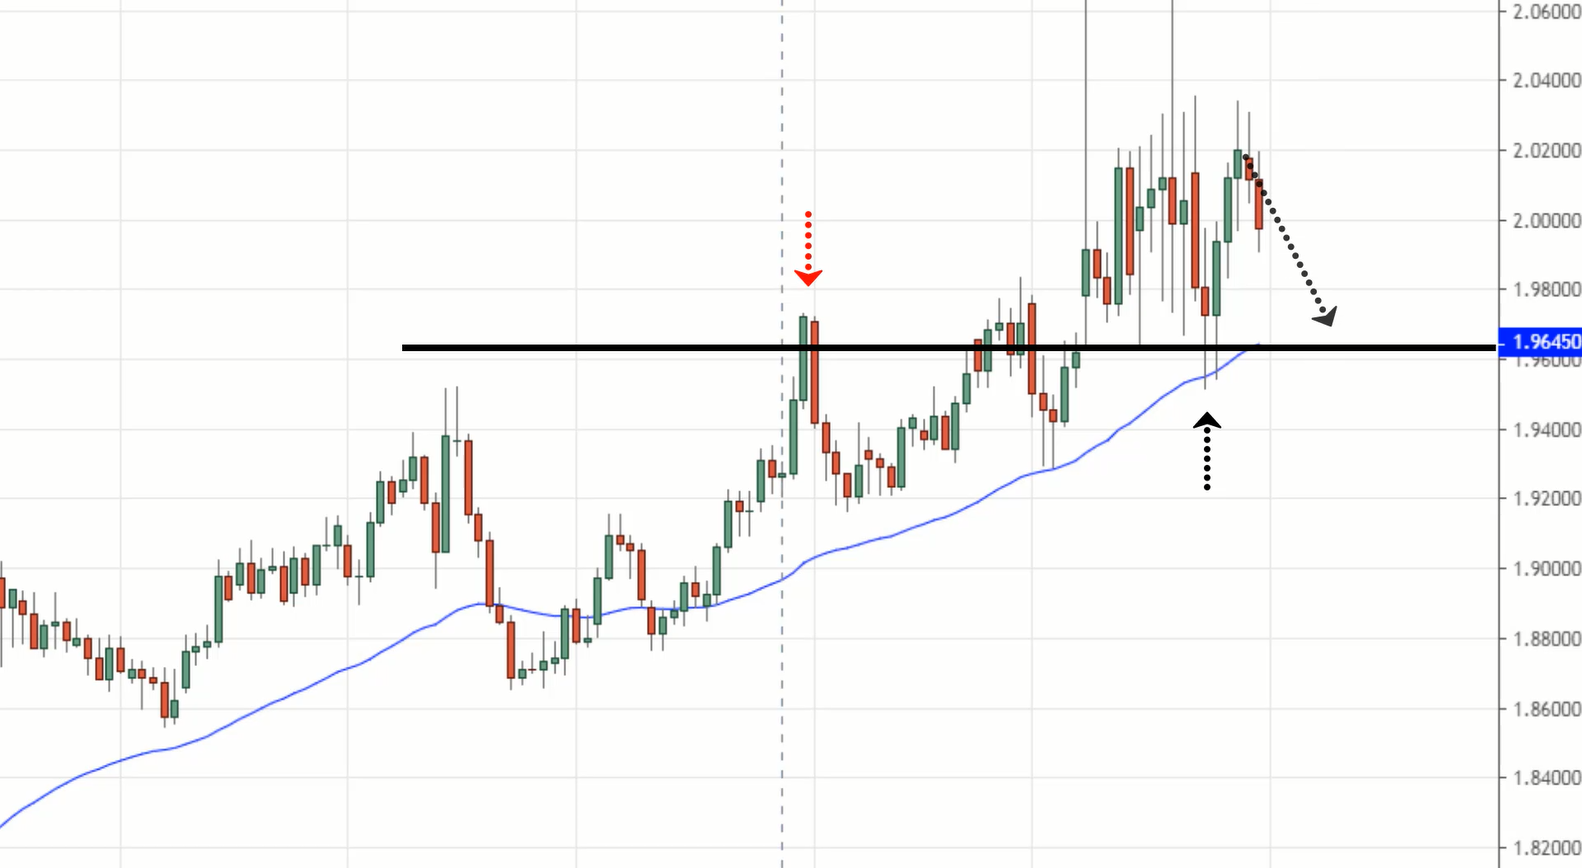
If you just pull out the 50 MA, you realize that this market tends to respect the 50-period moving average.
The depth of the pullback is deeper and steeper than the previous example of AUD/CHF. It has tested the 50 MA four times. If you ask me, there's a good chance this market could find buying pressure at this 50-period moving average.
I also mentioned earlier that for a healthy trend, you can also find trading opportunities at previous resistance and support.
Now if I want to trade this pullback, I will be looking to buy at this 1.96450 area.
For entry trigger, we can look for a bullish price rejection, like a hammer, or we can look for a break of structure on the lower timeframe, like the 2-hour or 4-hour timeframe to time our entry and to trade this pullback.
Does it make sense?
Here’s another one.
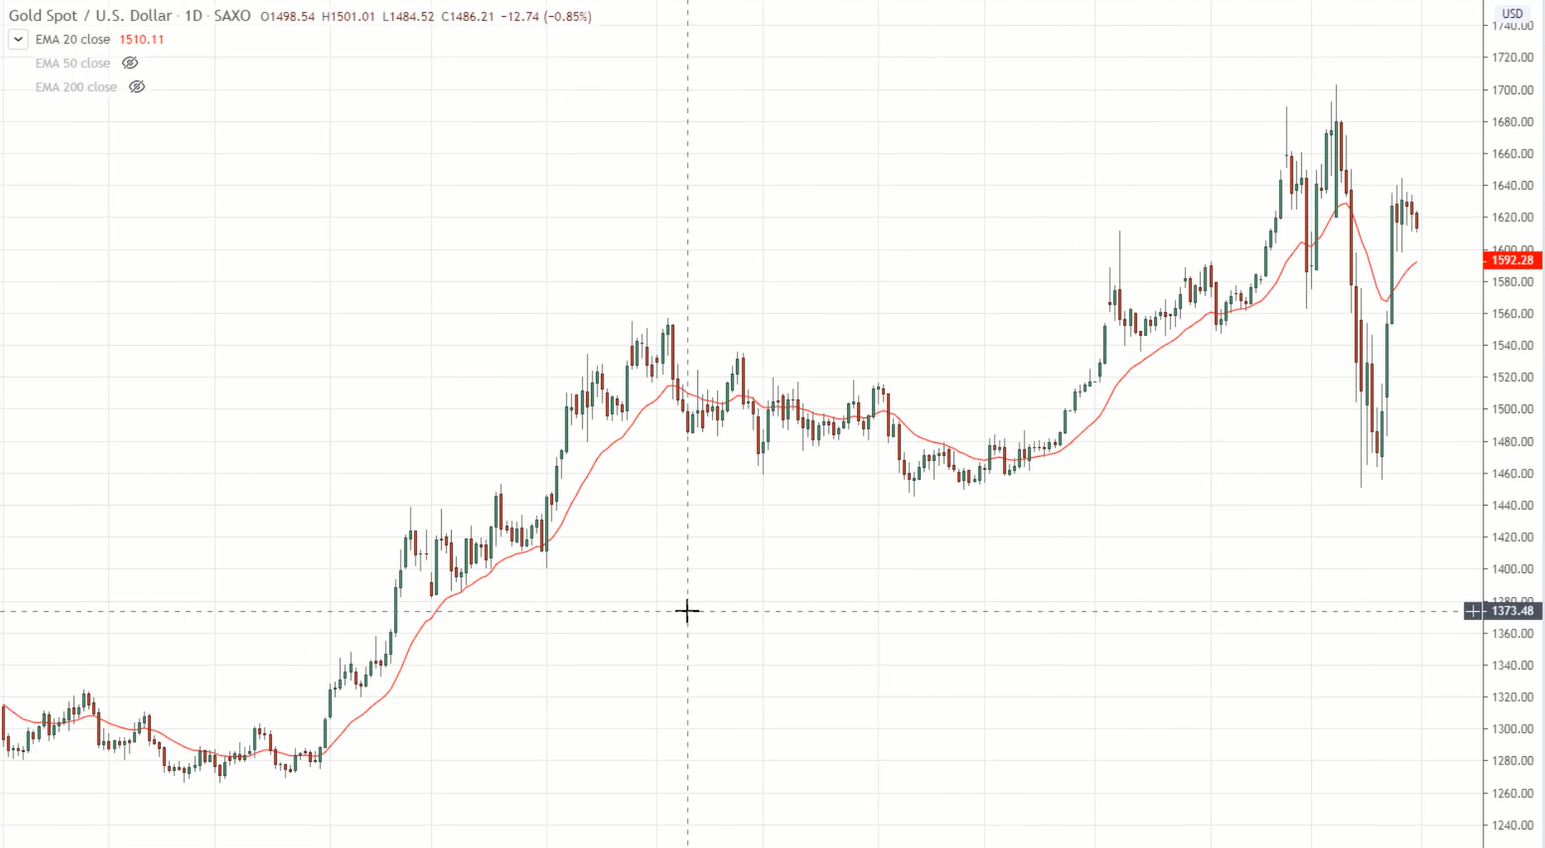
Example #3 (Gold in a weak trend):
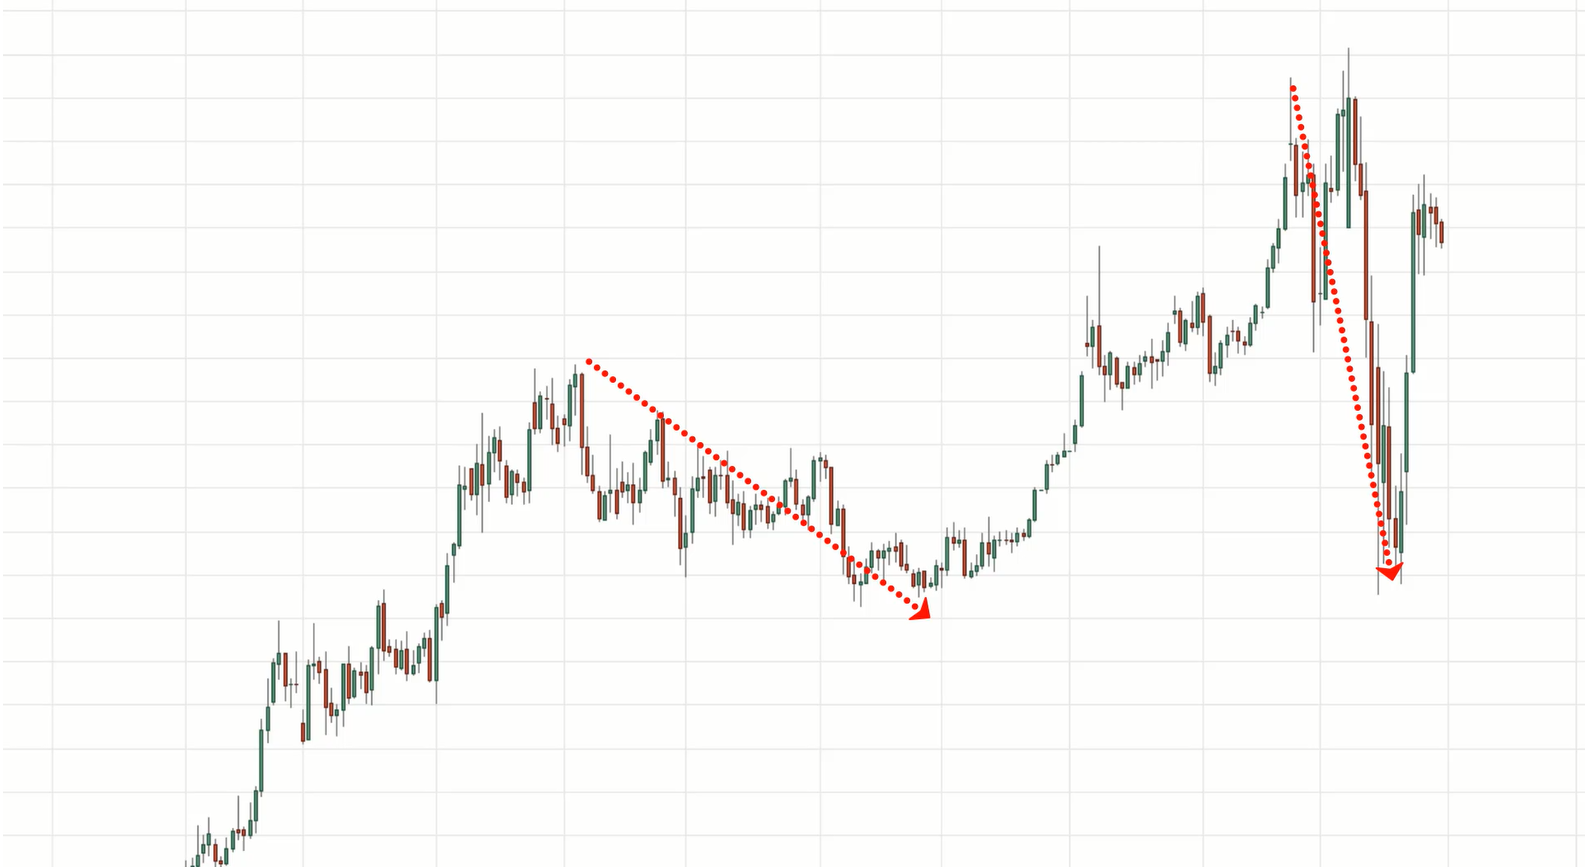
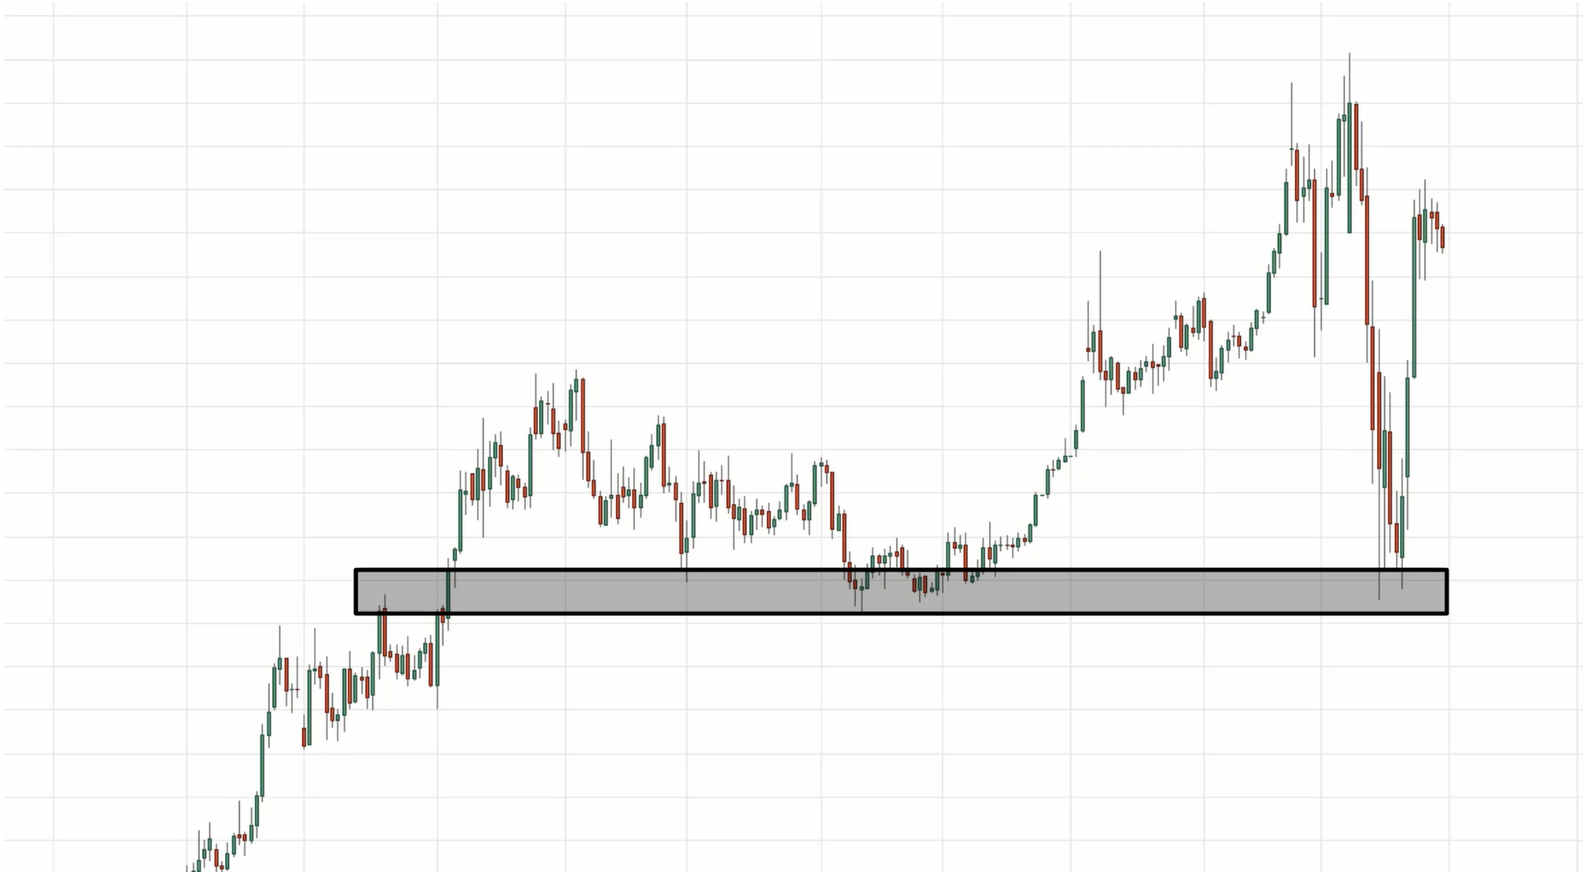
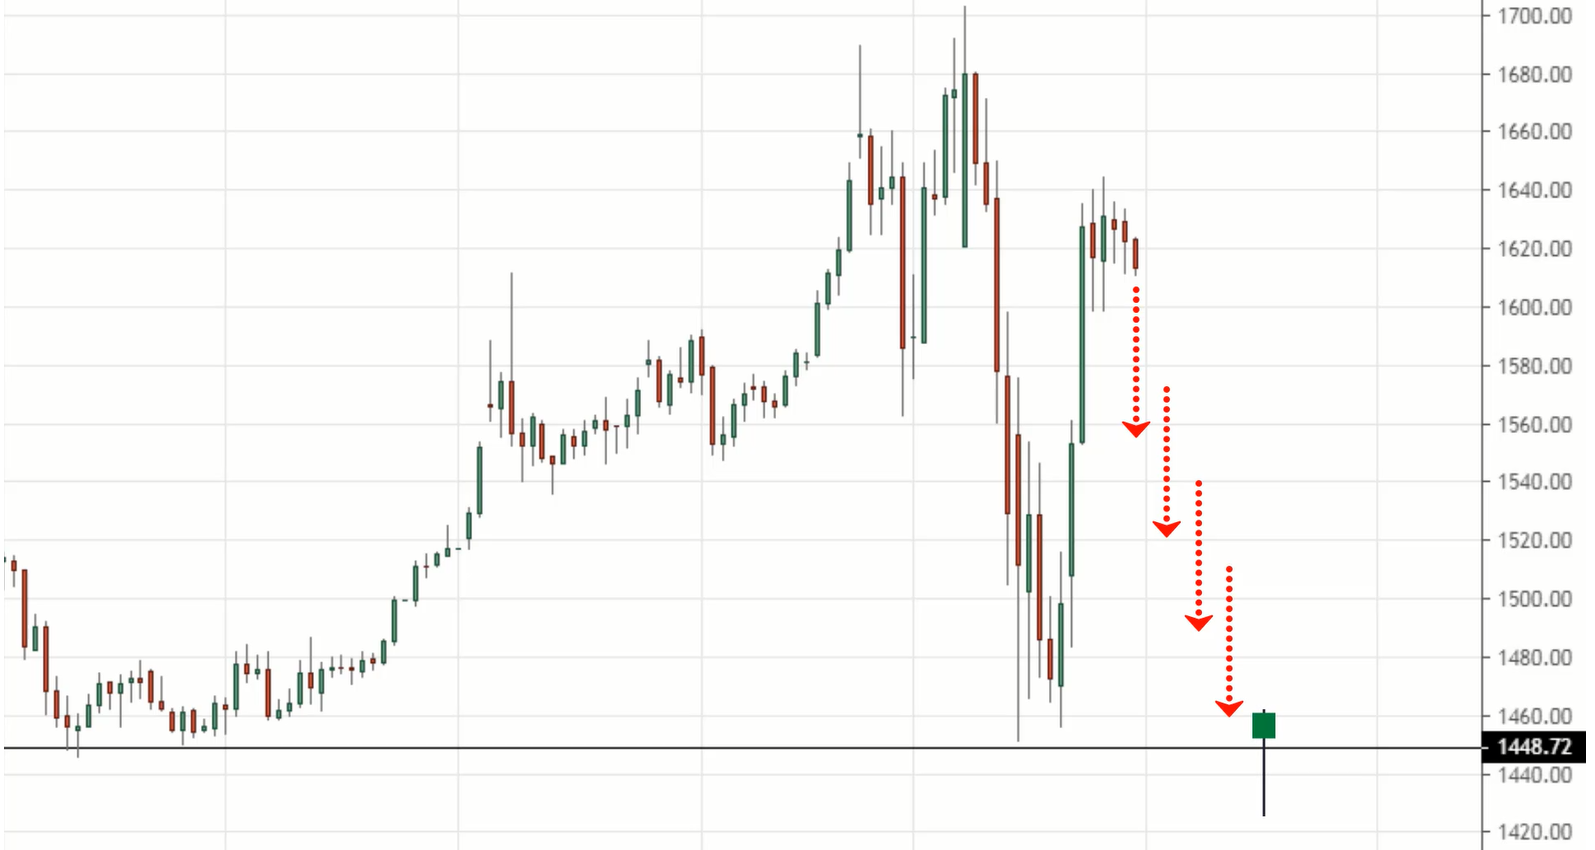
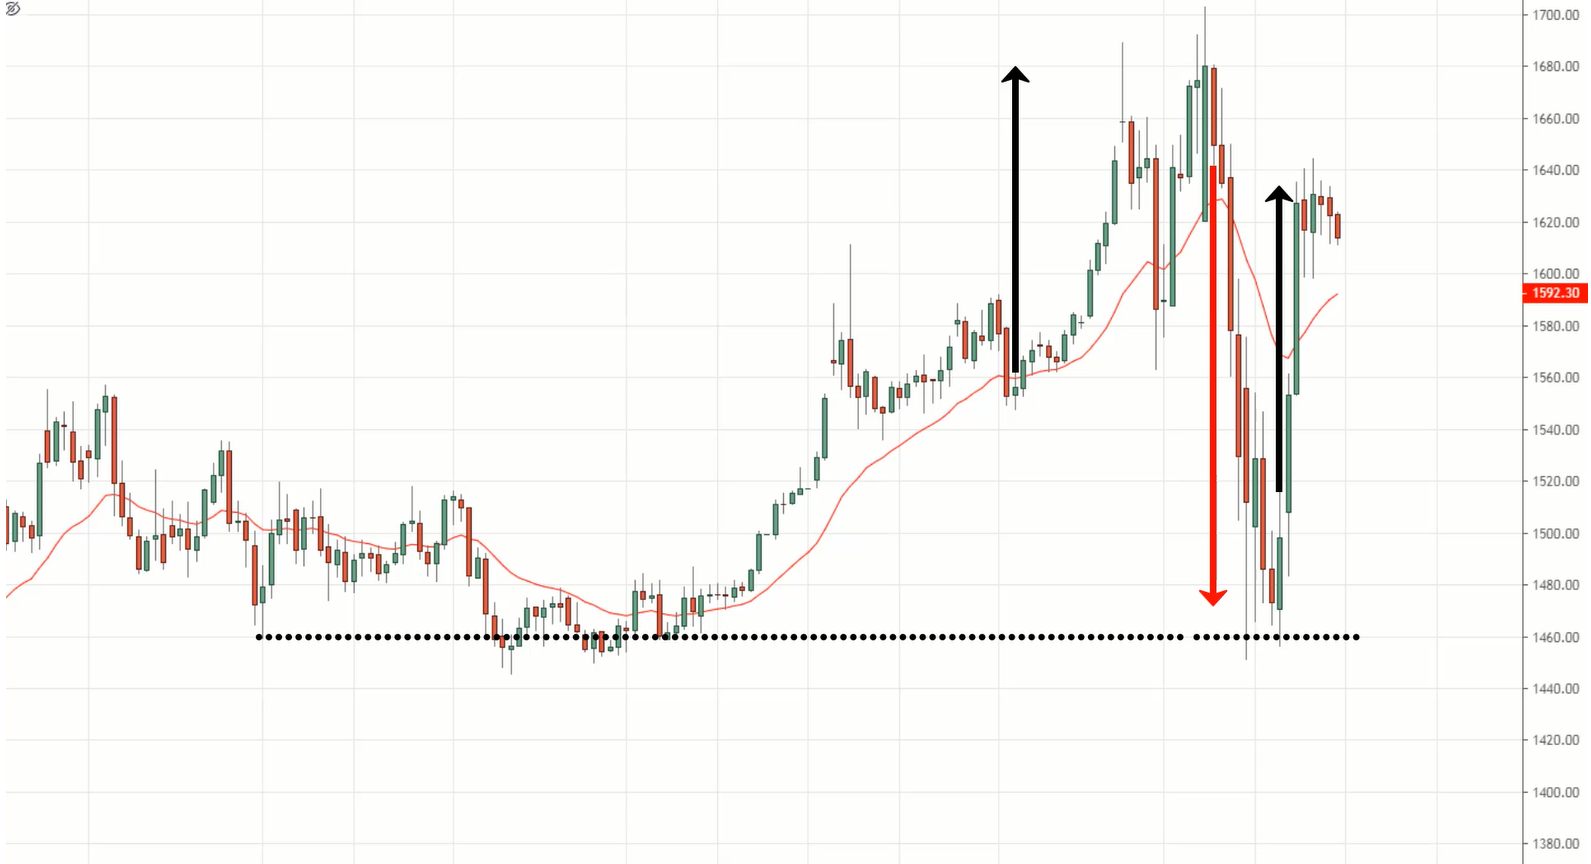
Now if you look at the market structure of Gold, I will classify this as a weak trend because the historical pullback has been pretty steep.
Our area of value is not going to be the 20 MA nor the 50 MA. I’ll be looking for buying opportunities at this area of support.
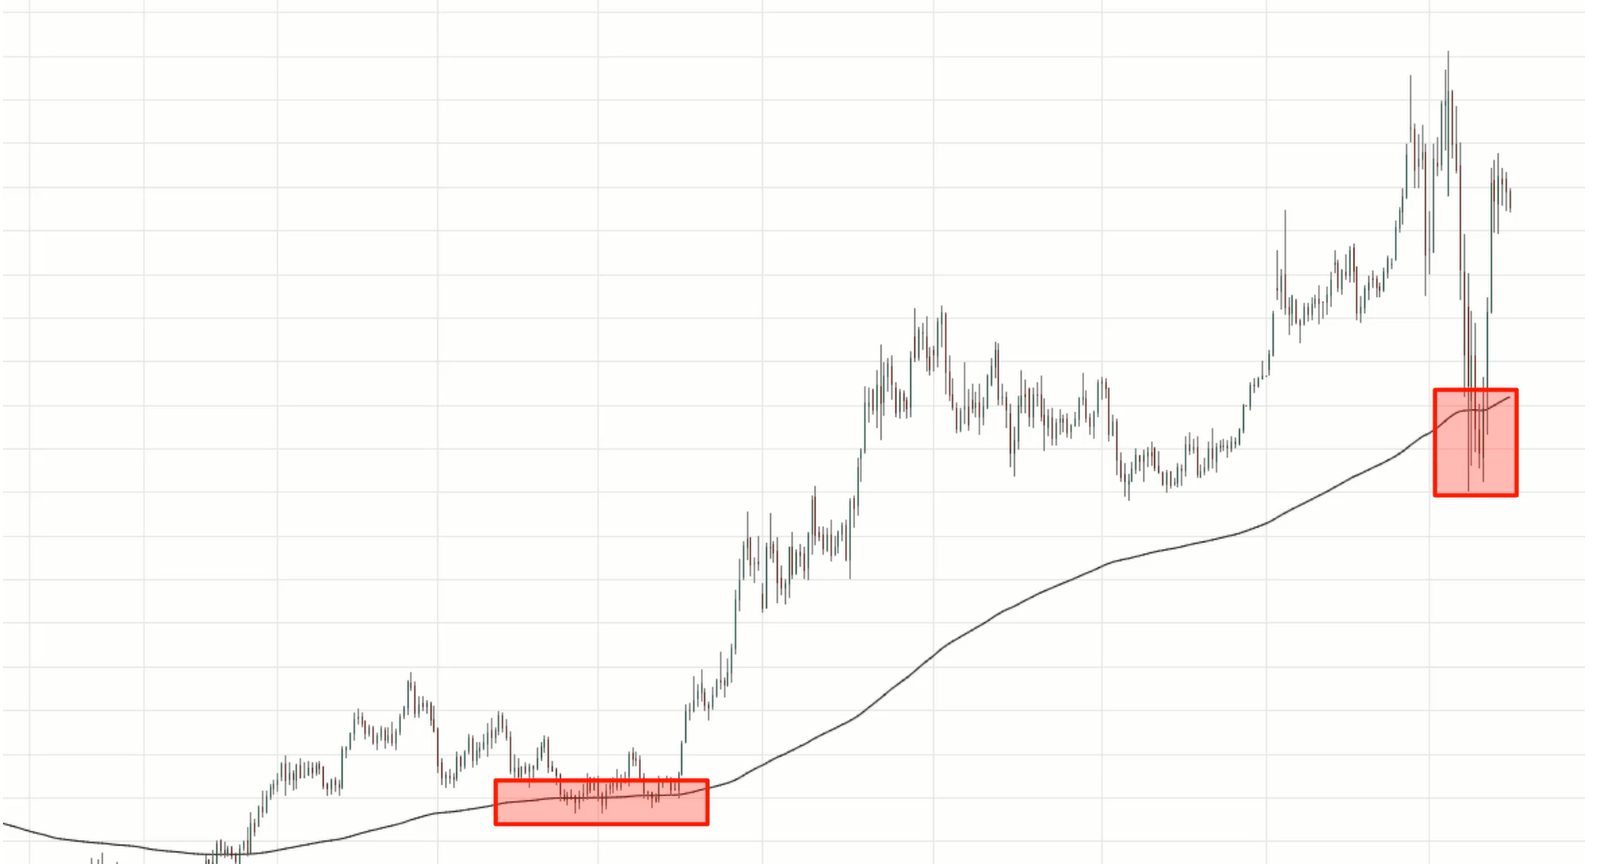
And sometimes in a weak trend, the market also respects the 200 MA.
You can see it tested the 200 MA twice. So I’ll be looking for buying opportunities at the area of support and the 200 MA.
I won't be using the 20 MA nor the 50 MA, because this market clearly doesn’t respect these two moving averages.
You have to understand the market structure, because once you do, then you’ll know which are the areas of value to look for trading opportunities.
Let me just walk you through a couple of entry triggers for this market when you’re trading the pullback.
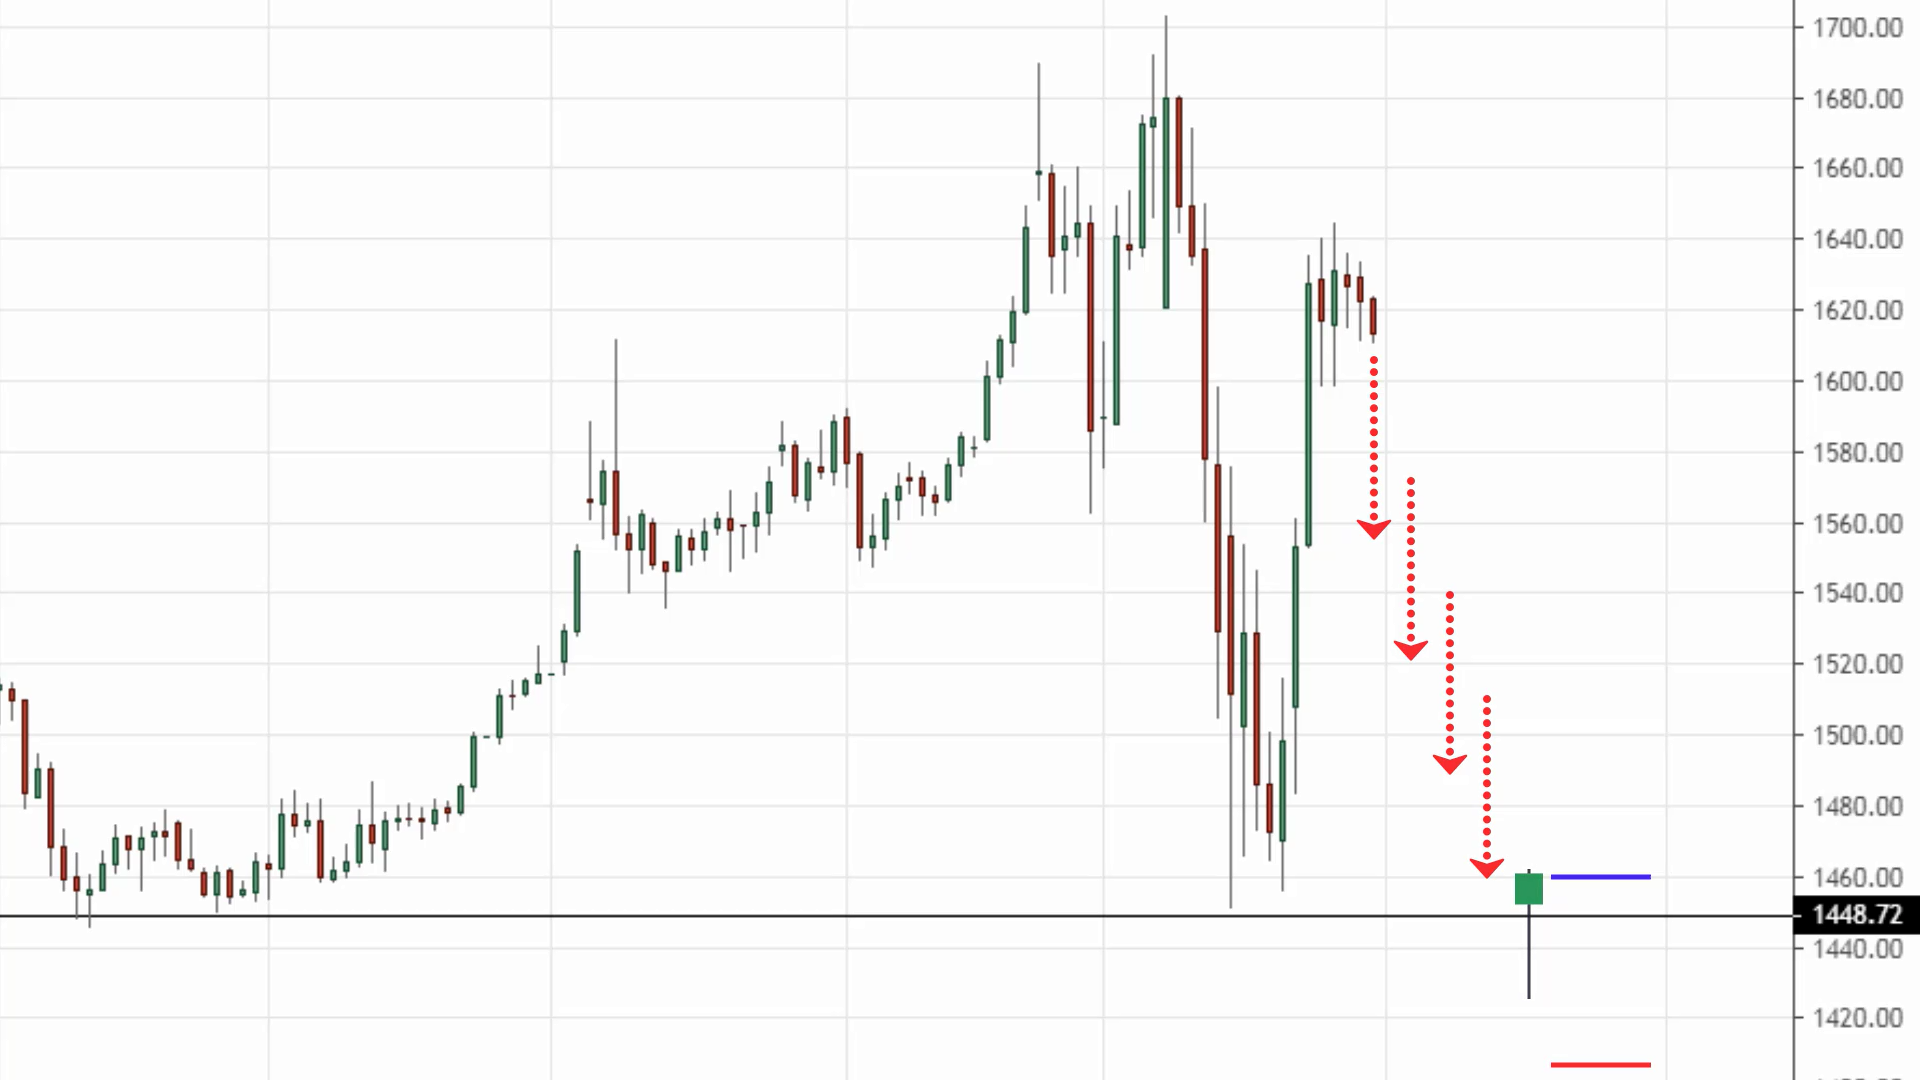
Look for bullish price rejection
The first entry trigger that I mentioned earlier is that you can look for a bullish price rejection for an uptrend.
Let's say the market heads down lower and then it forms a hammer.
This is a bullish signal that tells you the buyers are stepping in and are willing to push the price higher. The buyers are possibly in control.
This is what I call a false break, where the price breaks below this area of support only to close back, higher above support.
If that's the case, you can go long on the next candle’s open, with stop loss below the low.
So that's one way. The other way is to…
Look for a break of structure
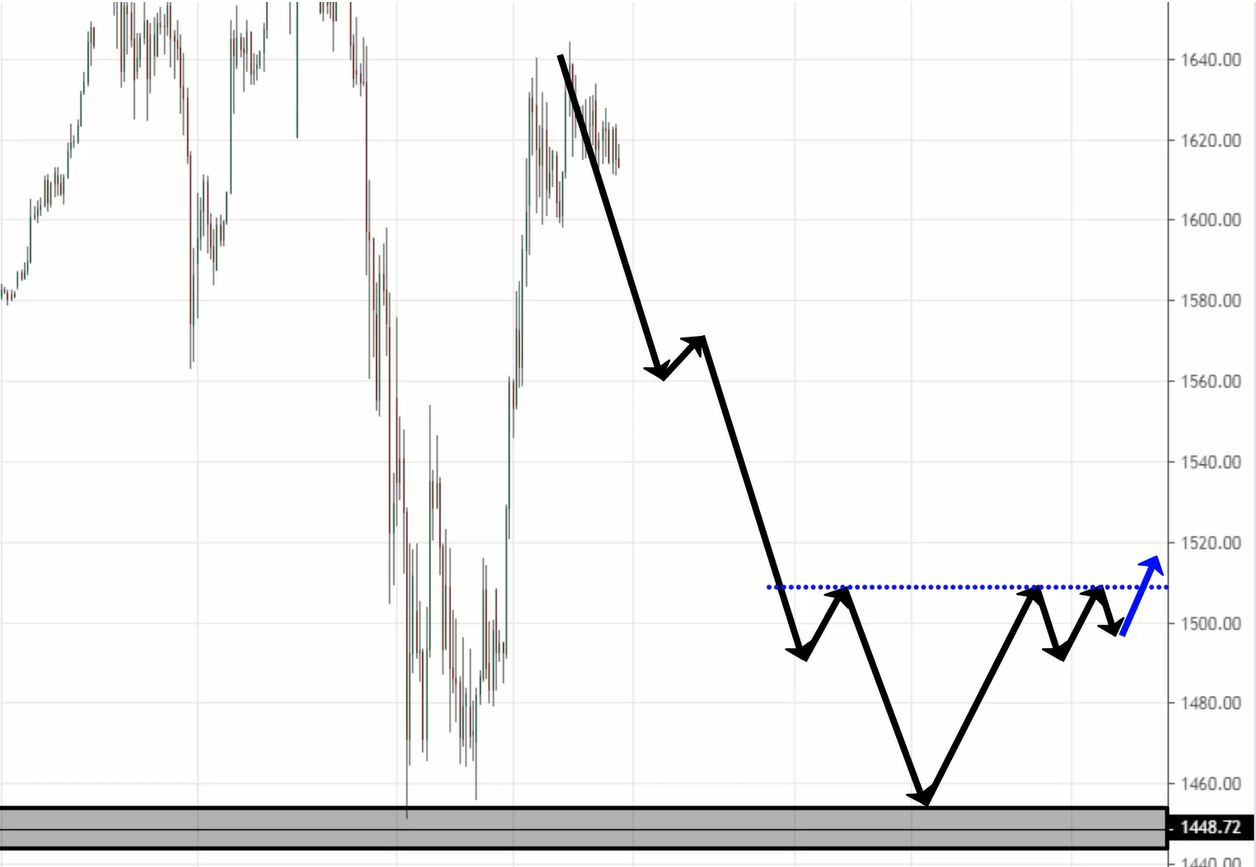
You’ll go down to a lower timeframe and look for a break of structure.
Let's say you go down to the 4-hour timeframe the market were to retrace down lower to this area of support that we saw on a daily timeframe.
When you look for a break of structure, you want the market to invalidate this market structure. You want to market to invalidate this series of lower highs and lower lows.
You're looking for a series of higher highs and higher lows. There are many variations to it. It could be something like an inverse head and shoulders pattern, an ascending triangle pattern, etc.
It could be something like this:
It starts to consolidate at the neckline, which is the resistance. And if the price breaks out, you now have a series of higher highs and higher lows. That’s one variation of it, looking something like an inverse head and shoulders pattern.
Or it could also be like an ascending triangle pattern like this:
If the price breaks above this resistance, now you have a series of higher highs and higher lows. We can see that the concept is what really matters over here.
It’s not about the specific patterns or specific technical analysis.
Moving on…
Bonus tip
1. Market structure is always changing
I know many of you, after studying these videos, you start finding out which are the strong trending markets, where are the healthy trends or the weak trends? And you start to find all these patterns in a market.
But trading is not that easy. In reality, when you're trading this in real-time, market structure evolves over time.
For example, let’s look at Gold.
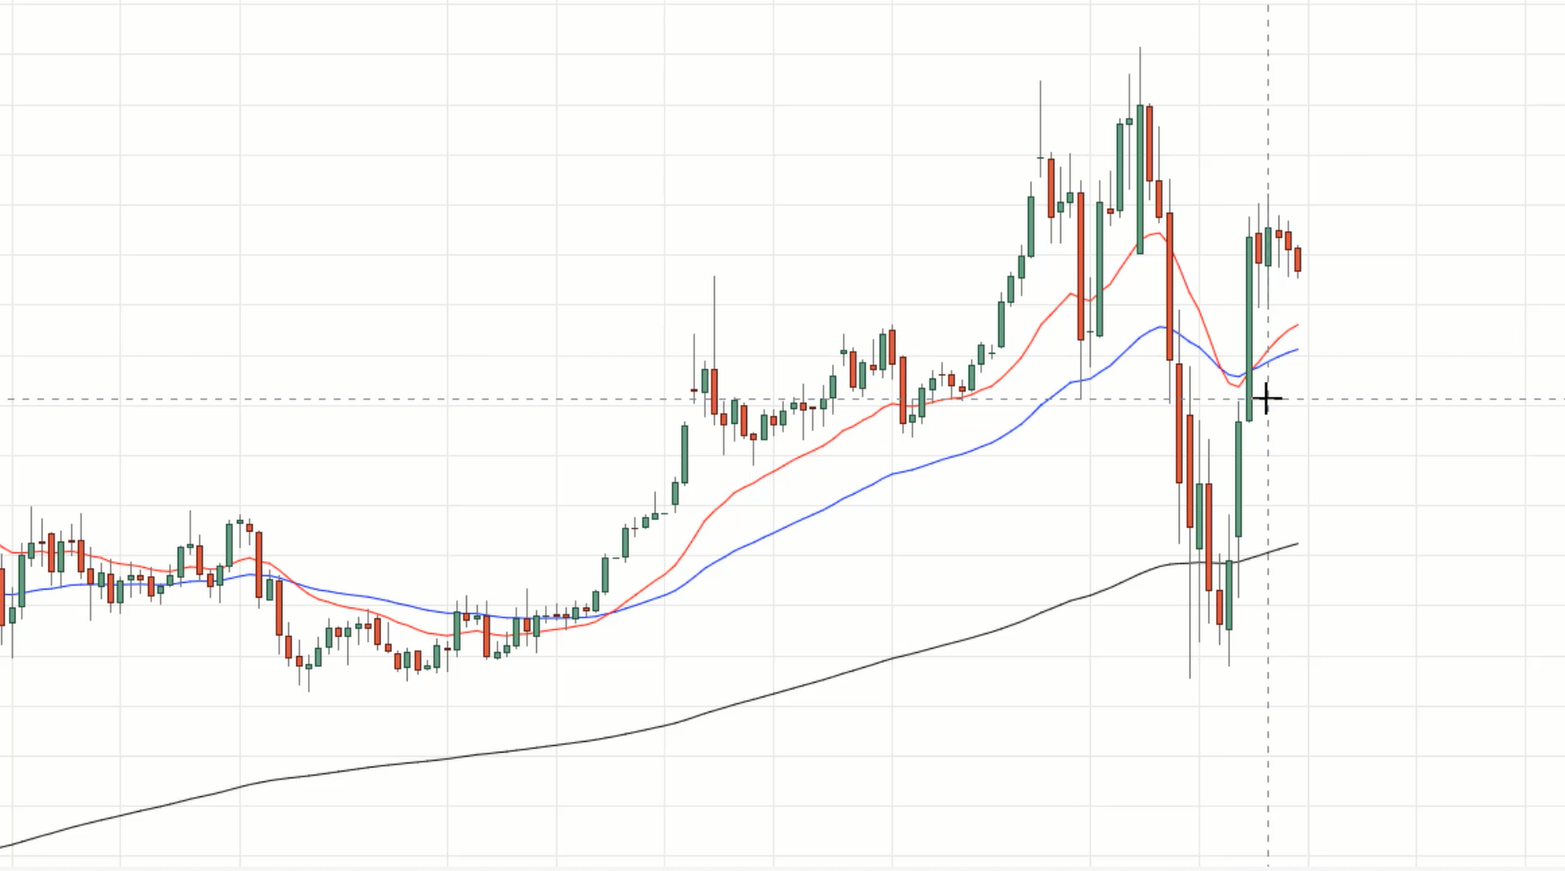
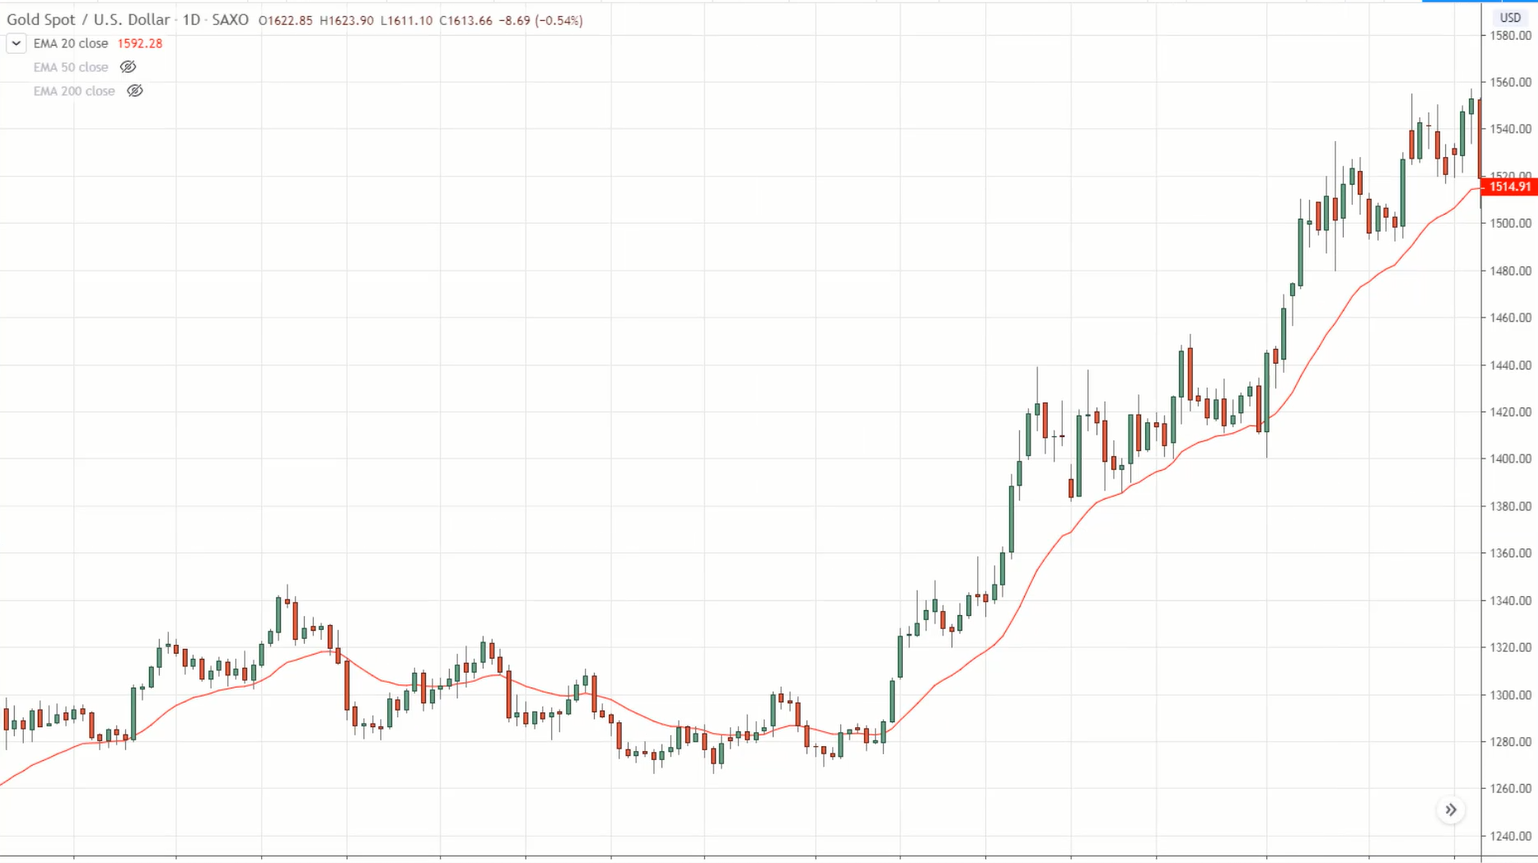
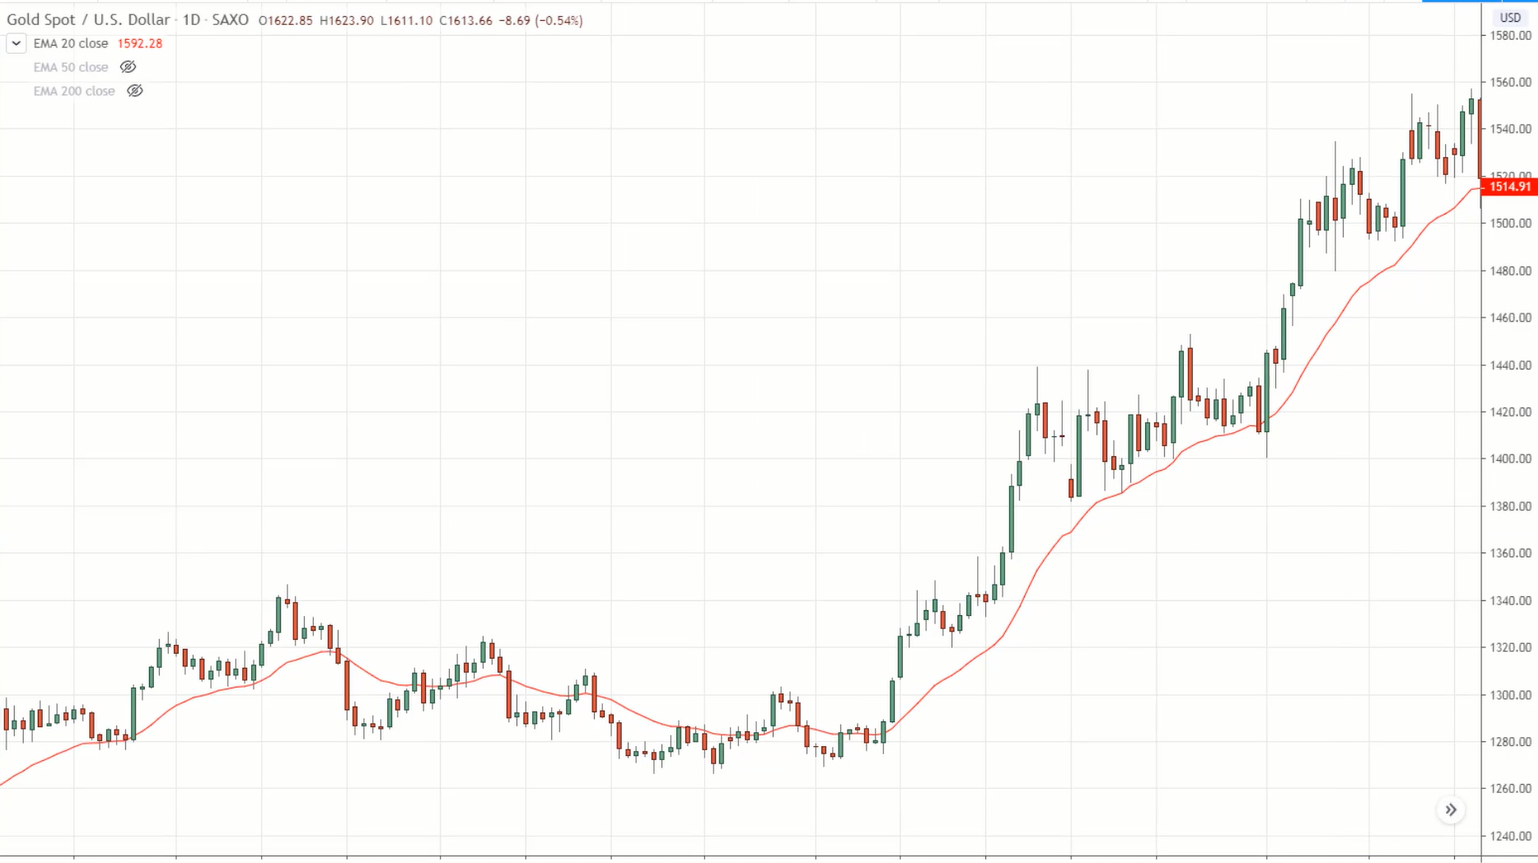
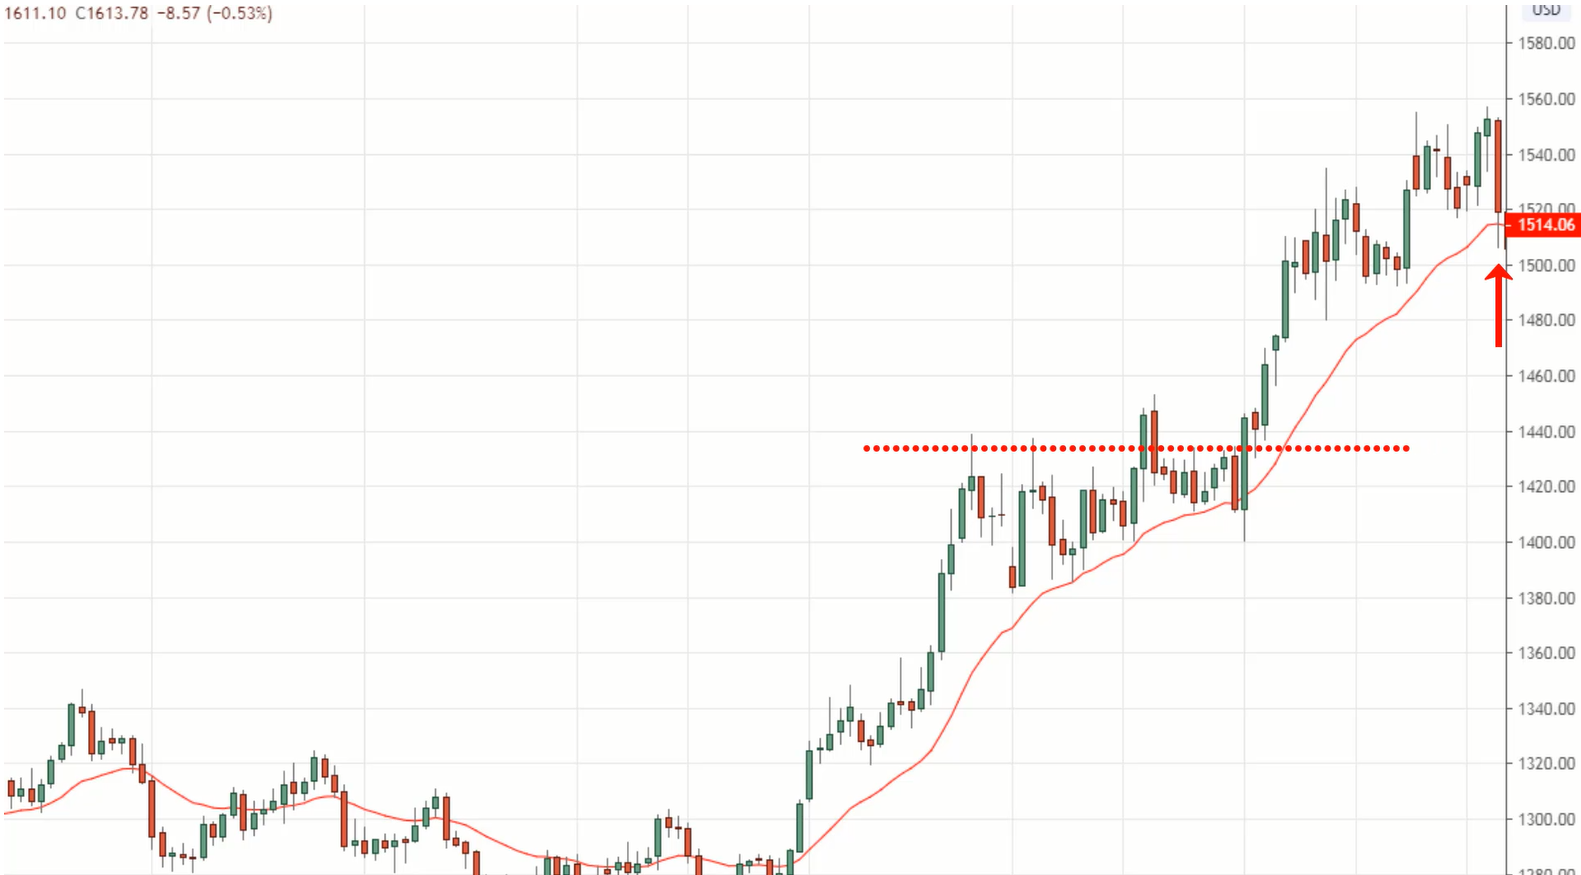
You can see at this point, Gold is in a strong uptrend. The price is above the 20 MA and holding above it consistently.
Then it broke below the 20 MA and started chopping up and down, breakout, and then came to where we are now.
So you can see that at one point in time, the market structure is in a strong uptrend then it evolved to a weak uptrend that we've seen earlier.
The key here as a professional trader is that you must always anticipate what the market could possibly do.
At this point in time…
If I'm trading this in real-time, I would tell myself that if the market were to break below the 20 MA and invalidate it, I would shift my thinking and say that this market is now no longer in a strong uptrend.
What are the other possibilities? Well, maybe it’s going to be moving into a healthy trend, maybe into a weak trend. Maybe it will start to range. And when that happens, where is the next area of value?
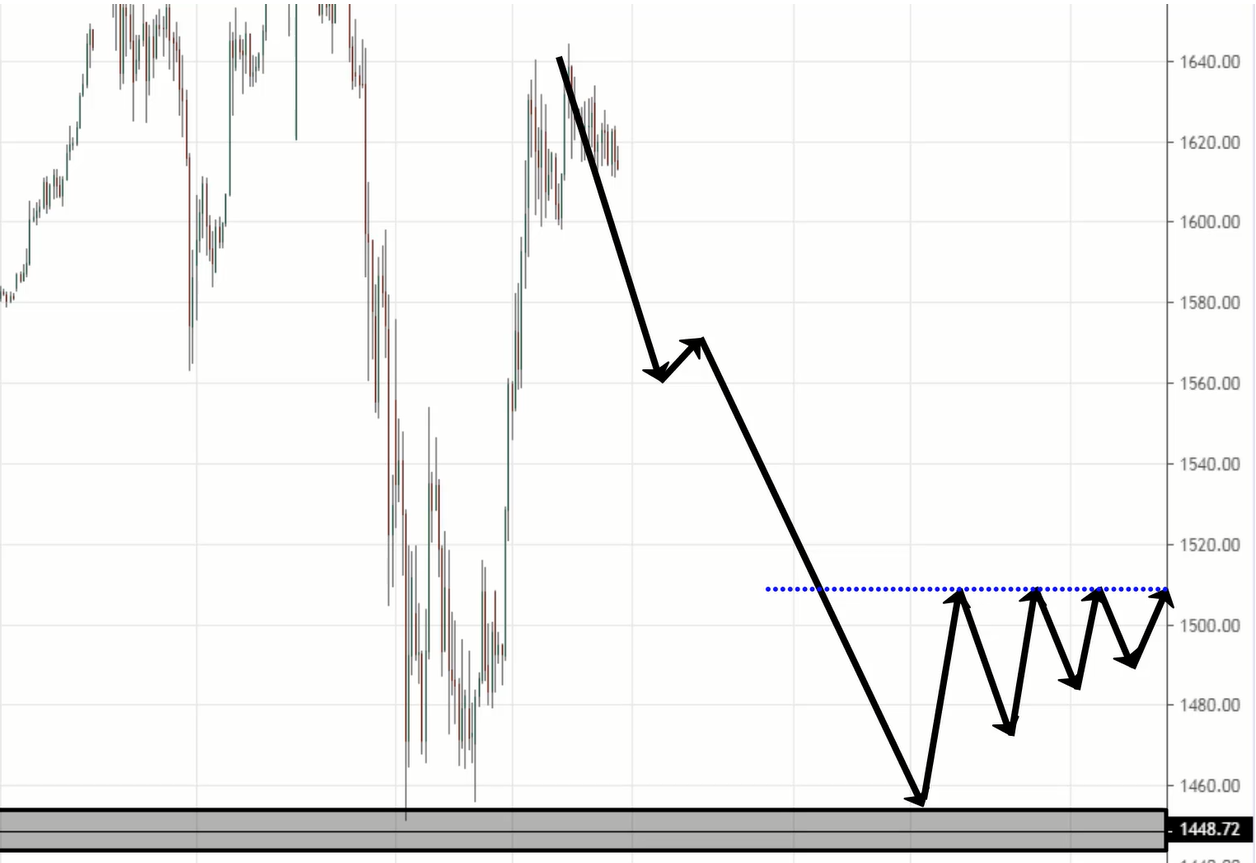
That's my thought process and I'll say, the next area of value could possibly be at this area of resistance, which could become support.
Or maybe the market will form a new structure as it swings up, then forms a new low and swings up once again.
Now we have a new price structure, which is actually the previous structure that we had over here.
You can see that these are the thought process that I'm going to have.
So the first key thing to take note for the bonus tip is that the market structure is always changing. You have to be prepared for it.
2. Identify multiple areas of value the market might react to
Let me give you an example.
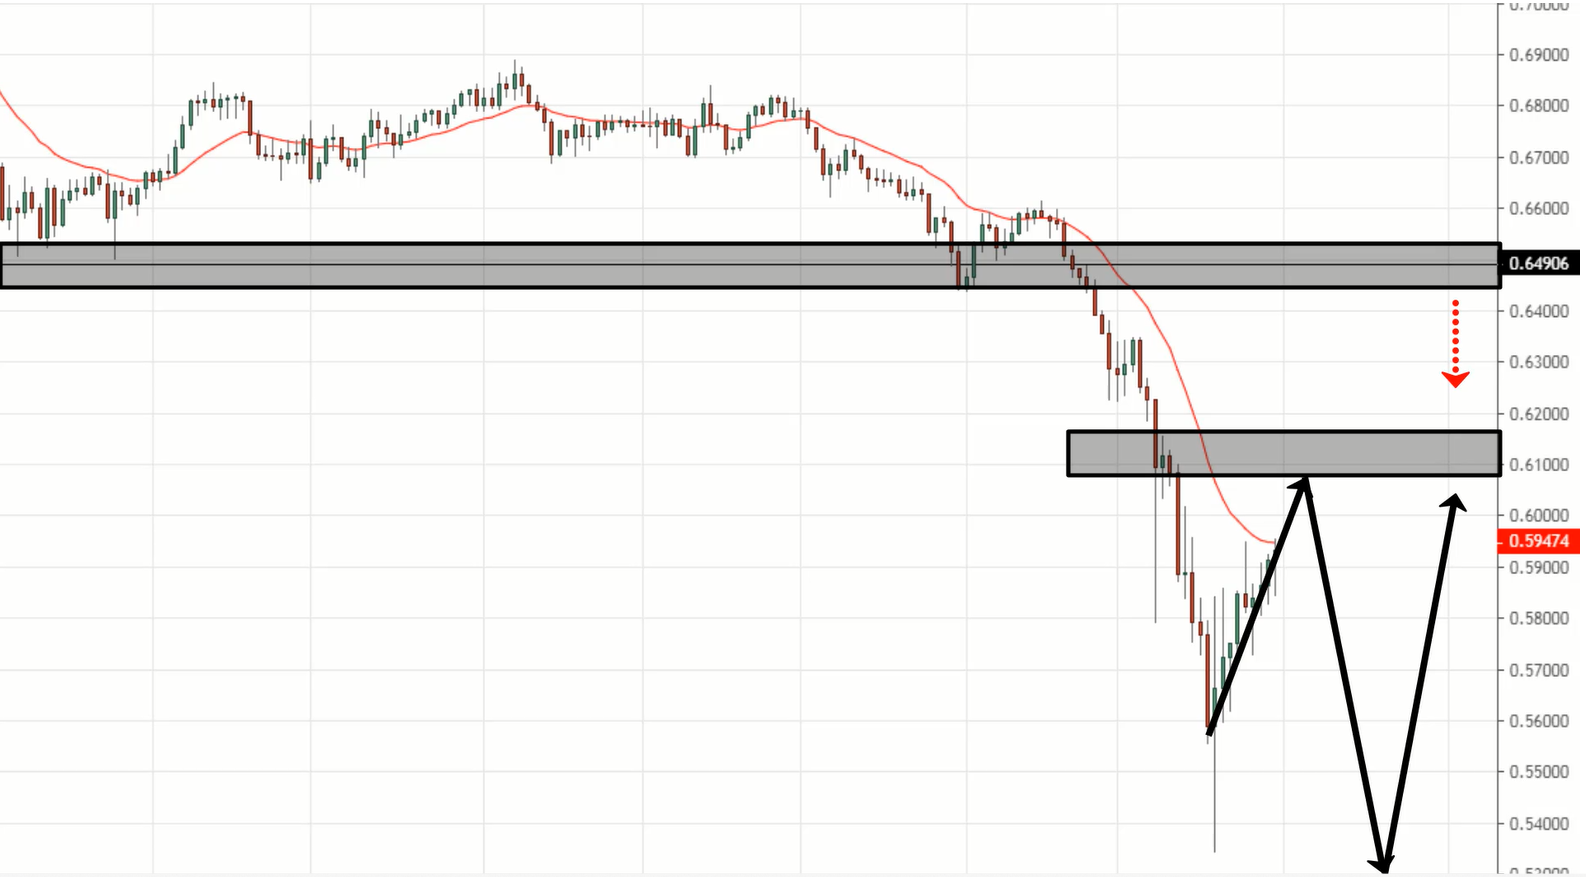
We talked about AUD/CHF earlier:
Now if the price were to breakout of this 20 MA and invalidate it, where is the next area of value on this chart? That is the question is on my head now.
It doesn't mean that this market is going to be in a strong trend forever just because it’s in a strong trend now. No, it could change into a healthy trend, or be moving into a weak trend.
If this 20MA gets invalidated, my next area of value would be over here:
I would start waiting at this area. That's one possibility.
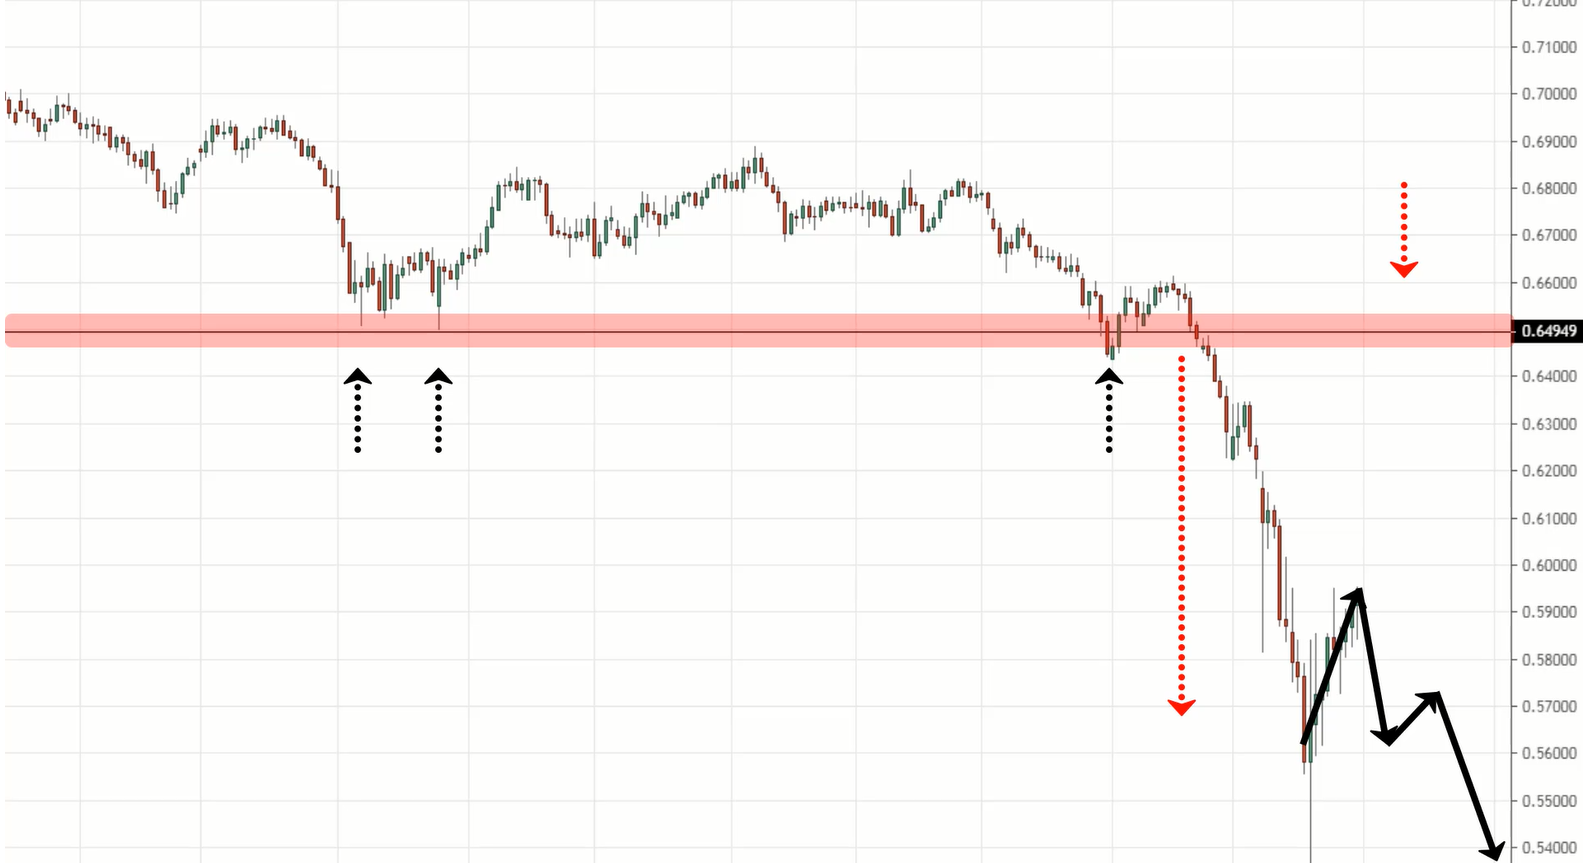
At the same time, I know that this market could possibly also form a new price structure for me to trade from.
Maybe the market could breakout from the 20 MA then reverse down lower. And then now this becomes a new price structure that I could trade from.
Maybe afterwards, it will come back up again, and this will be the new price structure that I should be paying attention to:
As a pullback trader, as a professional price action trader, you have to be anticipating all these, even before it occurs.
Because you can't just be having one specific setup, one area of value, then pray and hope the market comes to that area. If it doesn't come then it’s game over.
It doesn't work that way.
You’ve got to think one or two steps ahead. And hopefully, by the end of today's training, I have prepared you well for that. And again, focus on the concepts.
Don't just focus on the specific techniques, patterns, or whatsoever. It’s the concepts that matter.
Don't ask me questions like, “Oh, Rayner, can I use a 21 MA? Can I not use the 50 MA, can I use the 52MA instead?” That would really hurt my feelings.
Focus on the concepts, not the specific parameters whatsoever.
If you're going to use the 20.5 MA or a 50.7 MA, go ahead. It doesn't really make much of a difference. The concept is what matters.
Here’s a quick recap…
Recap
- The market can pull back to support resistance, moving average, trendline, etc.
- Don’t enter your pullback trades too early, let the price come to your area of value
- Understand the market structure (strong, healthy or weak trend)
- Identify multiple areas of value because the market is always changing – don't be fixated on just one area
With that said, I have come towards the end of today's training. I wish you good luck and good trading. Until next time.

