#12: 5 Things To Look For Before You Place A Trade
Lesson 12
In today's training, I want to share with you five things to look out for before you place a trade.
Because when you're trading the markets, there are many things to look out for, e.g. support and resistance, trendline, multiple time frame analysis, indicators, candlestick patterns, chart patterns, etc.
You are overwhelmed and confused and you don't know what to do.
In today's video, I'm going to break it down to you step by step and point you in the right direction to focus on these five things.
If you can focus on these five things, you can ignore everything else.
Let’s get started…
Market Structure
The point of market structure is about asking yourself, where's the path of least resistance?
If the market is in an uptrend then what you want to do?
You want to buy it. We're going to be buying in an uptrend.
Likewise, if a market is in a downtrend, and what should you do?
You should be selling in a downtrend.
If the market is in a range you can trade both sides either you are buying or selling.
That is what you're trying to do in the first step.
Identifying the market structure, the path of least resistance.
The way to do it is to classify the type of trend the market is in.
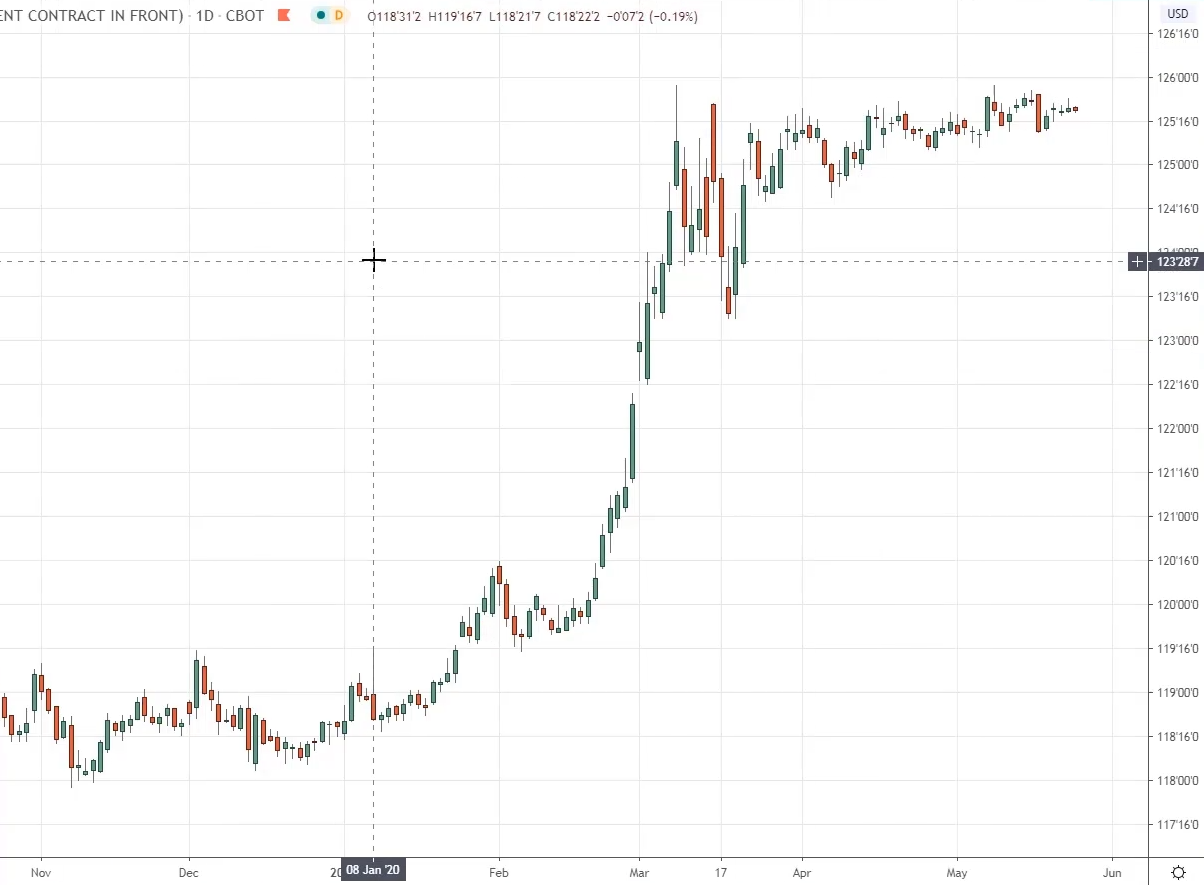
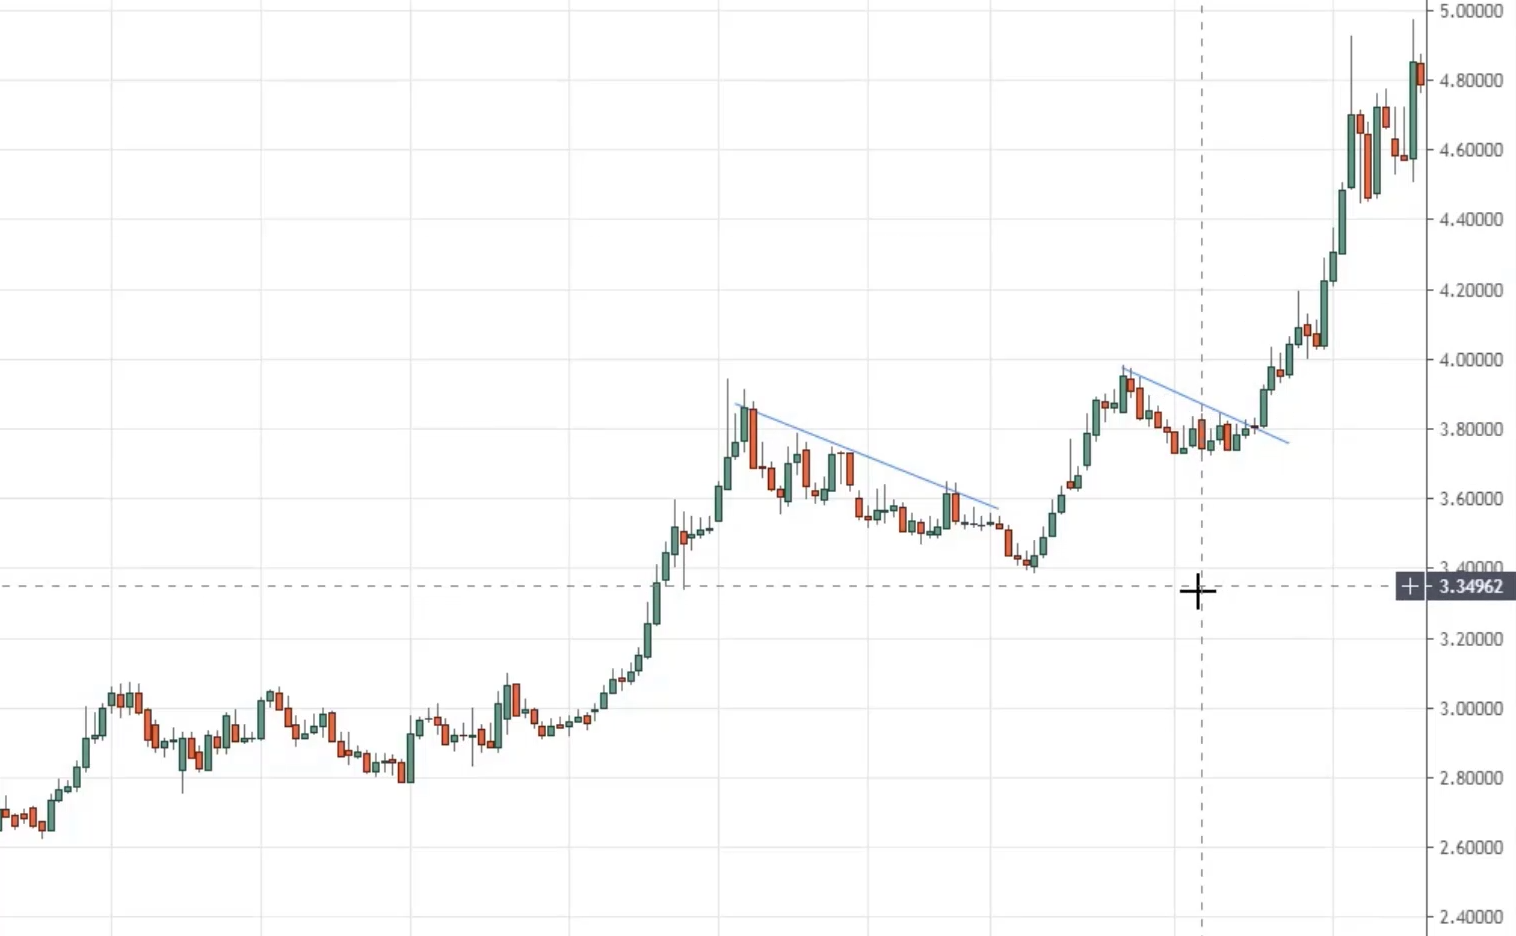
Example on 5 Year T-Note...
What is the trend of this market?
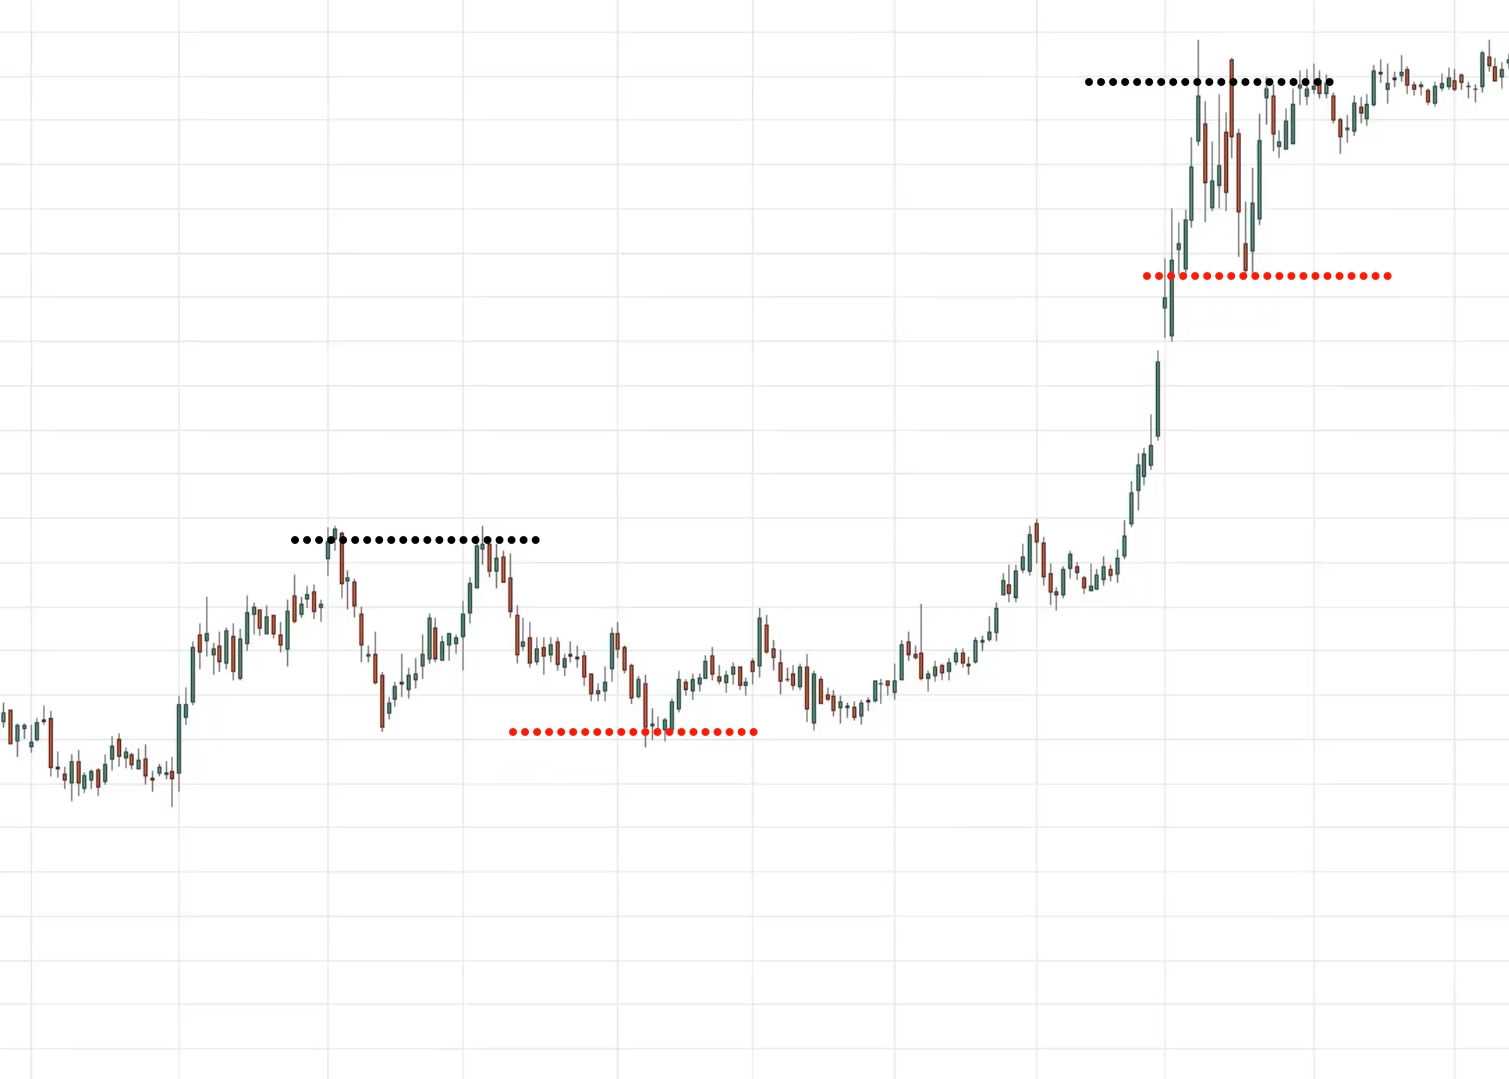
I'm sure you can agree that this is an uptrend. The price is making a series of higher highs and higher lows over time.
Simple stuff…
In this type of market condition in this time frame, you want to be looking for buying opportunities.
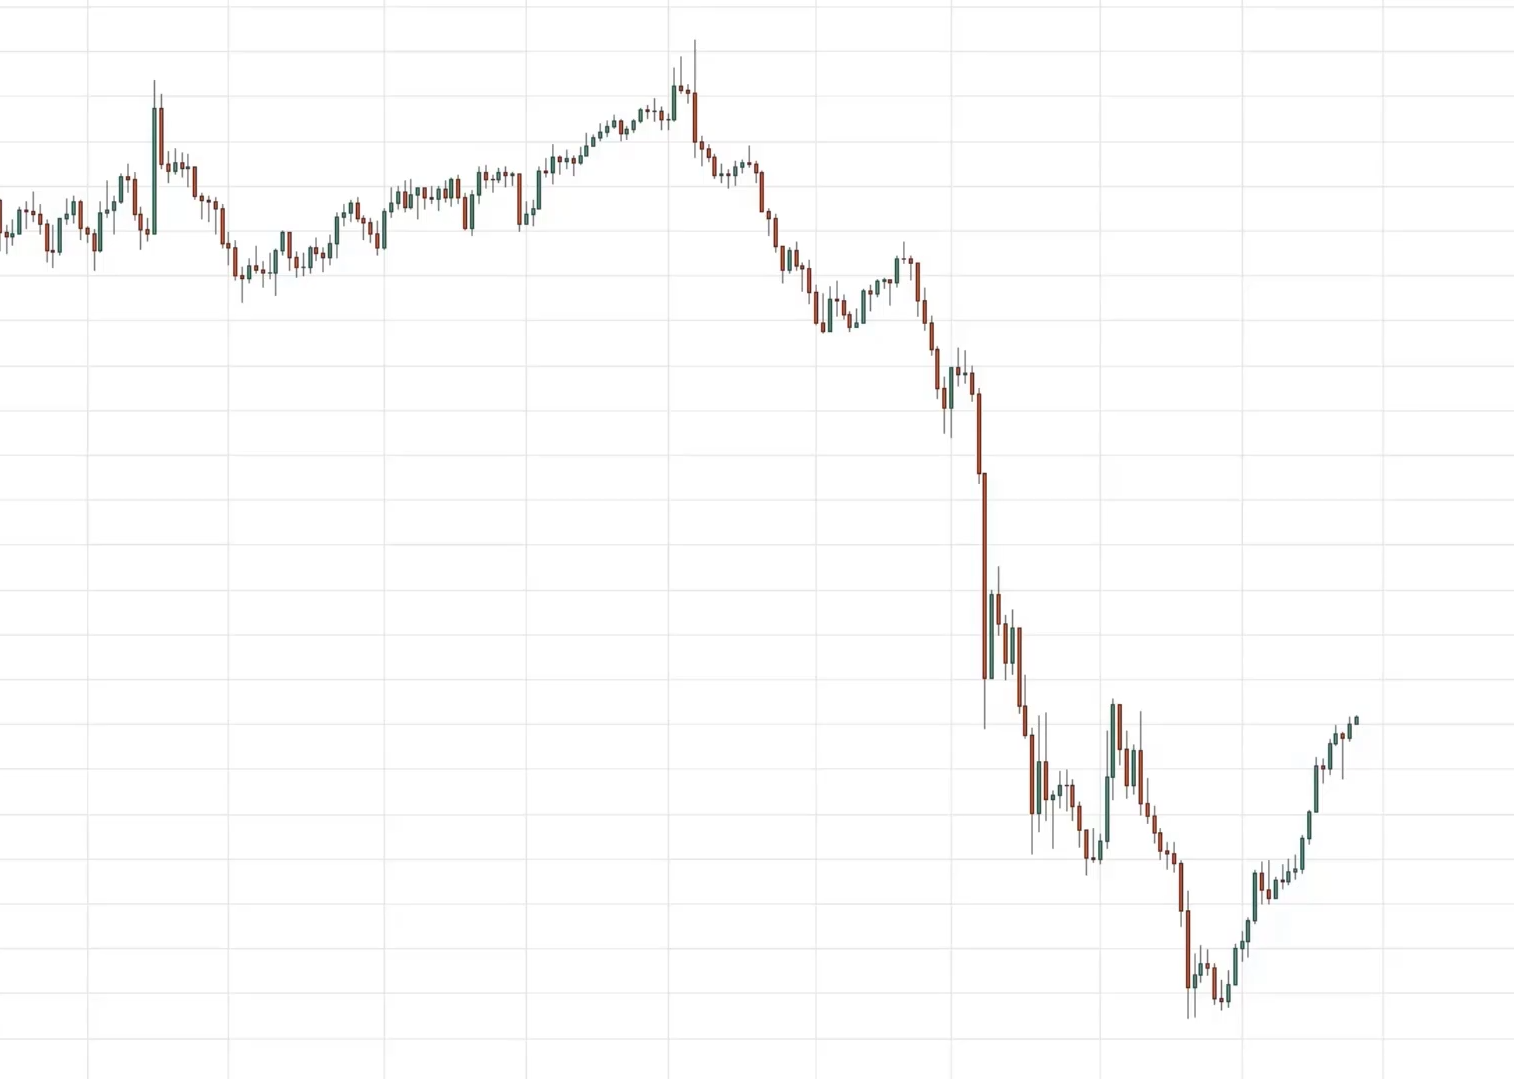
Example on Brent Crude Oil Daily...
What is the market structure?
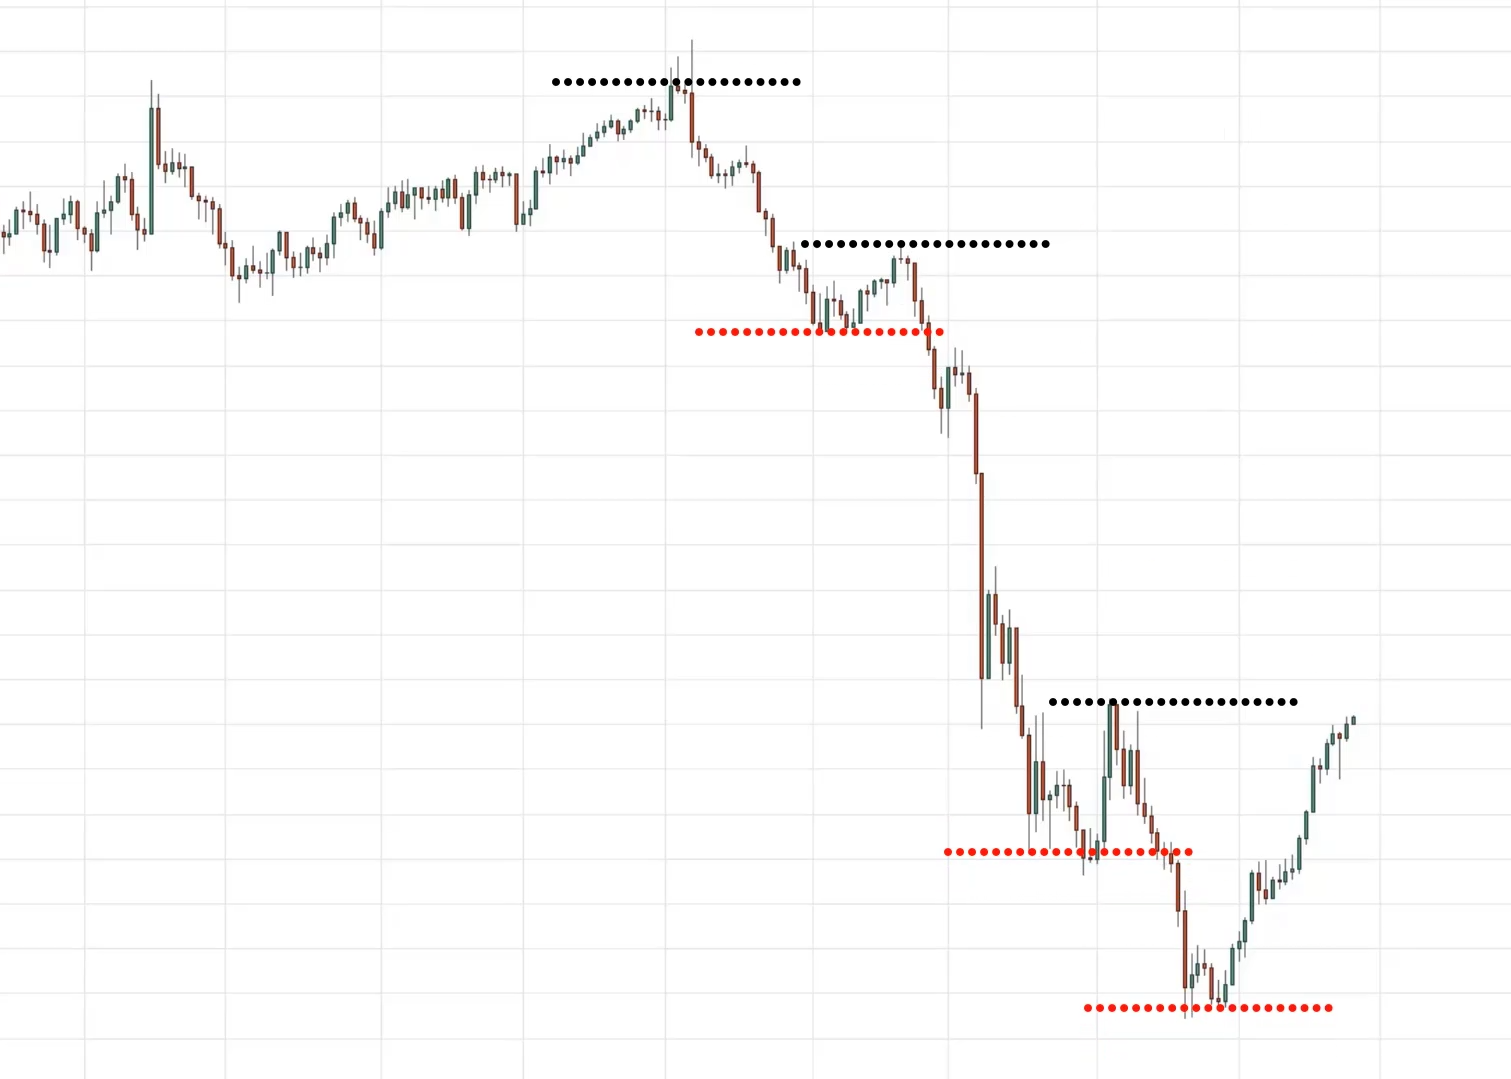
It’s simple stuff. Don't complicate things, series of lower highs and lower lows.
What should you be doing?
You want to look for selling opportunities in this market condition.
I know some of you might be thinking,
“Rayner these examples, they're as clear as daylight. But there are times you know, it's not so straightforward Rayner!!!”.
I get it right.
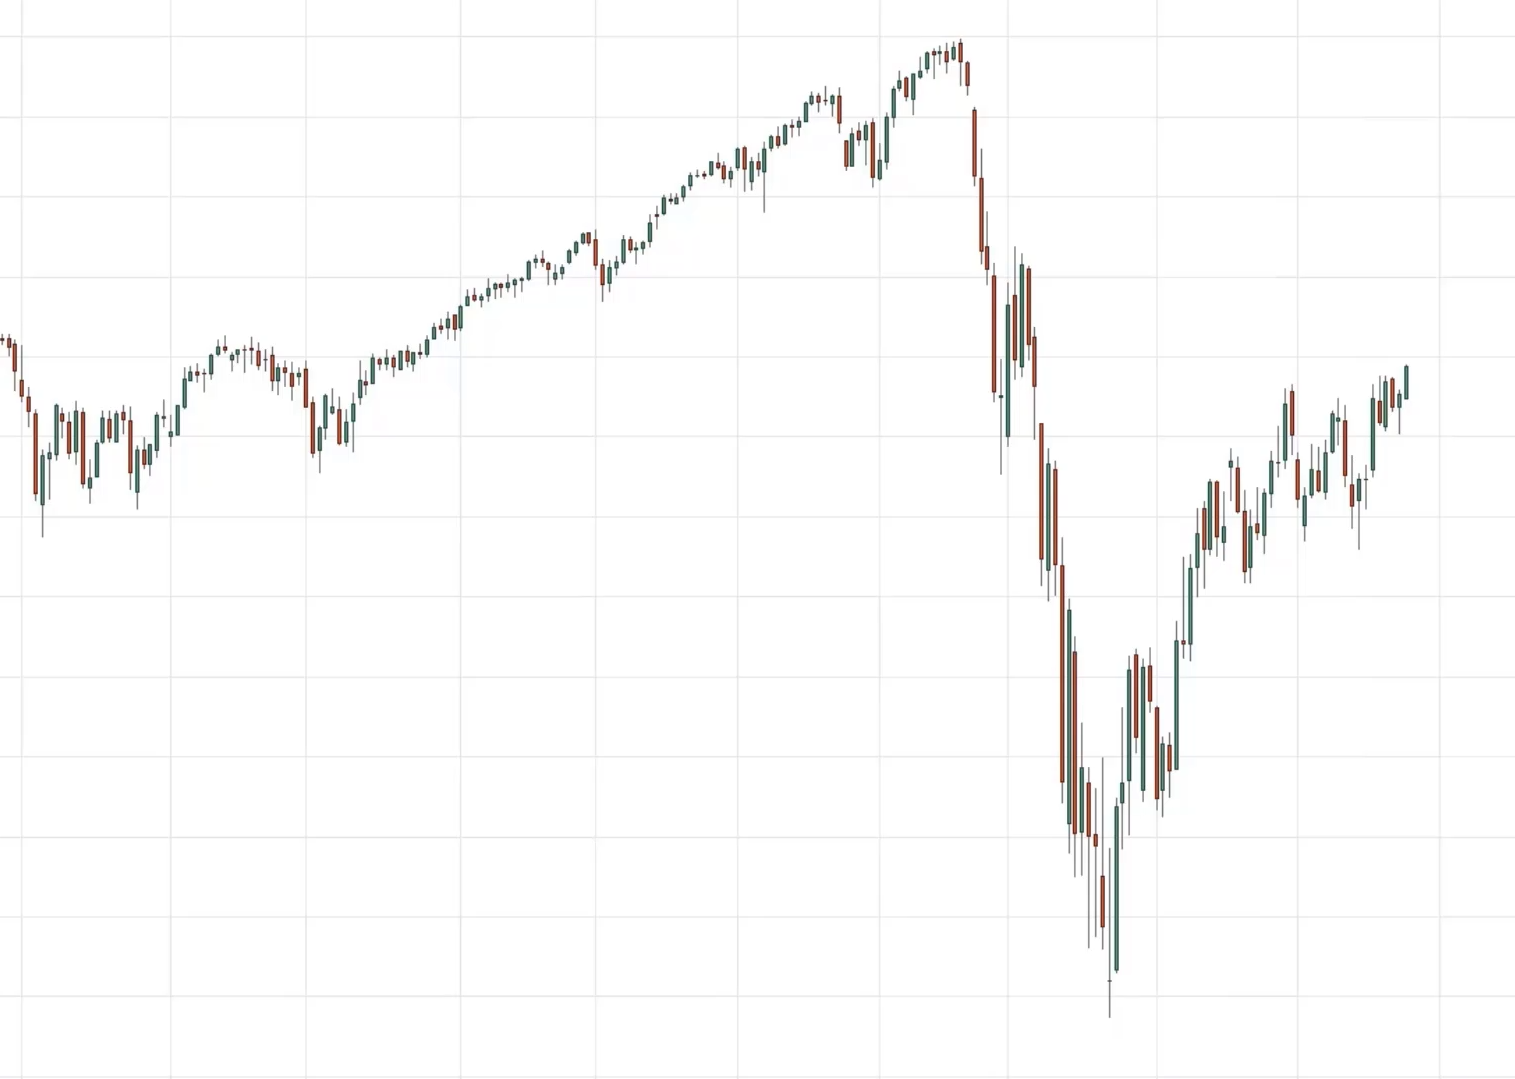
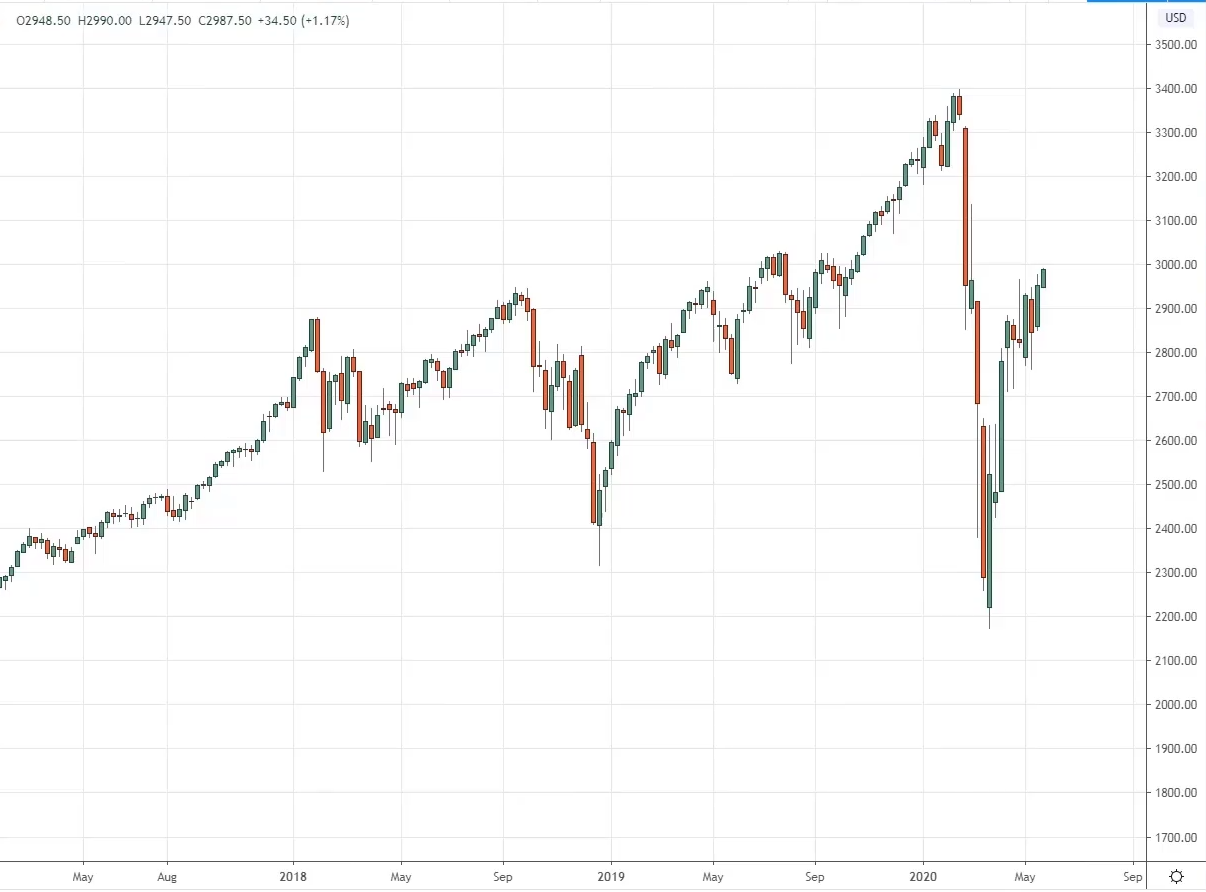
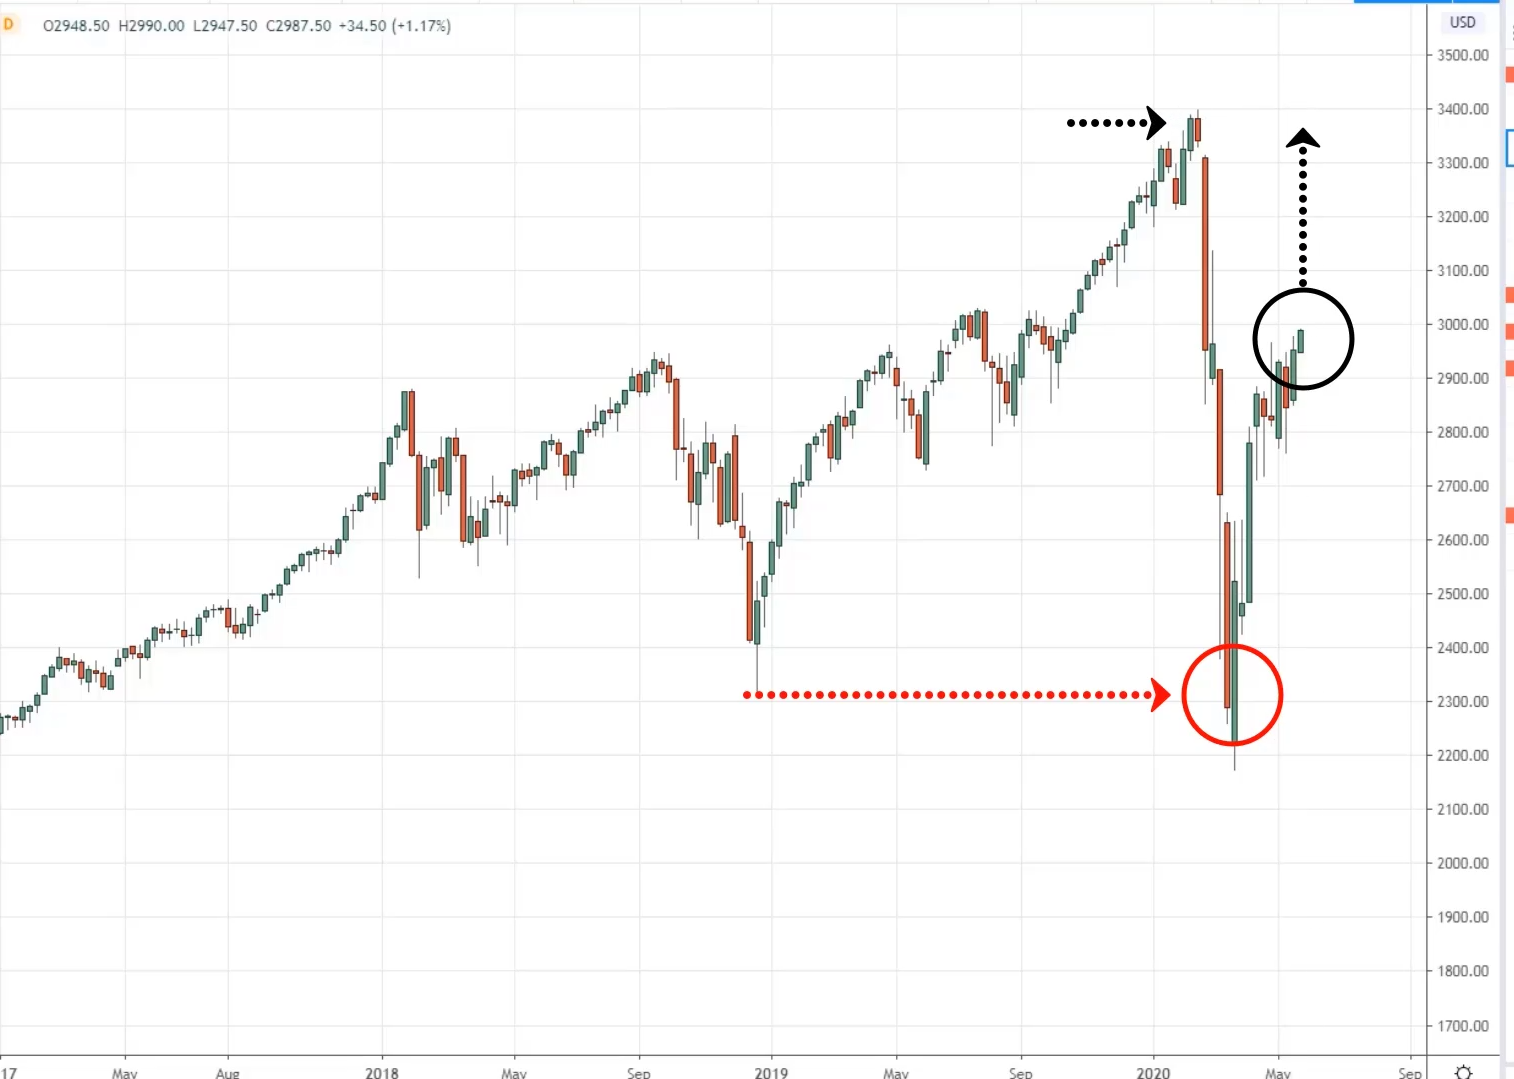
Let me just share with you some less straightforward example on the S&P 500…
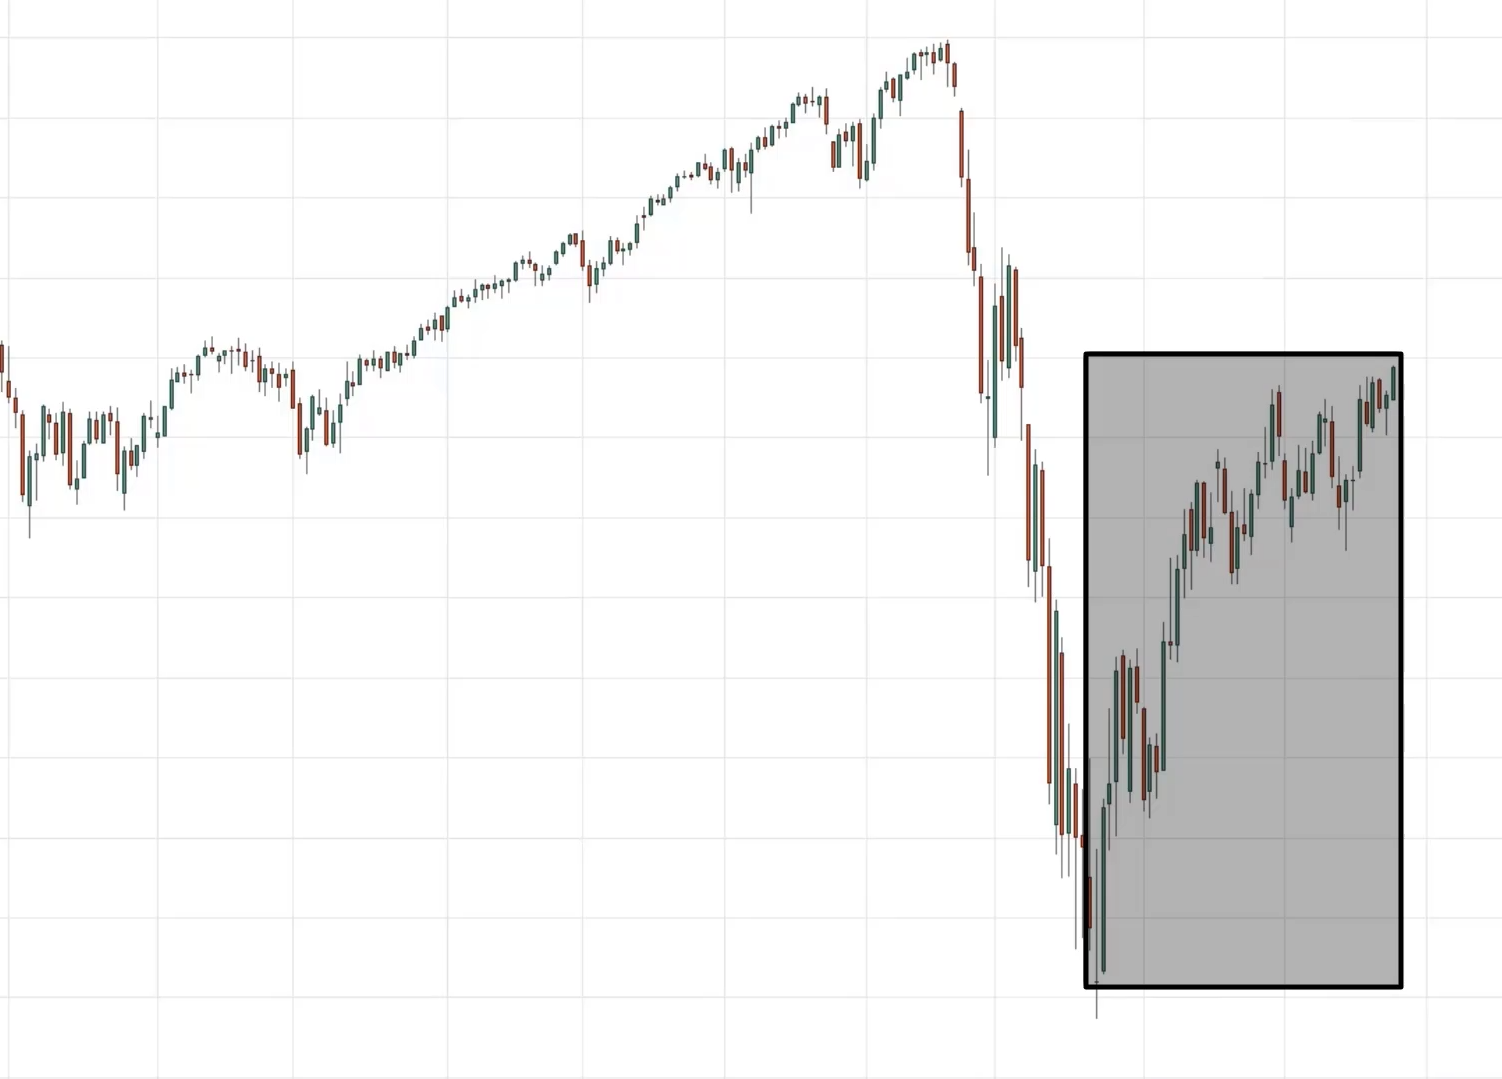
From the looks of things, you might think that.
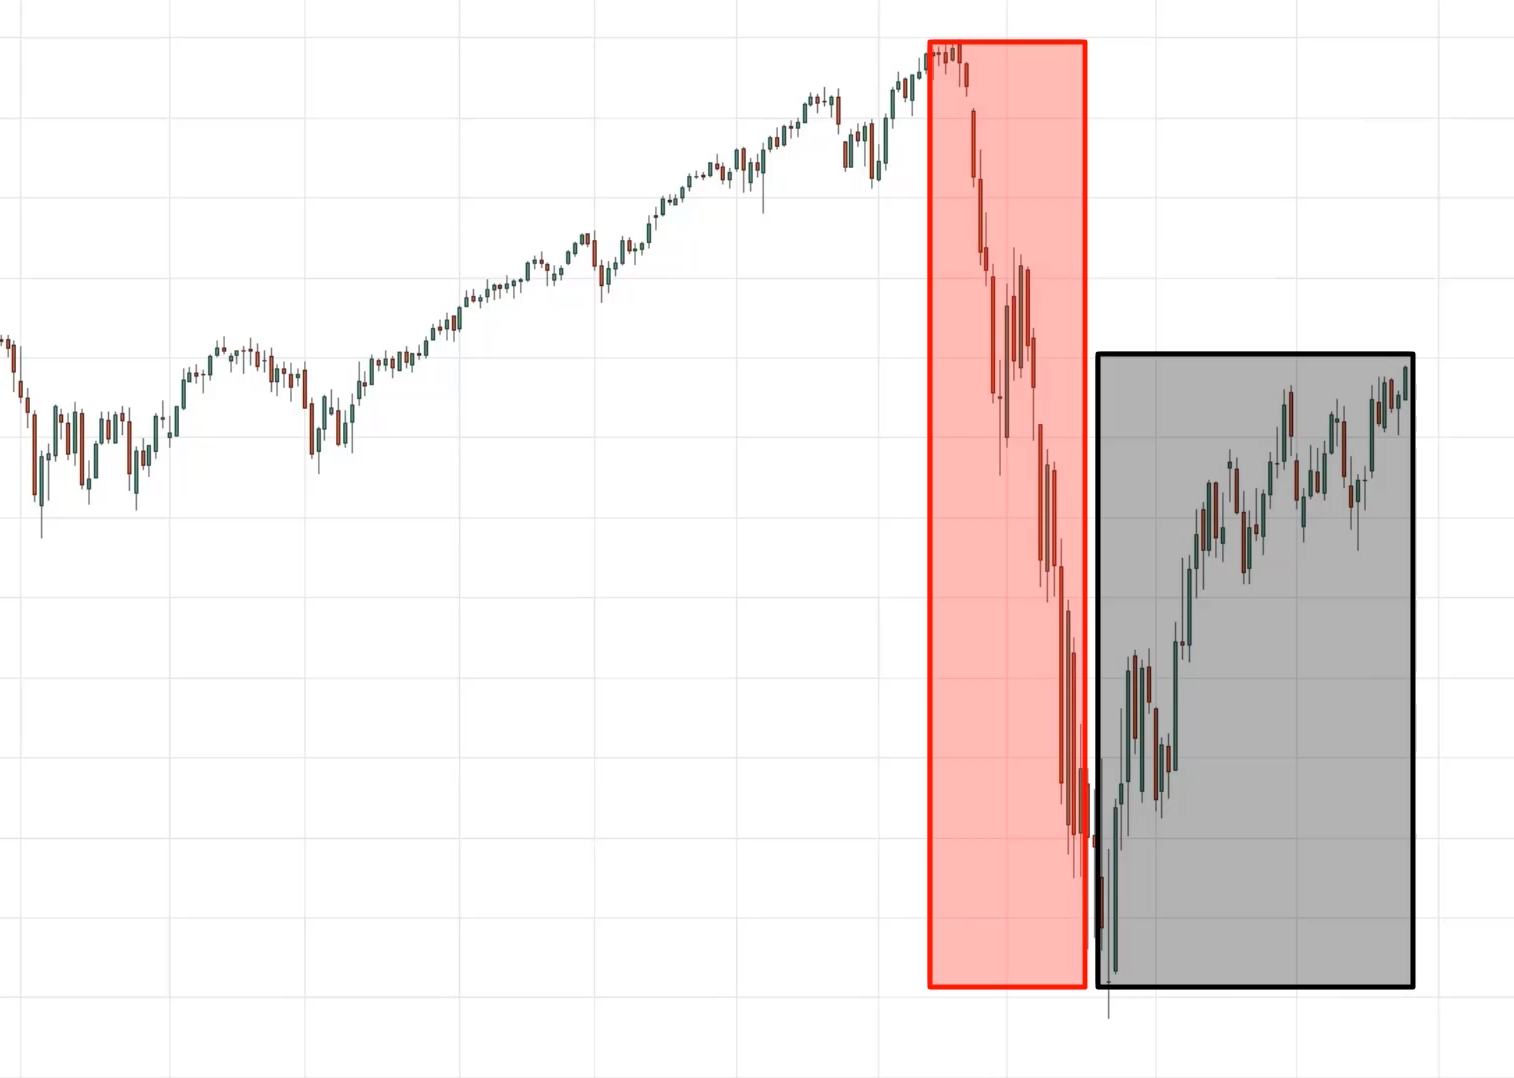
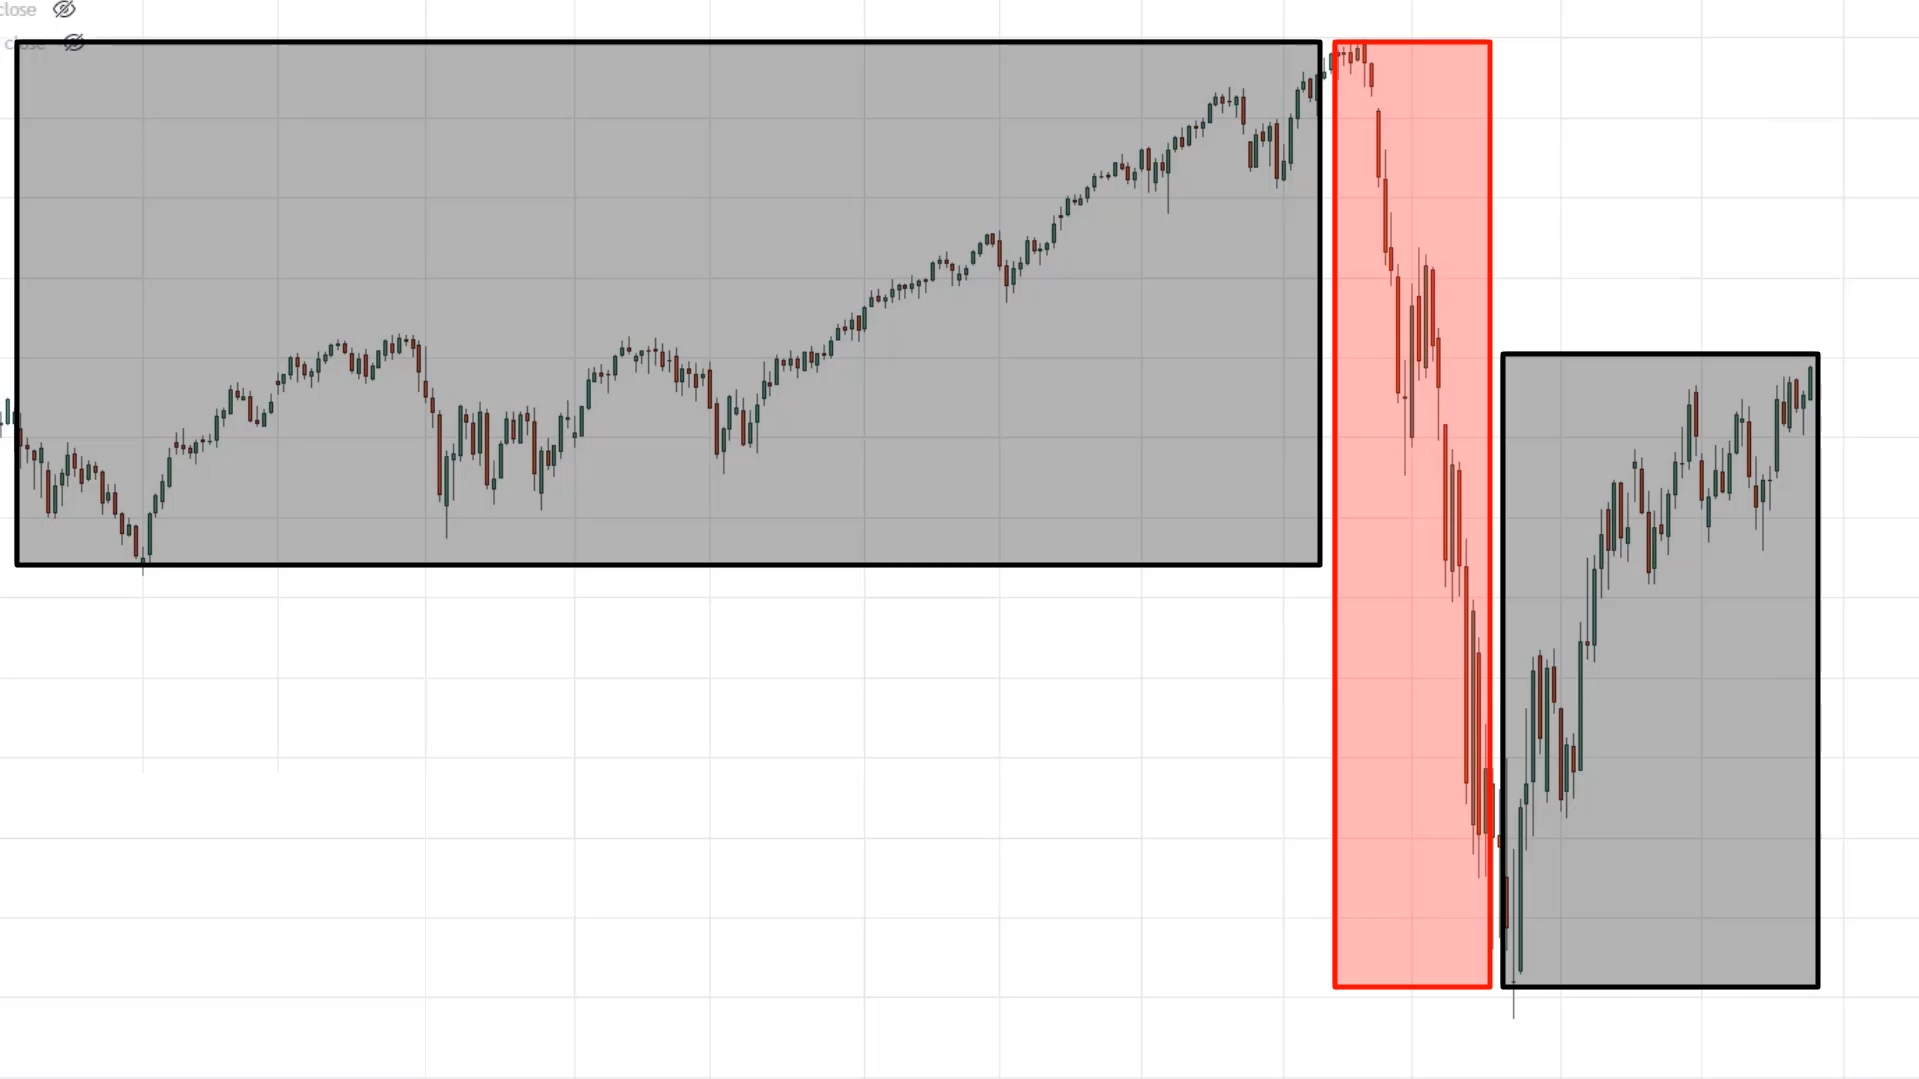
“Rayner this is an uptrend, you should be buying look at this market heading higher”
But then if you look back a little bit more, there’s this strong bearish momentum towards the downside as well.
But if you look even further back, there's this uptrend over here.
“Ah, Rayner help!!! Should I be buying or selling?”
This is where a little bit of multiple time frame analysis comes into play.
If you are looking at a certain time frame and you can’t tell whether you should be buying selling just go up one-time frame higher and see the big picture things will be clearer then.
In this case, since this one is the daily timeframe, you want to go up a timeframe higher, which is the weekly timeframe.
If you look at the weekly timeframe, things are different, isn't it?
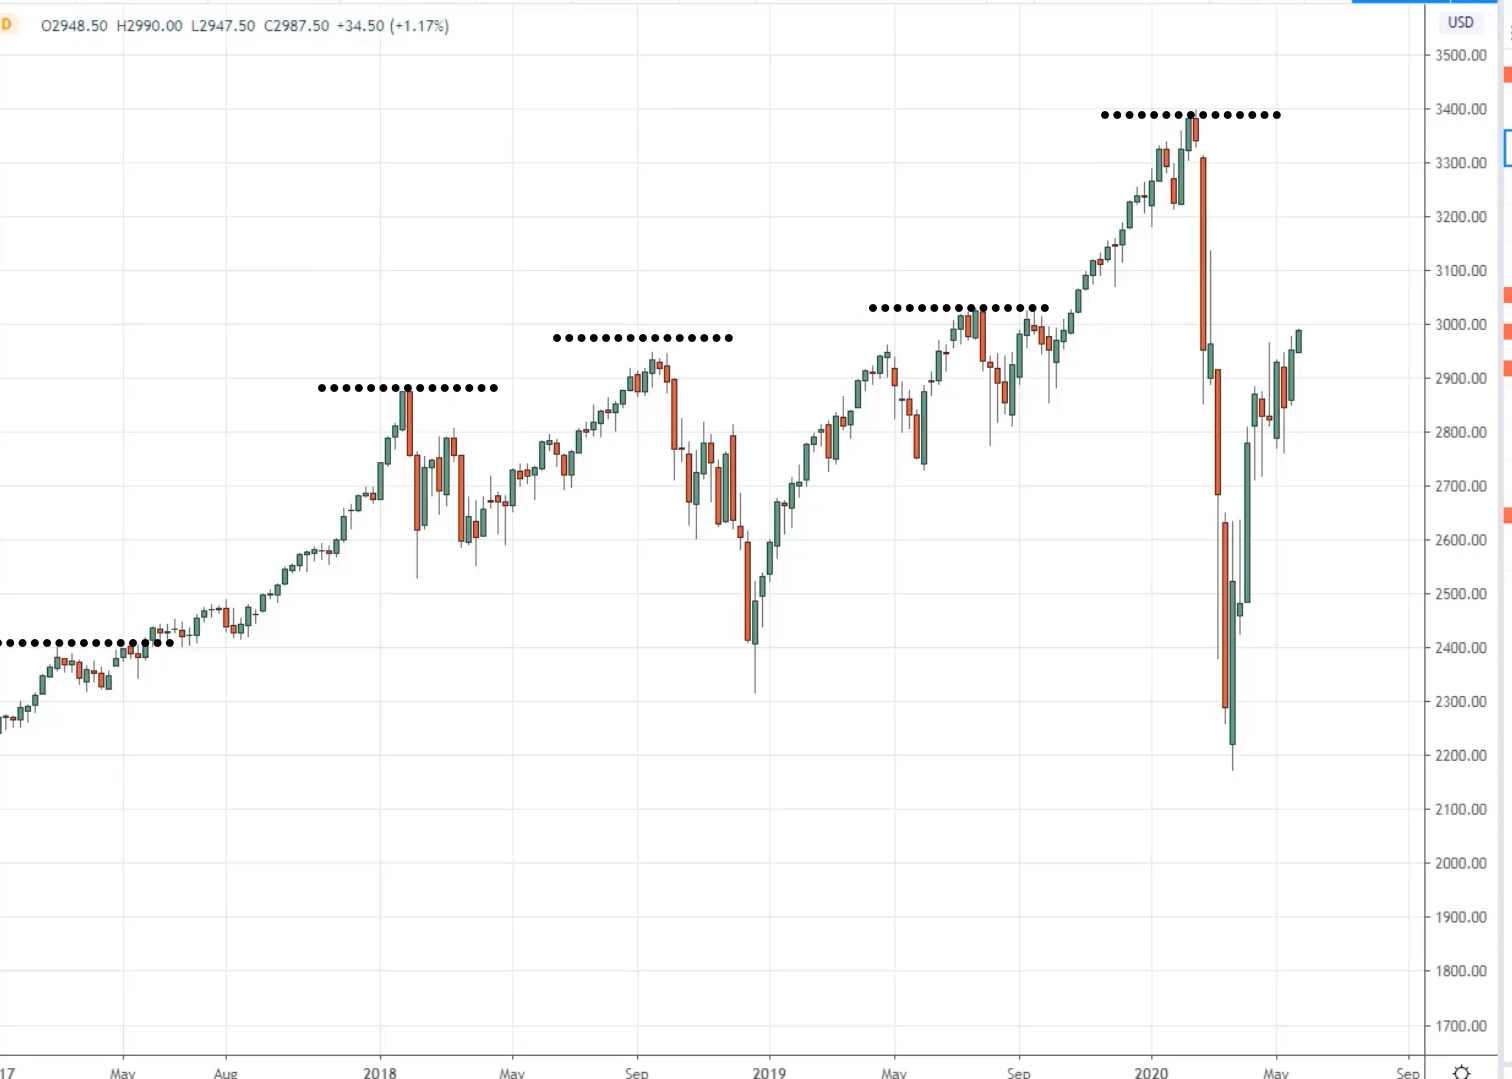
At this point, you can see that this market in the long term it's in an uptrend.
You still see a series of higher highs made over time.
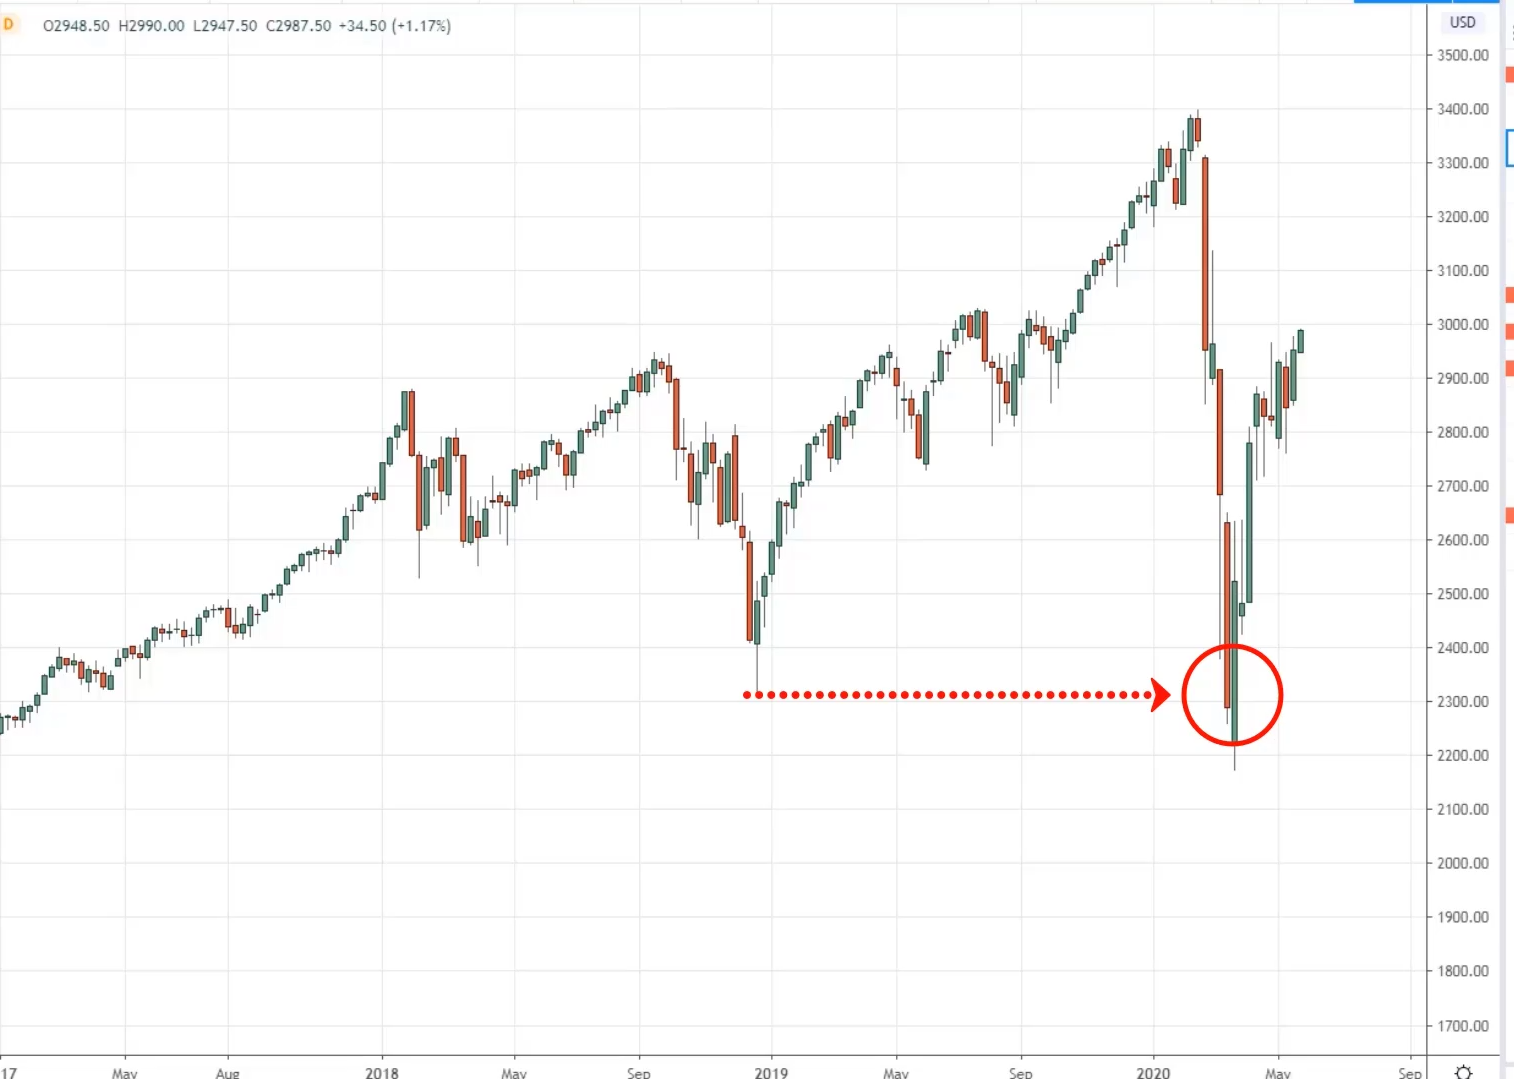
You don't necessarily have a higher low because at this point the price has taken out this previous area of support this swing low.
You can agree that at this point, the price is still heading higher.
About to retest these highs over here possibly.
At this point, you can conclude that the overall trend is still towards the upside and you want to look for buying opportunities.
Golden Tip
“If you are in doubt, stay out”
There are so many markets out there, don't force yourself to trade a certain market if it's not clear.
There will be times, trust me even though you've applied the concept I’ve shared with you looking up a higher time frame, you will still be confused.
“I don't know where they should be buying or selling”
Hey, stay out of the market. No one is pointing a gun in your head and tell you to place a buy order.
Let's move on…
Area of Value
Once you've identified the market structure, the next thing to look out for is the area of value.
Where my potential buying or selling pressure is coming. Just because the market is in an uptrend, it doesn't mean that you want to be buying immediately because the market might be ready for a reversal.
It might be it’s about to make a pullback.
You want to trade from an area of value and area of value can be defined in numerous ways it can be support and resistance, trendline, moving average, channels, etc.
There are many ways to define an area of value.
I'm just going to walk you through a few ways right to define it.
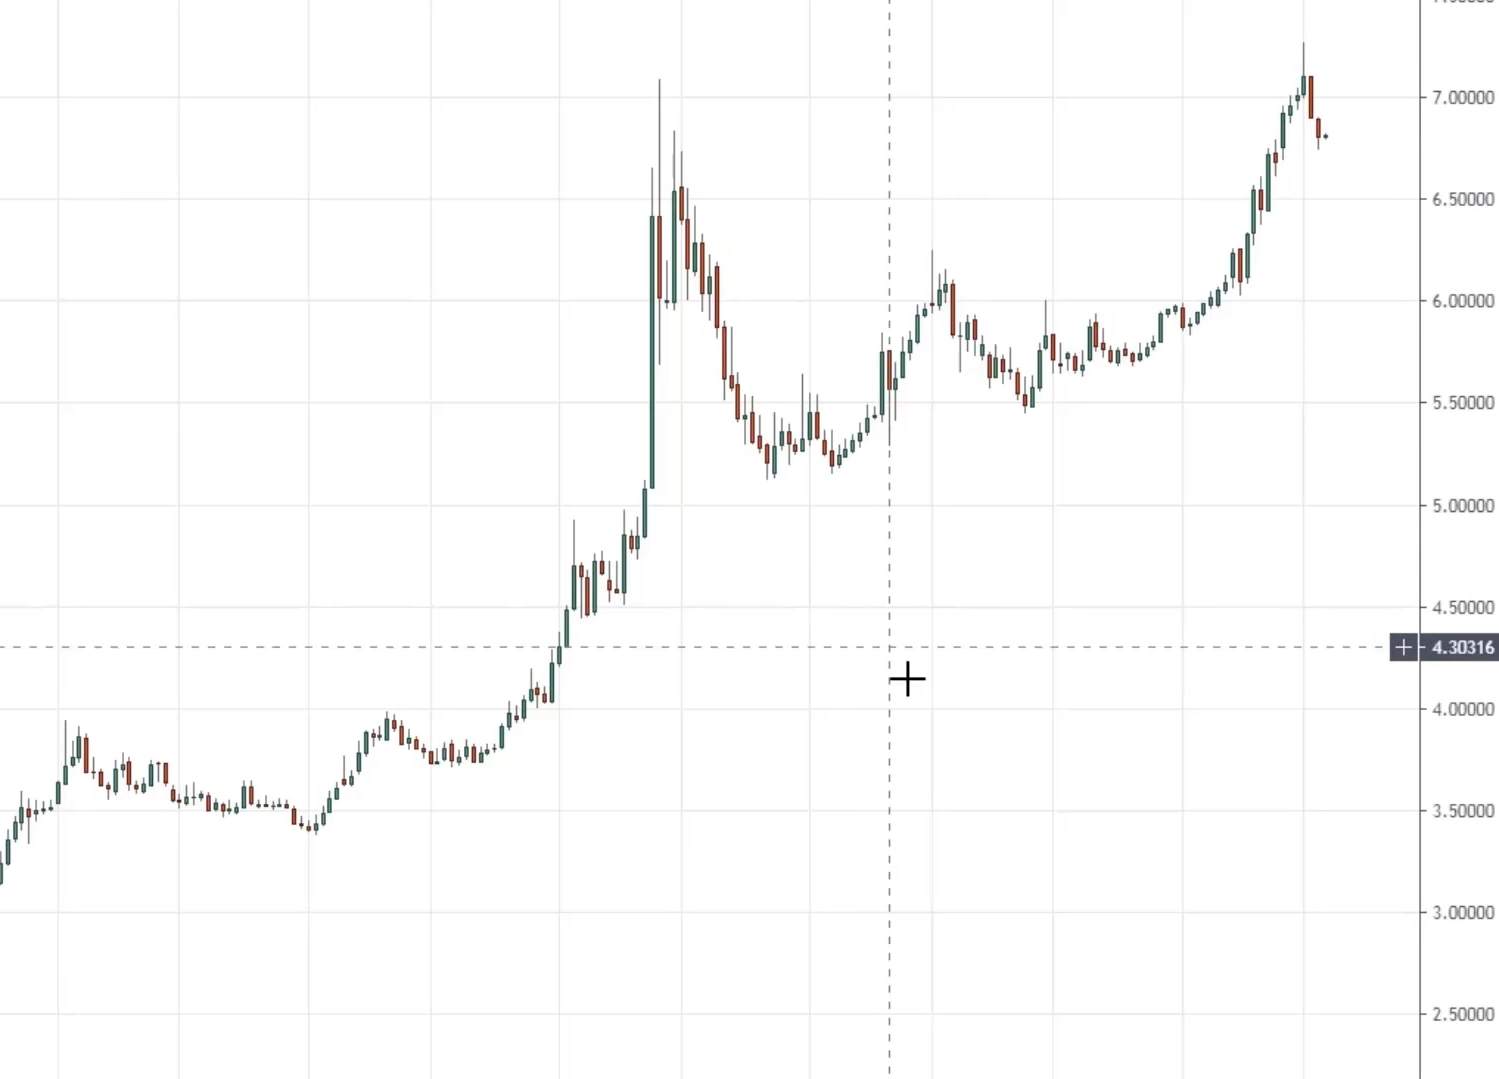
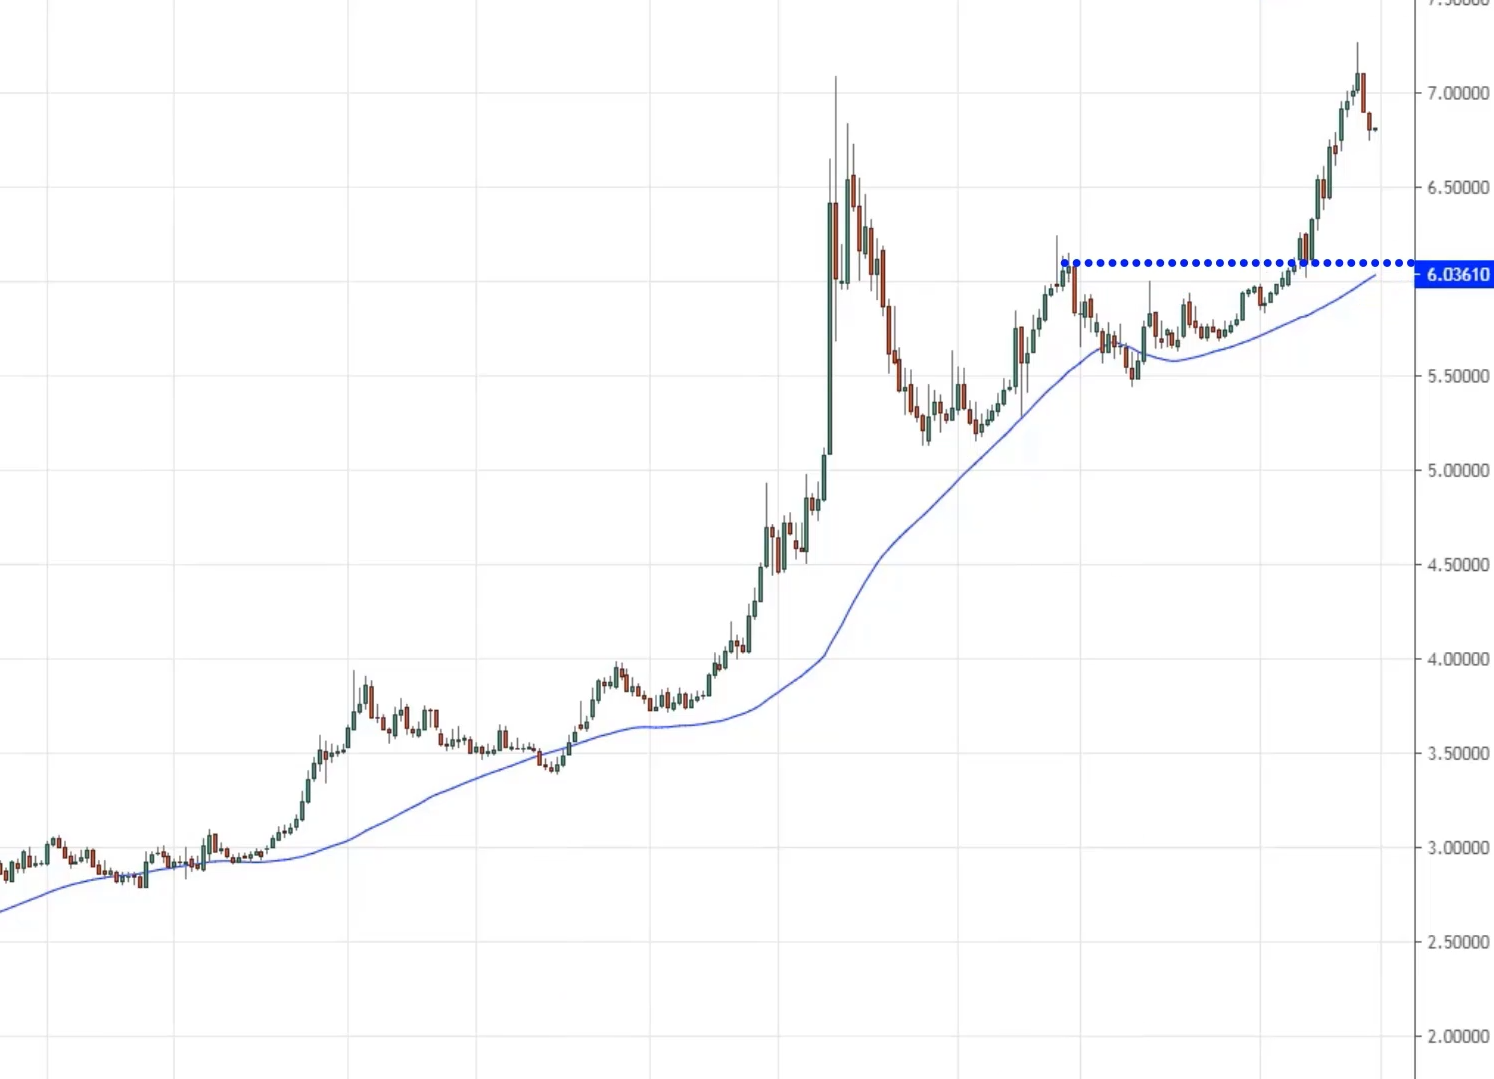
Example on USDTRY daily...
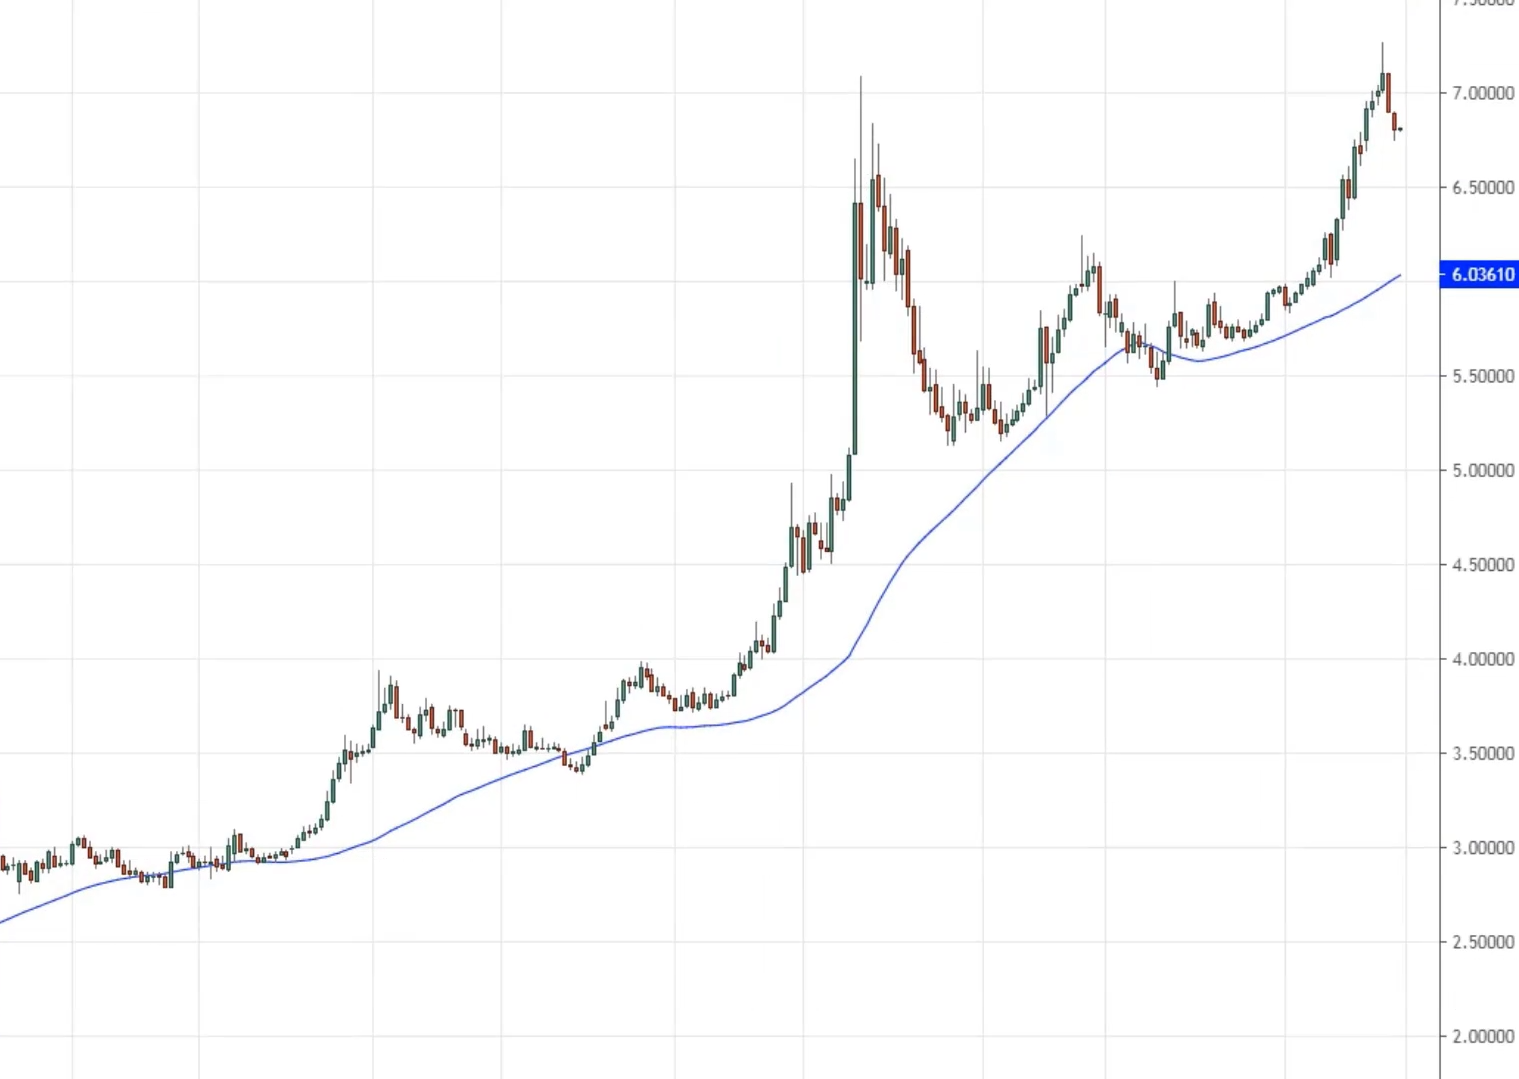
If you look at the weekly time frame, you would see that the areas of value might not be very obvious, but when you pull up a moving average, in this case, the 50-period moving average.
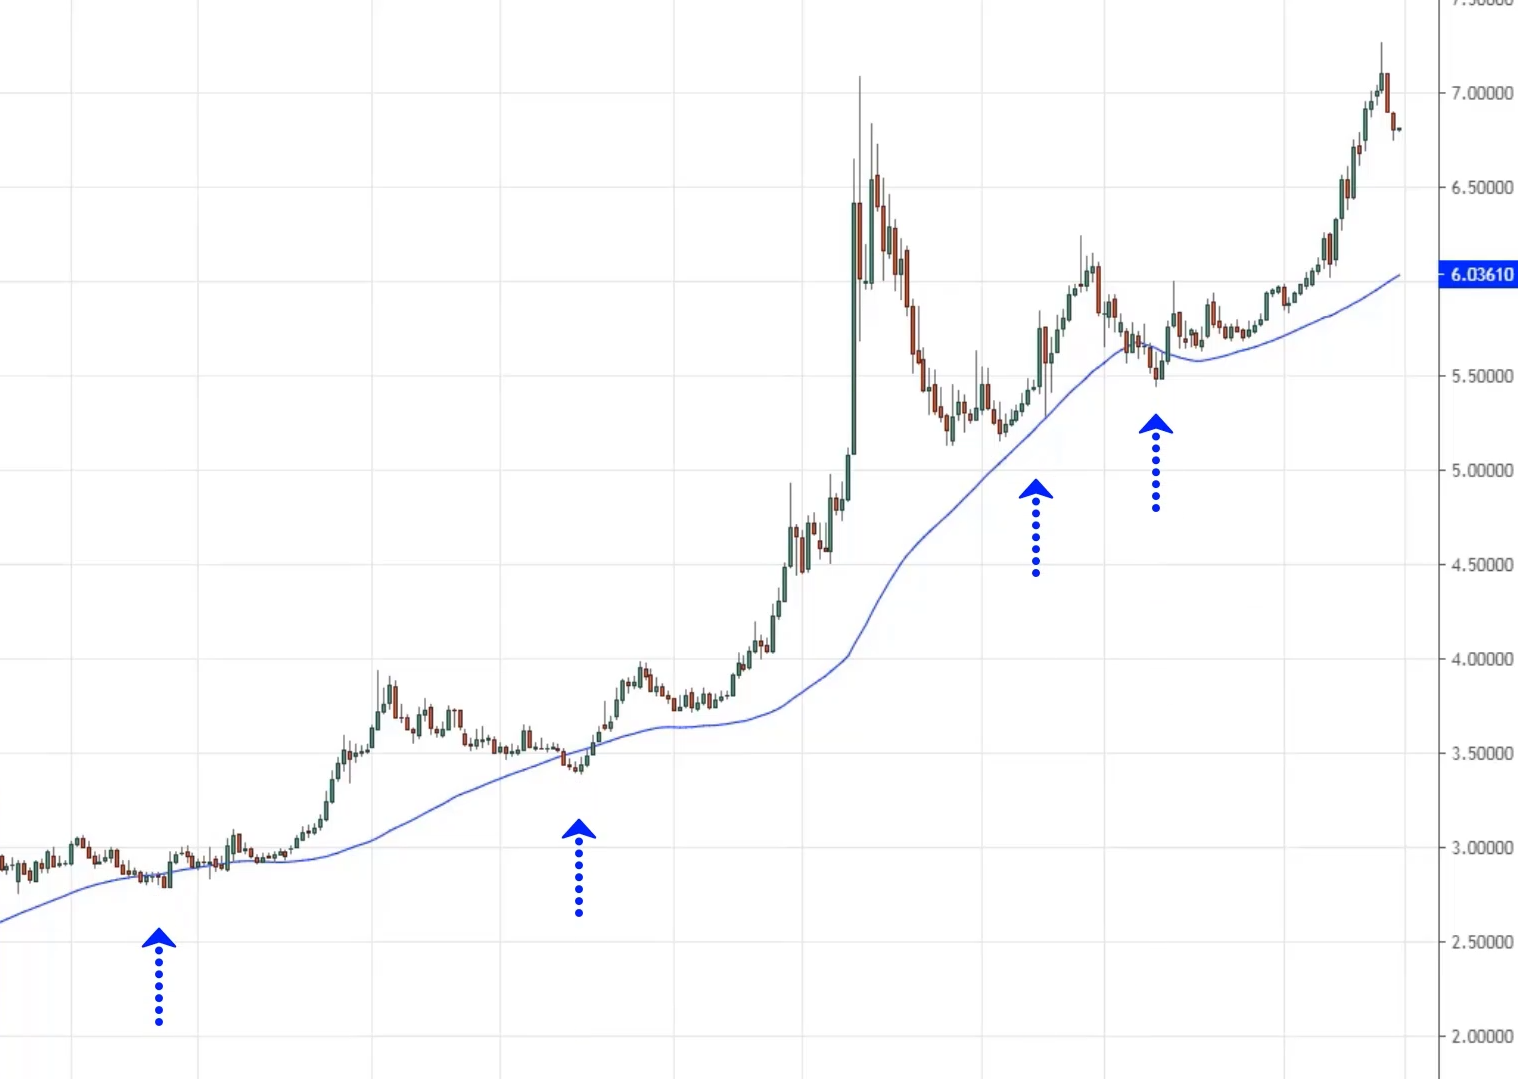
You find that this market tends to find value at the 50-week moving average.
Tested almost four to five times.
That's the ones over here twice price almost four, four times, five times. There’s a good chance that you might find value at this $6 price point.
Which is a confluence of this area of resistance?
This is an area of value to look out for on the USD/TRY.
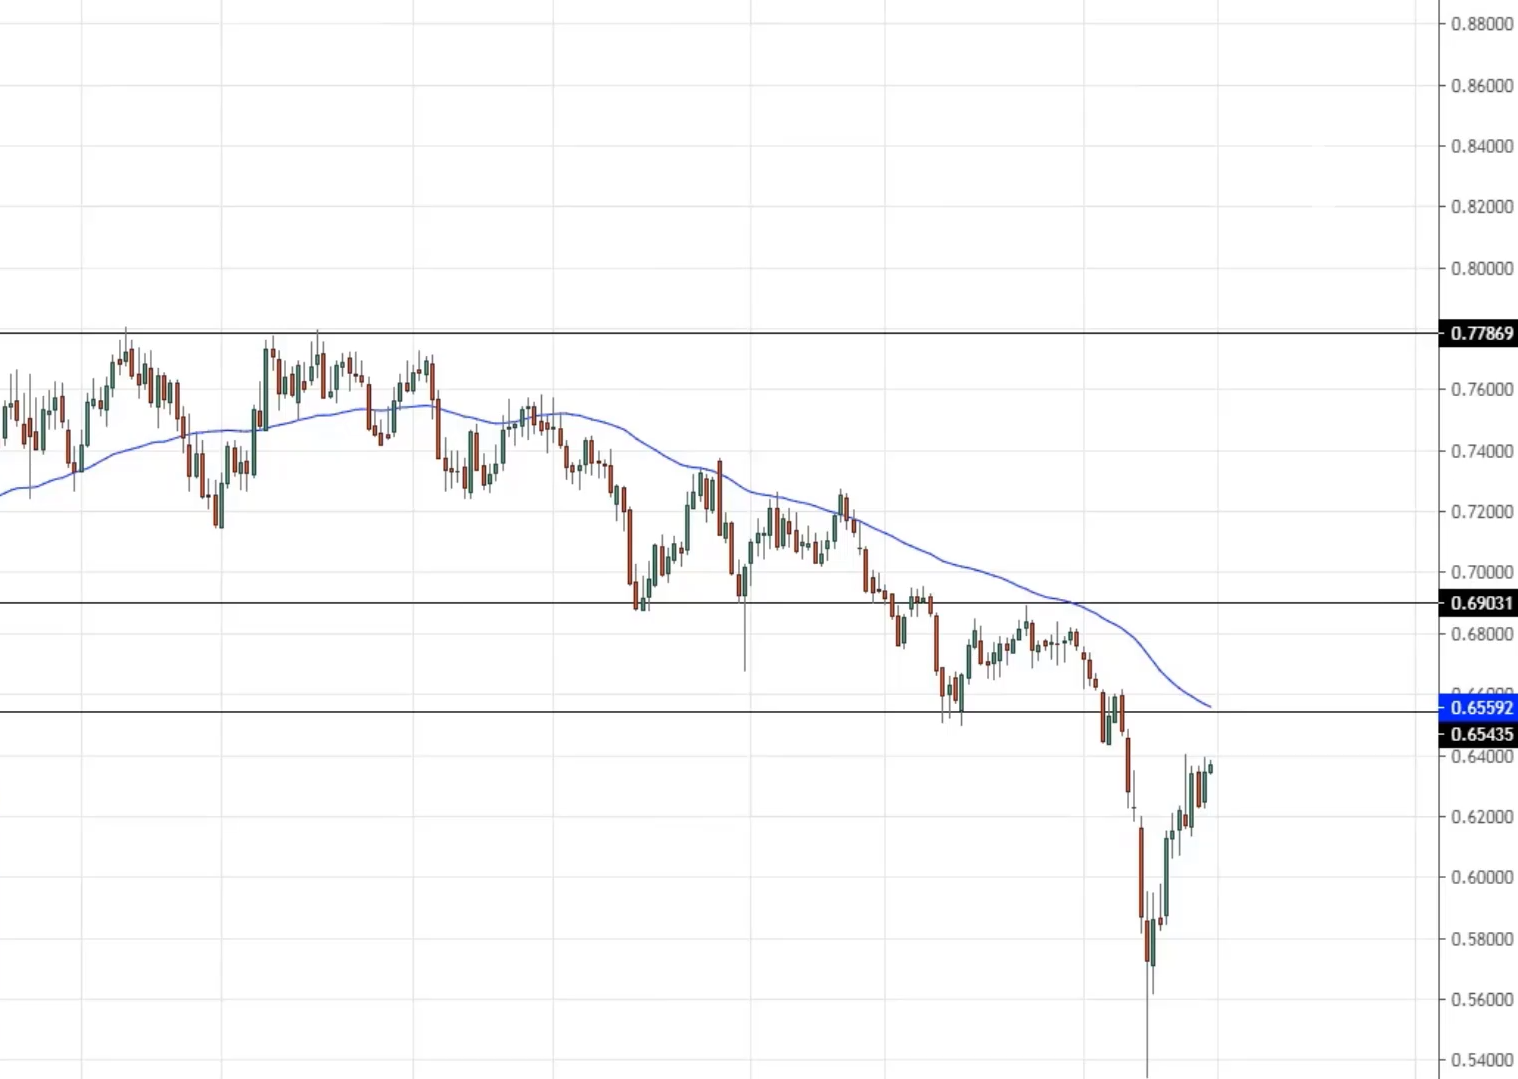
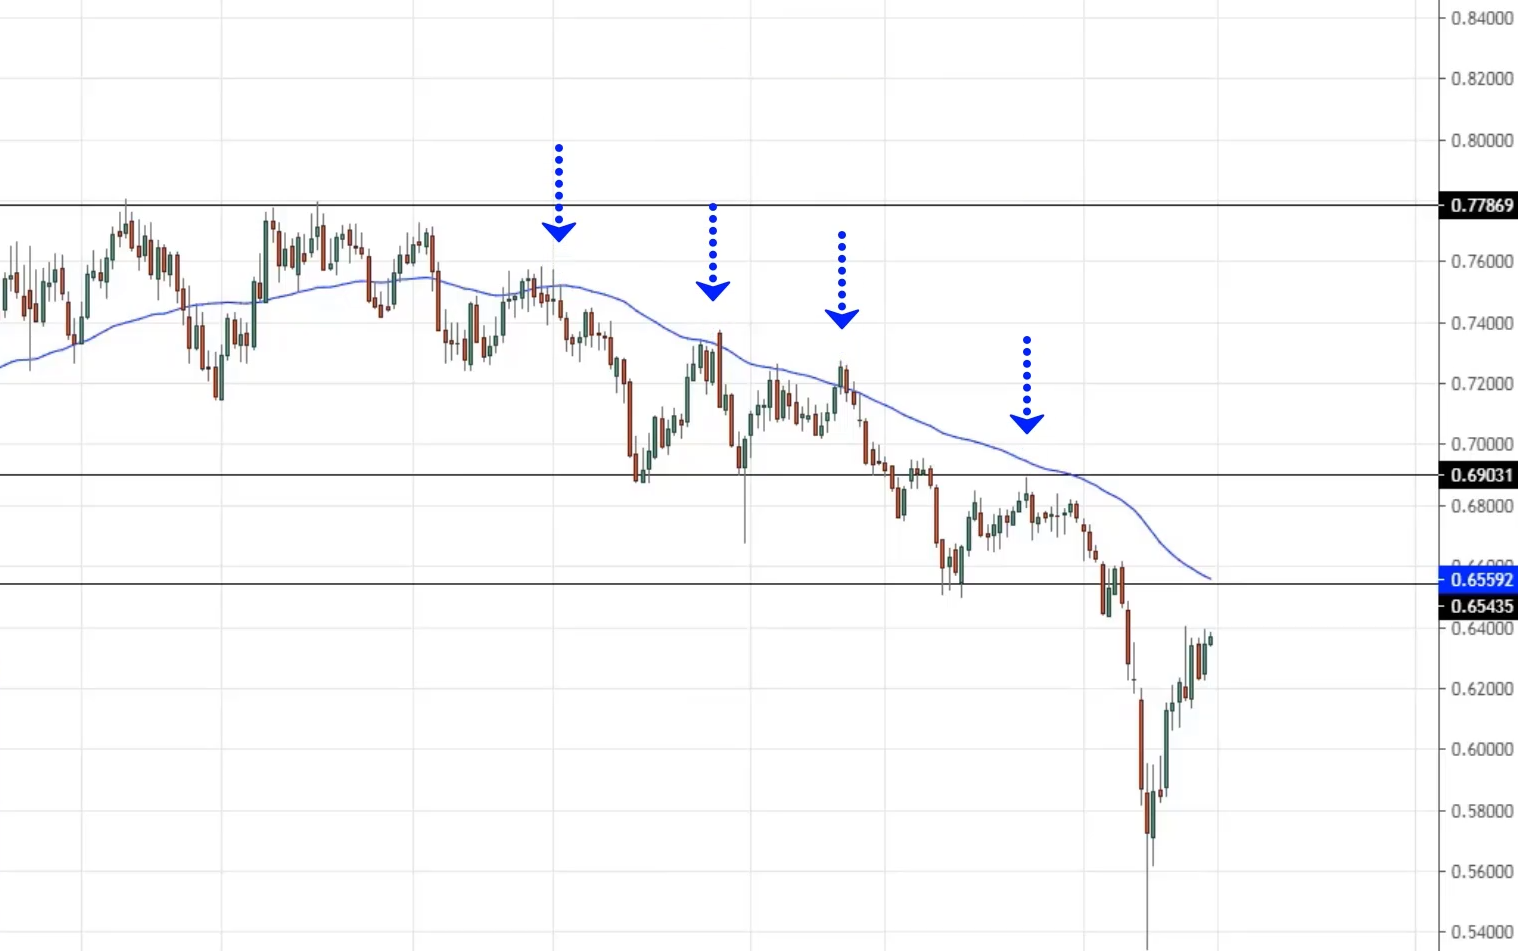
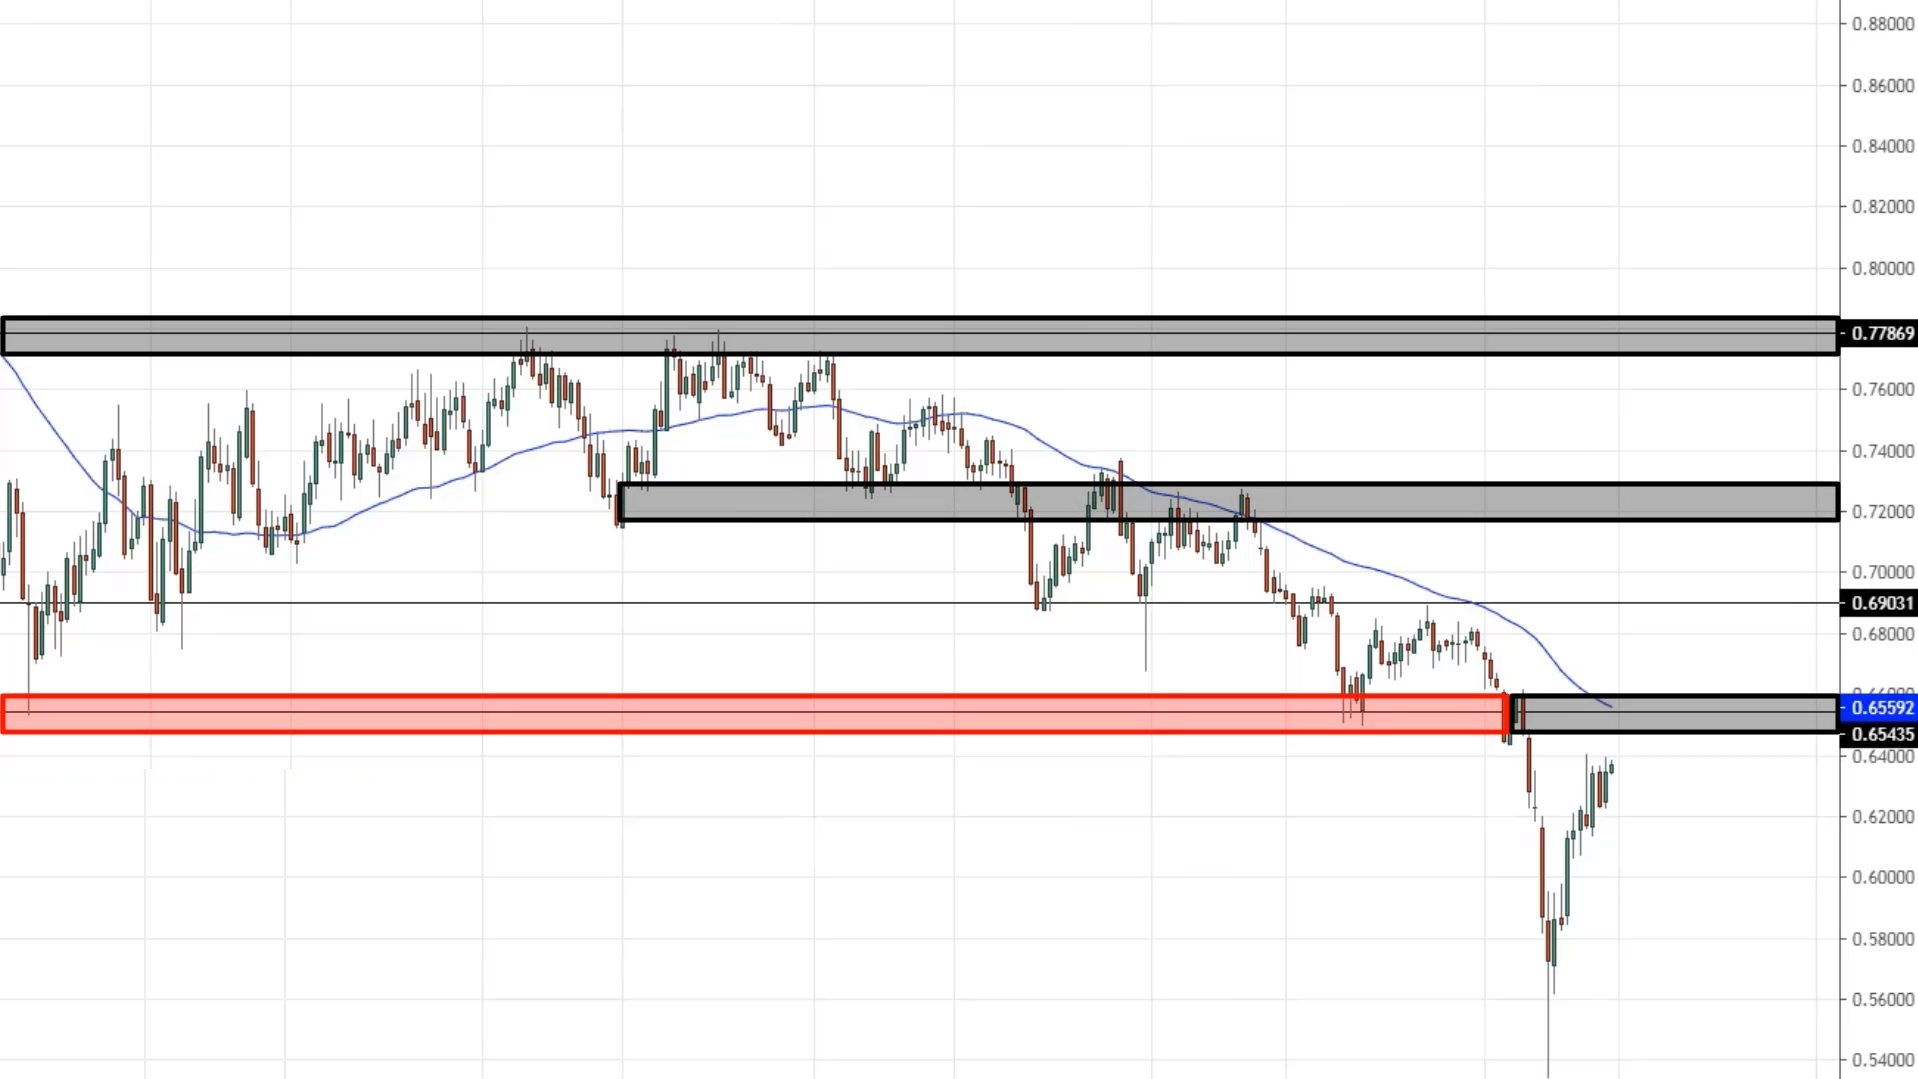
Example on AUDCHF on the daily timeframe…
In this case, you have multiple areas of value using the 50-week moving average again.
Testing almost four times.
Then you have your classical support resistance where you can draw a line where the previous support goes against the resistance.
In this case, you have multiple areas of value on this chart. You might even draw a downward trendline as well.
Entry Trigger
This is what will get you into a trade. This is what will inform you it’s time to buy…
You are looking for an entry trigger. An entry trigger could come in numerous forms, it could be a simple price rejection like a bullish engulfing pattern, shooting star, hammer, or a break of structure on a lower timeframe or trend line break.
Most people even use indicators, like crossing from oversold to overbought as an entry trigger that's fine as well.
In this case, let me just walk you through a few entry triggers that you can use in your trading.
False break or price rejection
Example on EURNZD 8-hour timeframe…
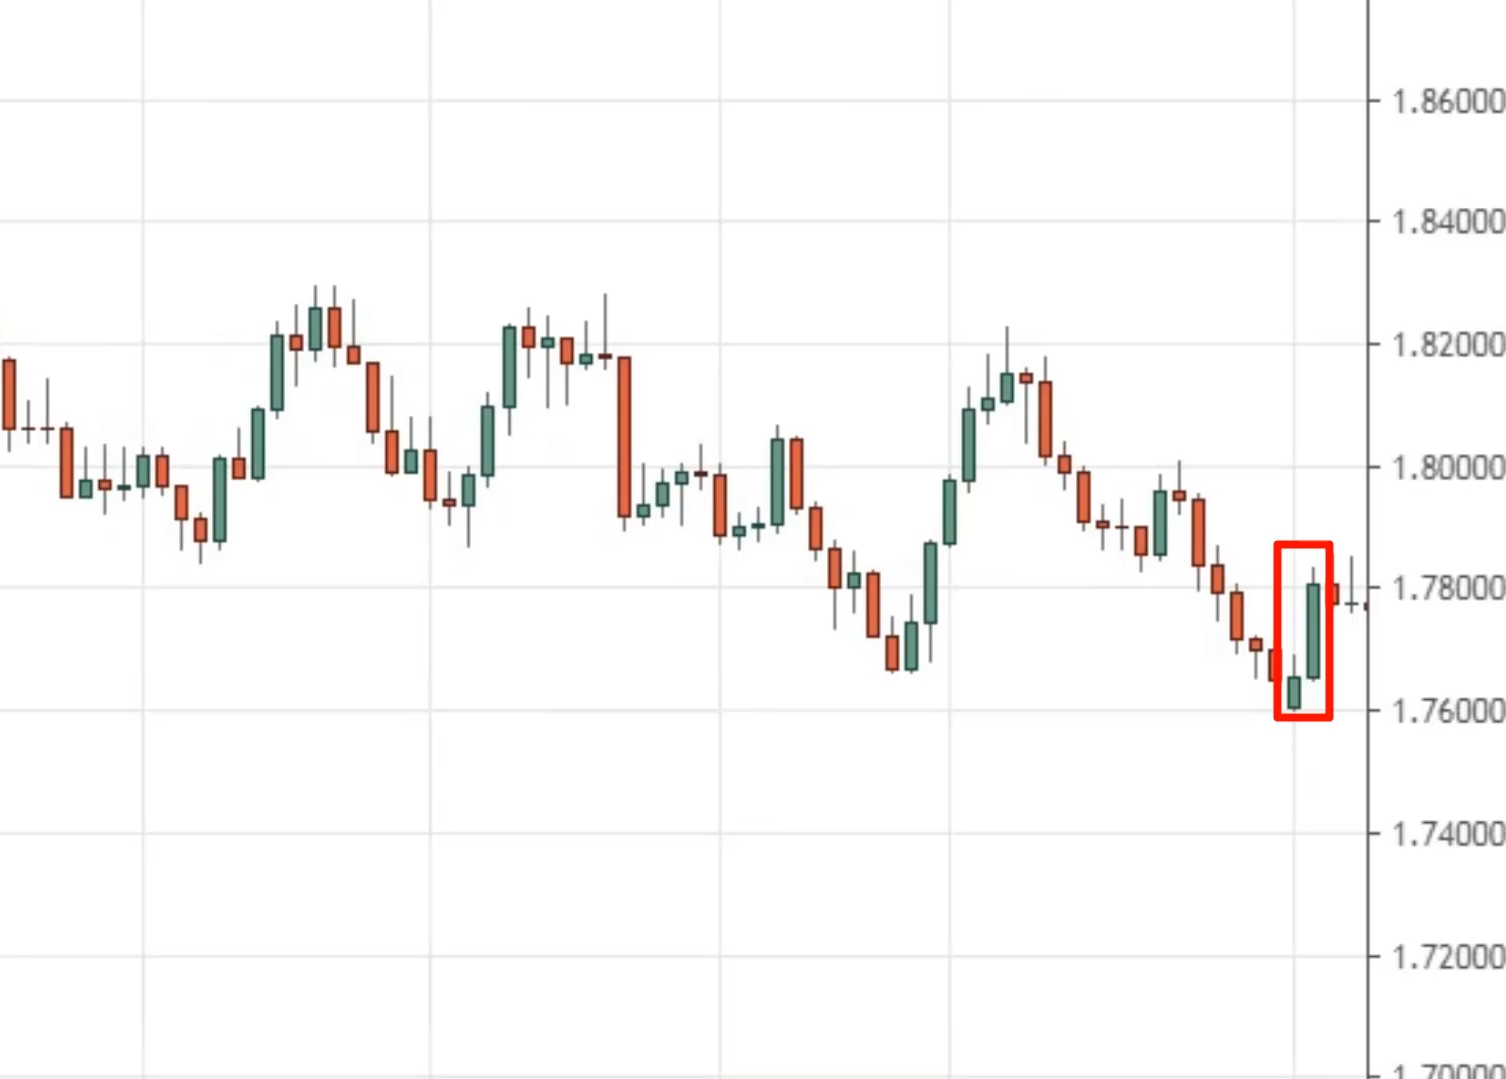
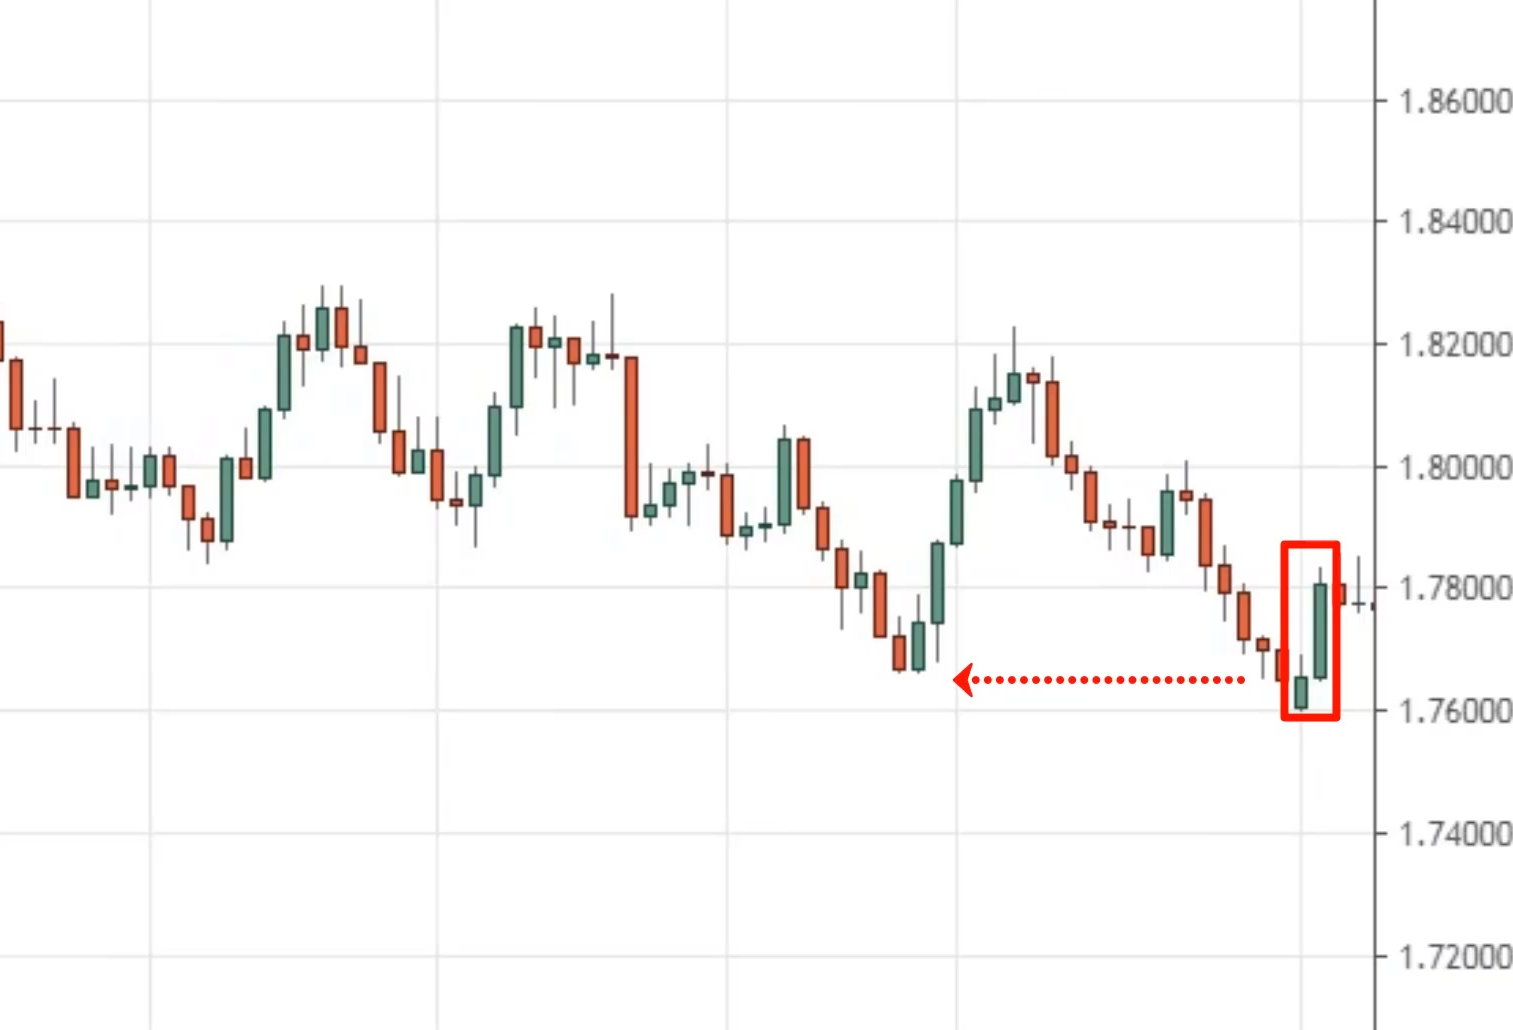
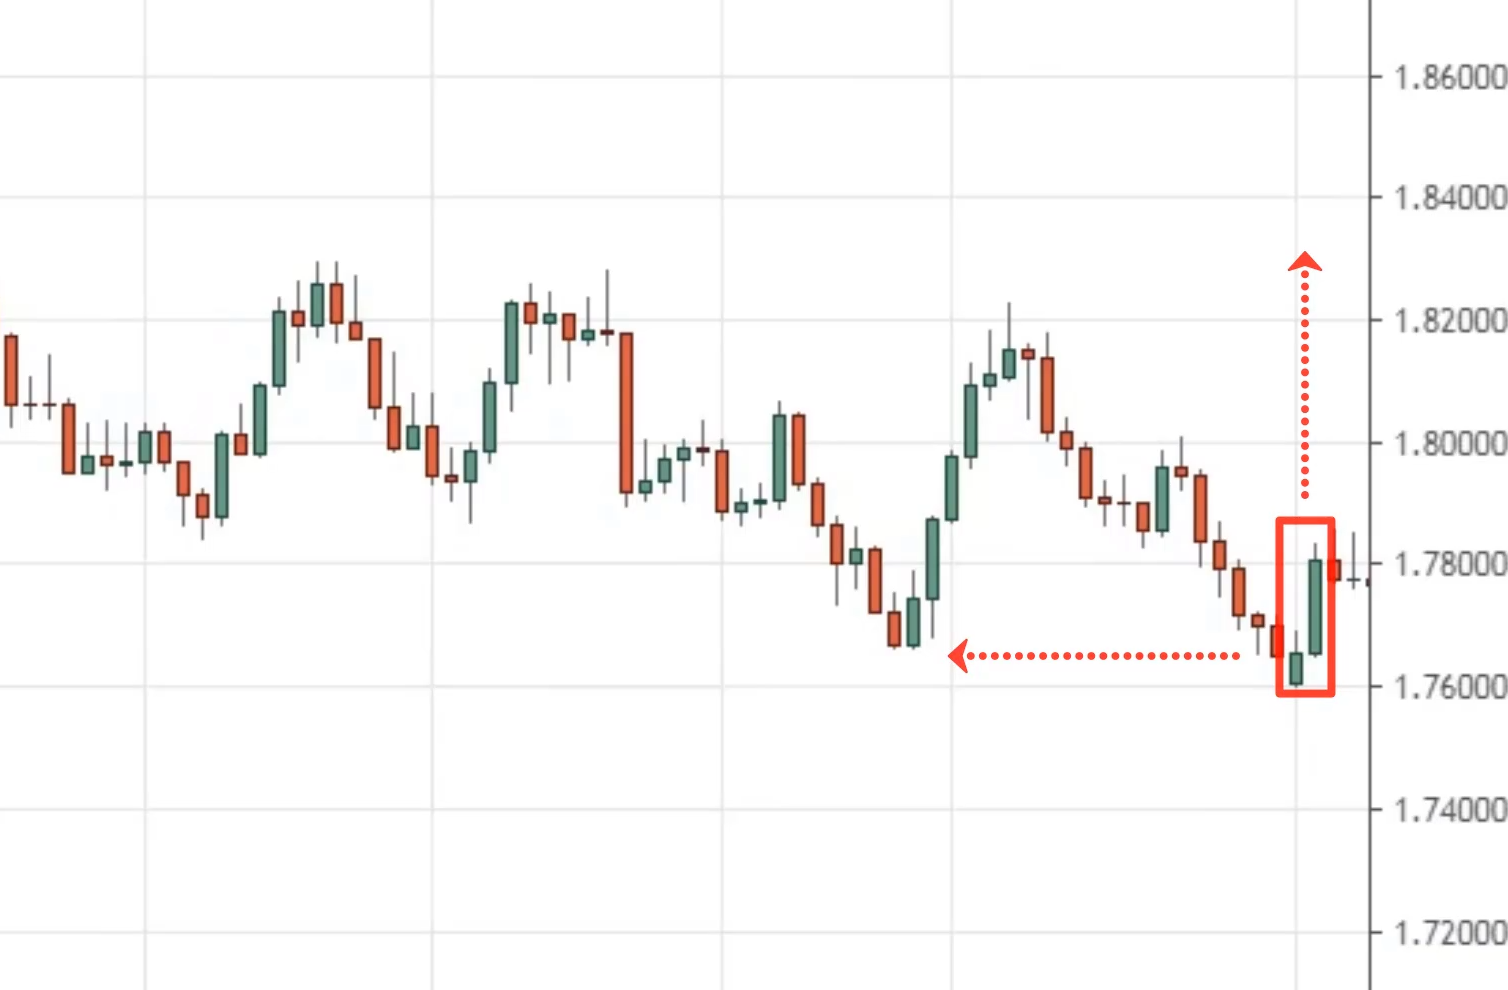
in this case, this is what I call a price rejection or a false break at this point, these two candles here.
You can see that these two candles took out the lows over here.
And the price reverses up higher bullishly above this area of support back above the swing low. This is what I call a bullish price rejection or a false break where price broke down below the swing low and then reverse strongly in the opposite direction.
This is one example of an entry trigger.
Break of structure
Example on the S&P 500 Daily Timeframe…
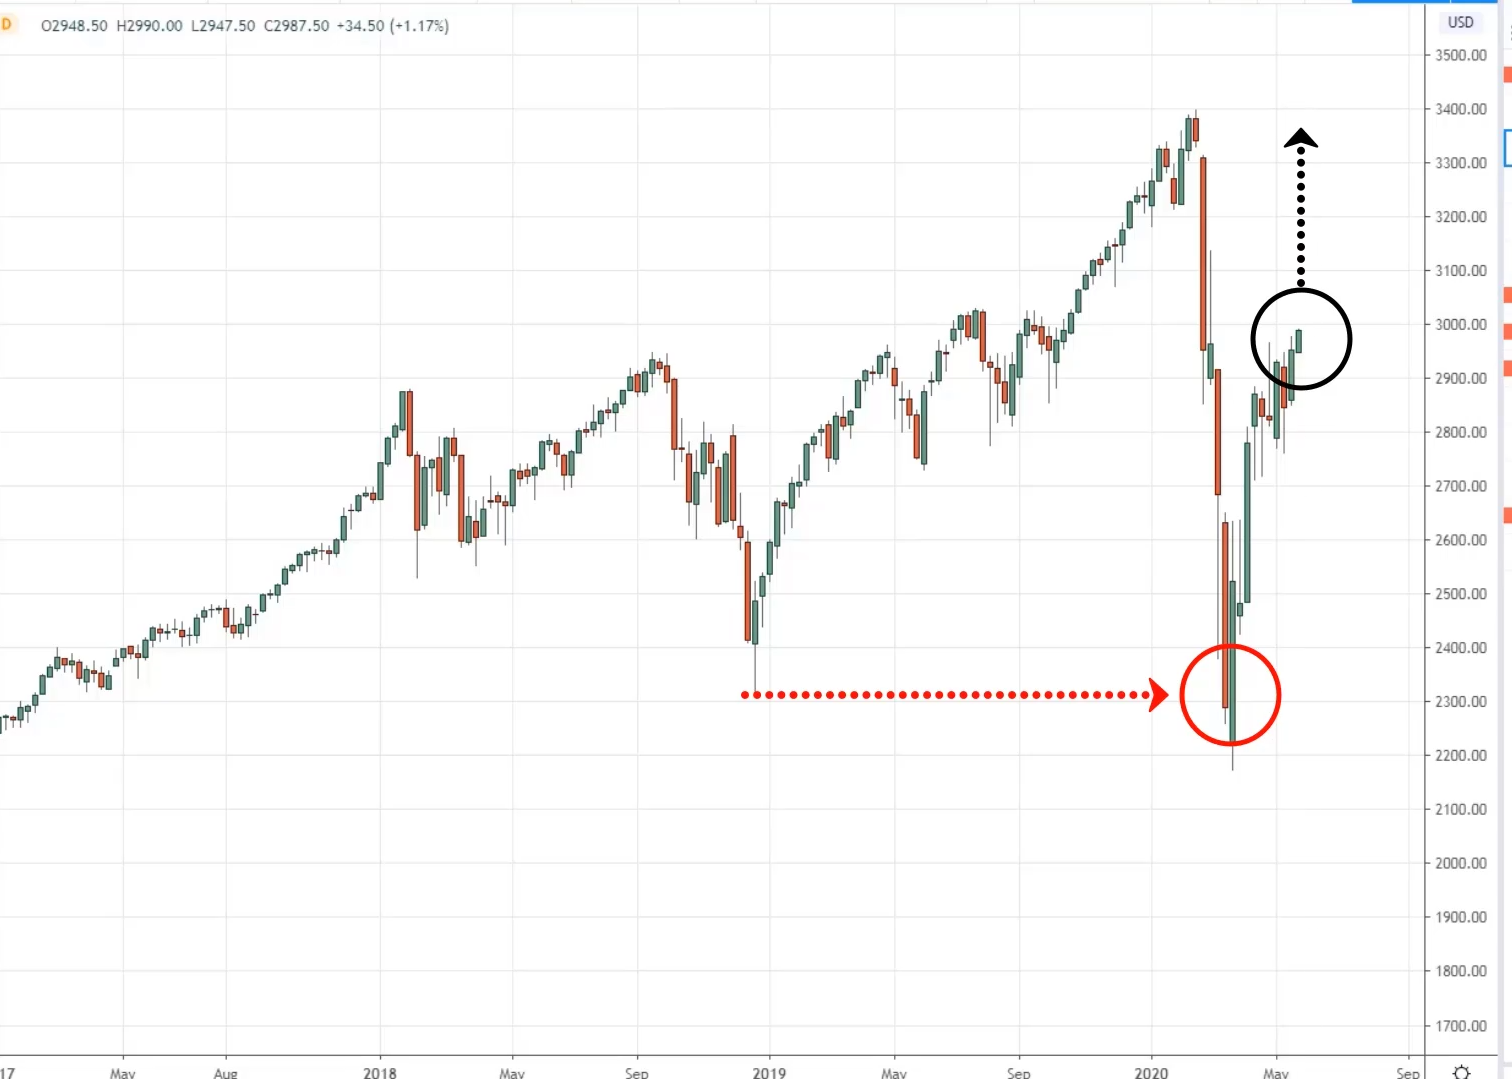
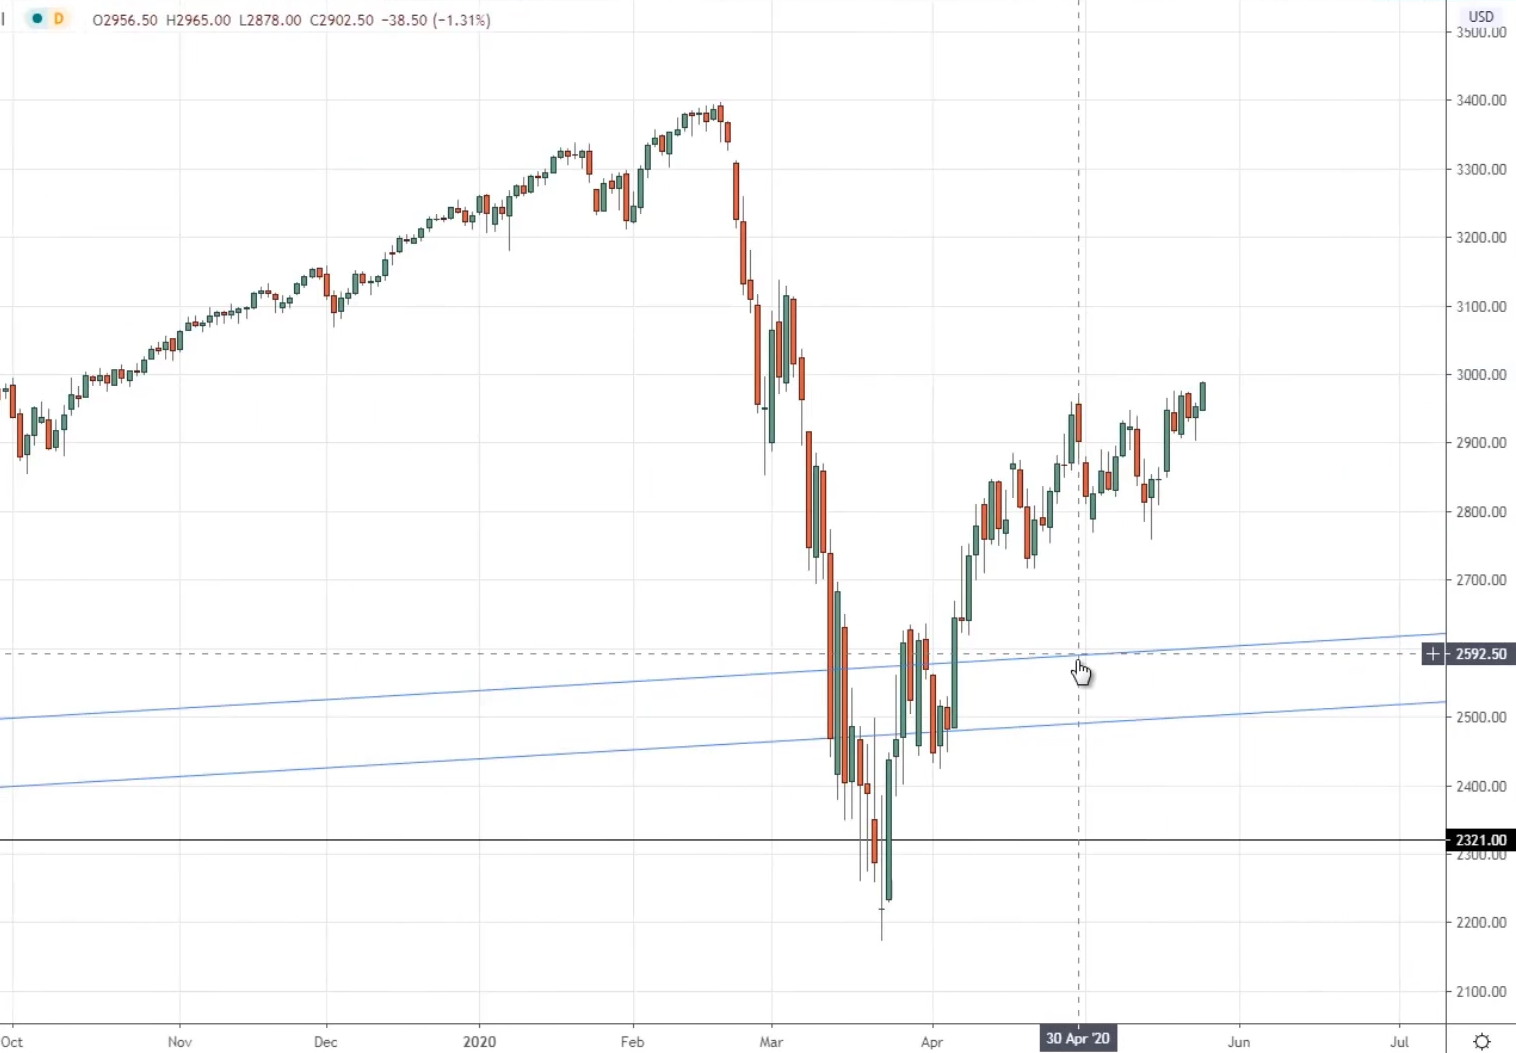
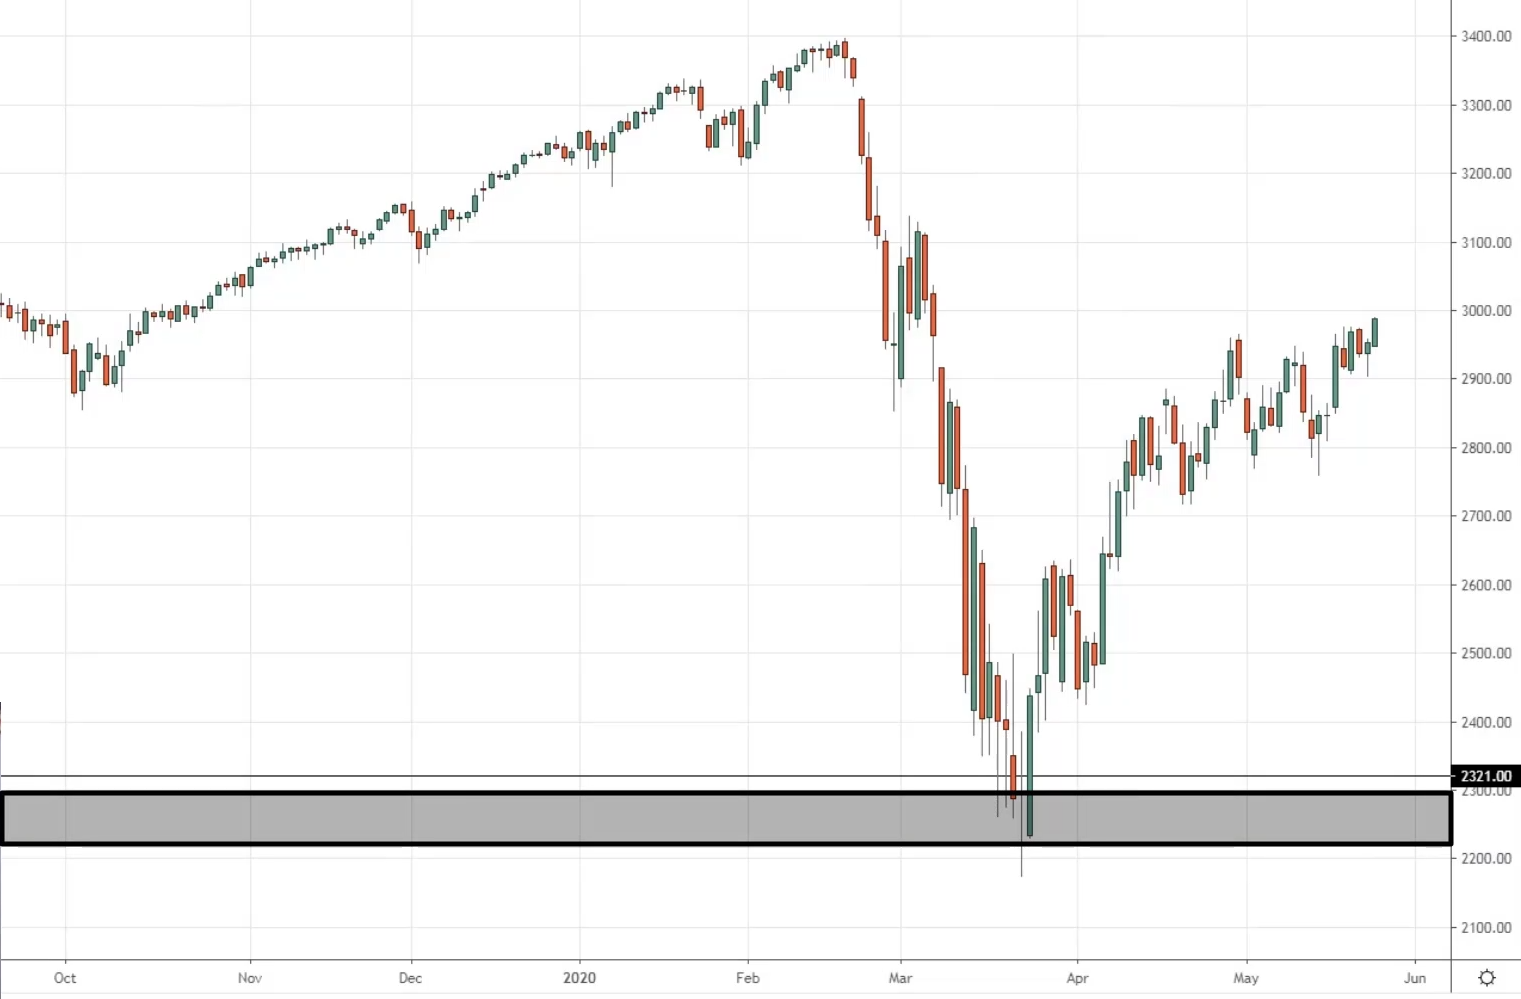
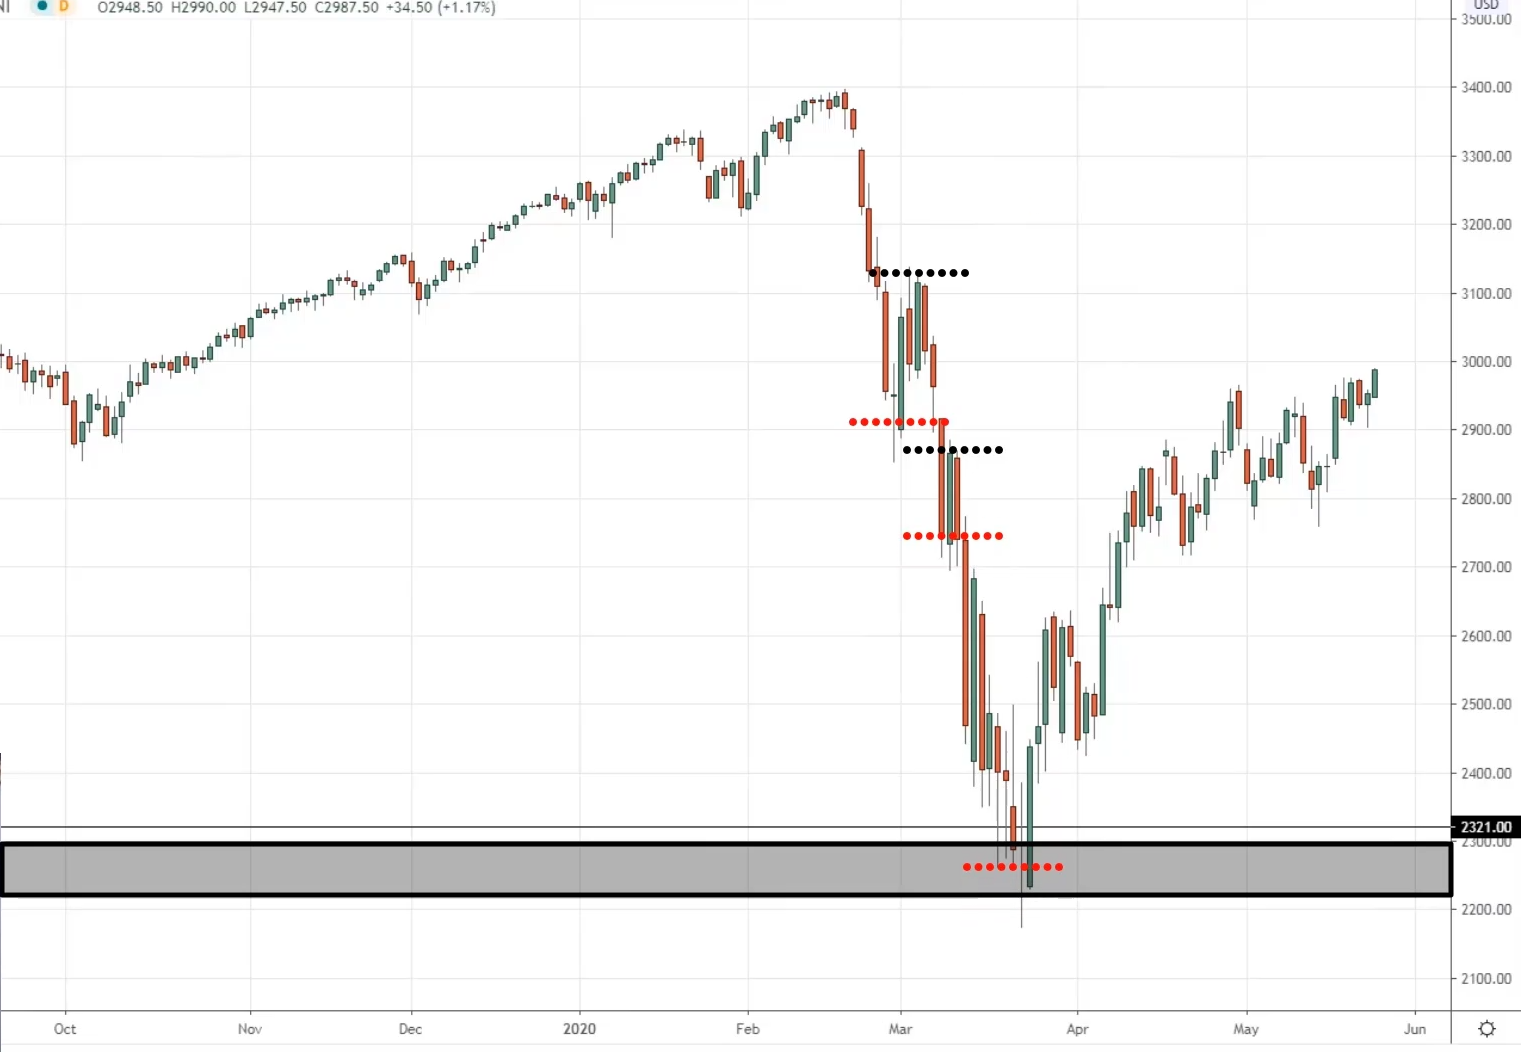
At this point, you've seen earlier that the S&P 500, It found an area of support over here around the 2321 area.
Before in reverse, what you had seen is that the price action made a series of lower highs and lower lows.
At this point, you can see clearly that the sellers are in control. They're just pushing the price making a series of lower highs and lower lows.
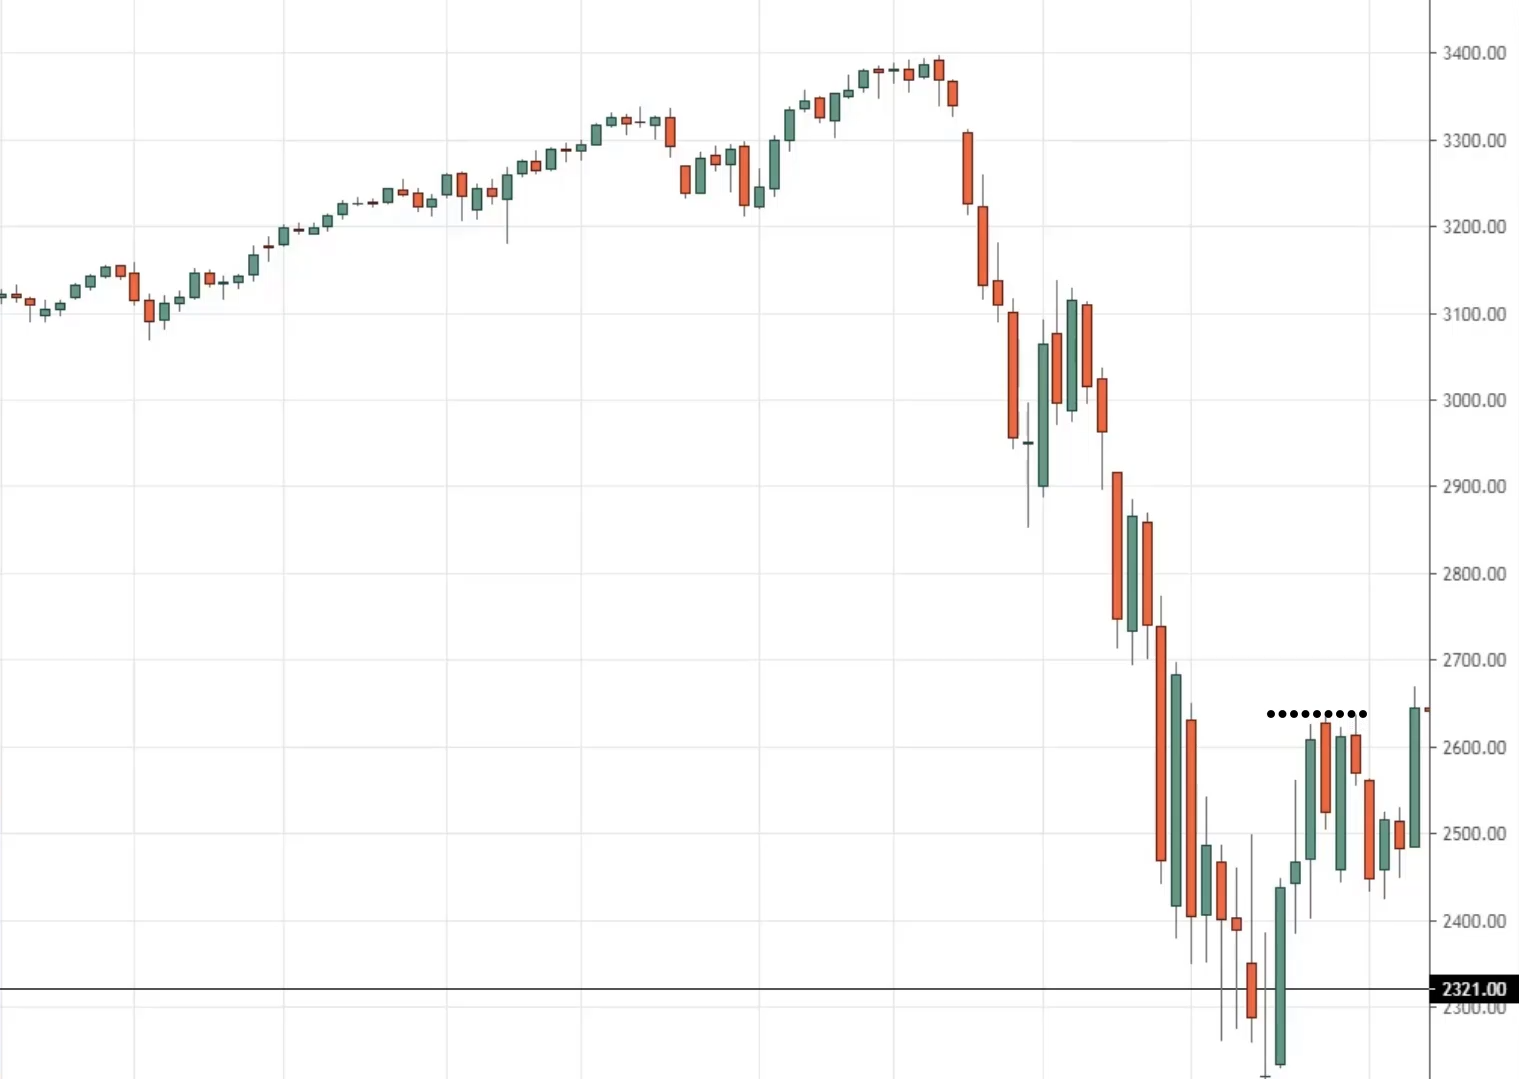
A break of structure simply means that the price has invalidated the existing market structure.
This market structure is making a series of lower highs and lower lows and to break it the prices need to make a series of higher highs and higher lows and this is what happened.
This is what I call a break of structure.
Trendline break
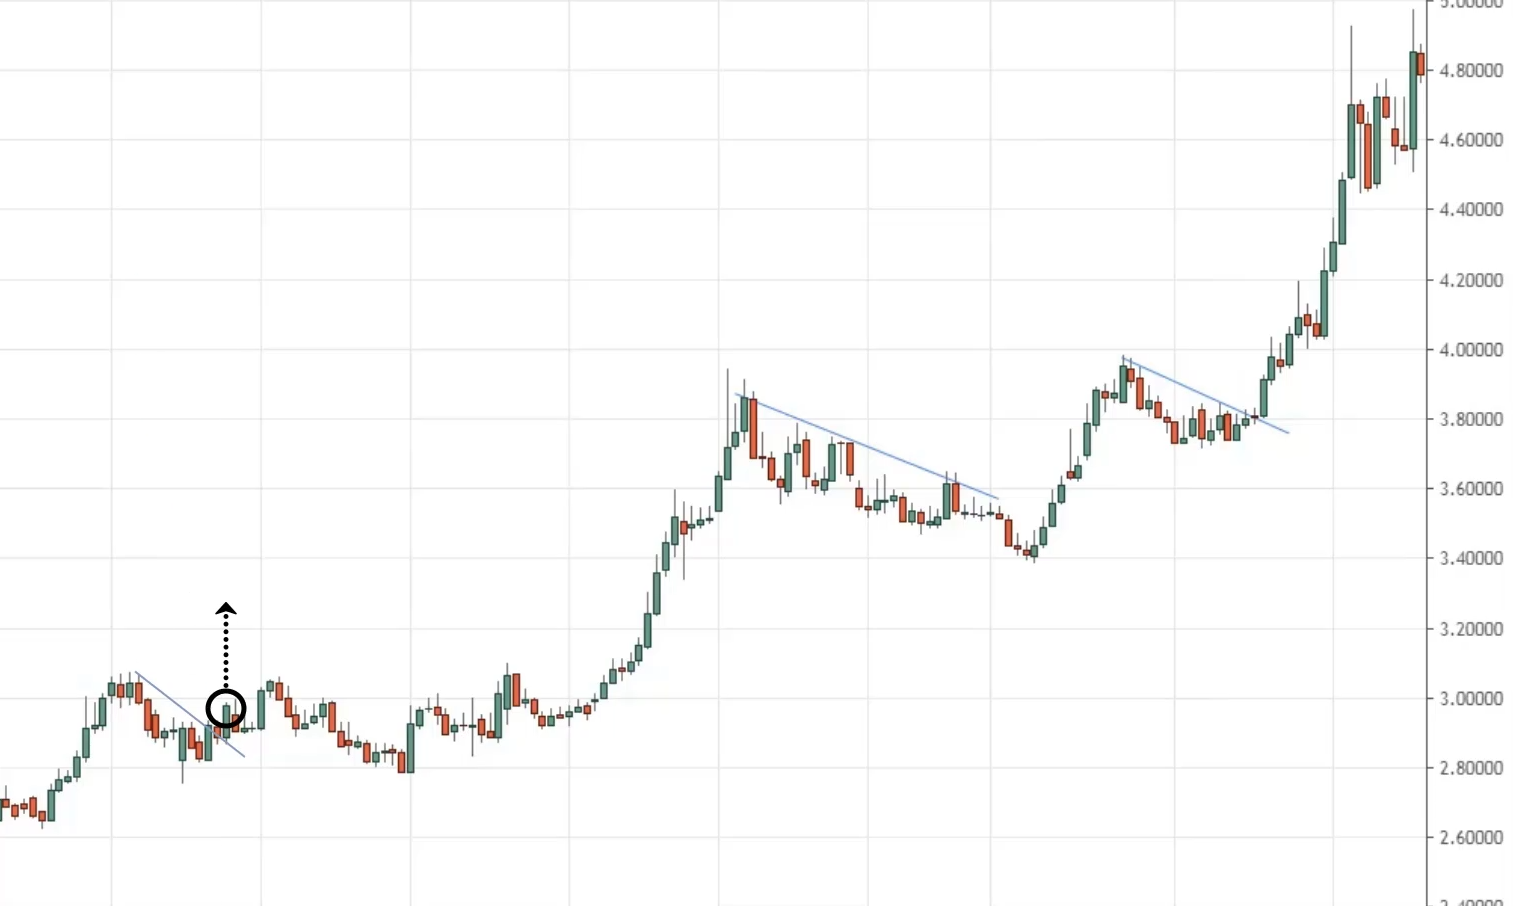
Let's say the market is in an uptrend and you are thinking where should I buy the pullback?
How do I time my entry on a pullback?
We can use a technique called the trend line break. You can draw the trendline from the highs to the low.
When a price breaks out of the trend line, you can look for buy opportunities to get long.
This trendline in hindsight looks easy to trade.
Pro Tip
Sometimes when you trade a trend line break. Don't to be too early because in this case.
If I have another trendline and you trade a trend line break. This might be either a losing trade or breakeven trade.
One thing that I have for us again, let the price come to an area of value first.
Then you trade the trend line break.
This means right before you apply the trend line break technique, you want to make sure that the price is at an area of value right before you use this entry trigger.
That's just one tip for you.
Exit
The fourth thing you have to look out for is the exit. This means where do you put your stop loss on your trade?
At what level would the market prove you wrong?
At what level will your trading setup get invalidated?
Let me just give you a very simple explanation.
You know what it is right? It looks like just three triangles.
Let's say the market breaks down below this neckline, and you go short.
Let me ask you, at which point on this chart, will this head and shoulders pattern look distorted?
The answer is above the highs.
Does this still look like a head and shoulders pattern?
No.
It looks like some mountains or whatever.
This is where I’m coming from. You want to place your stop loss at a level where it invalidates your trading setup.
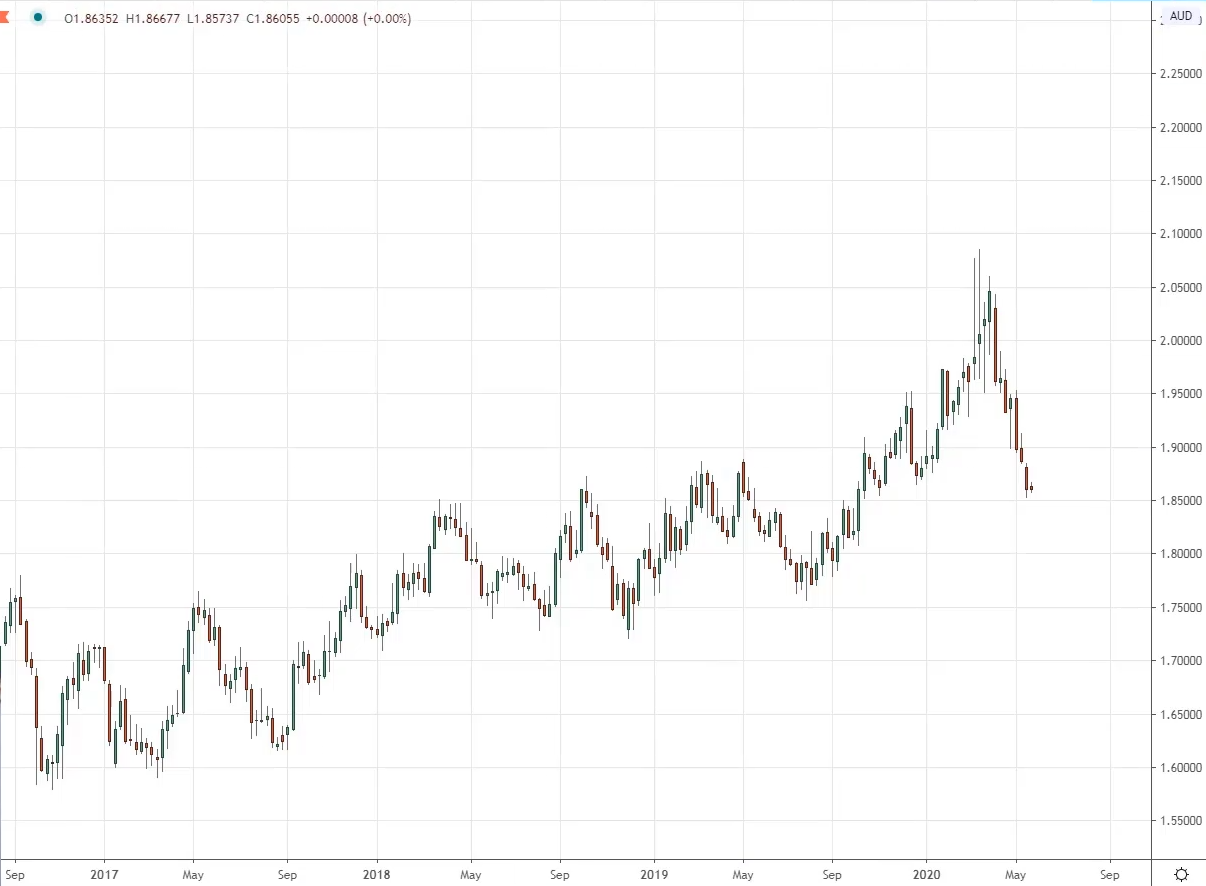
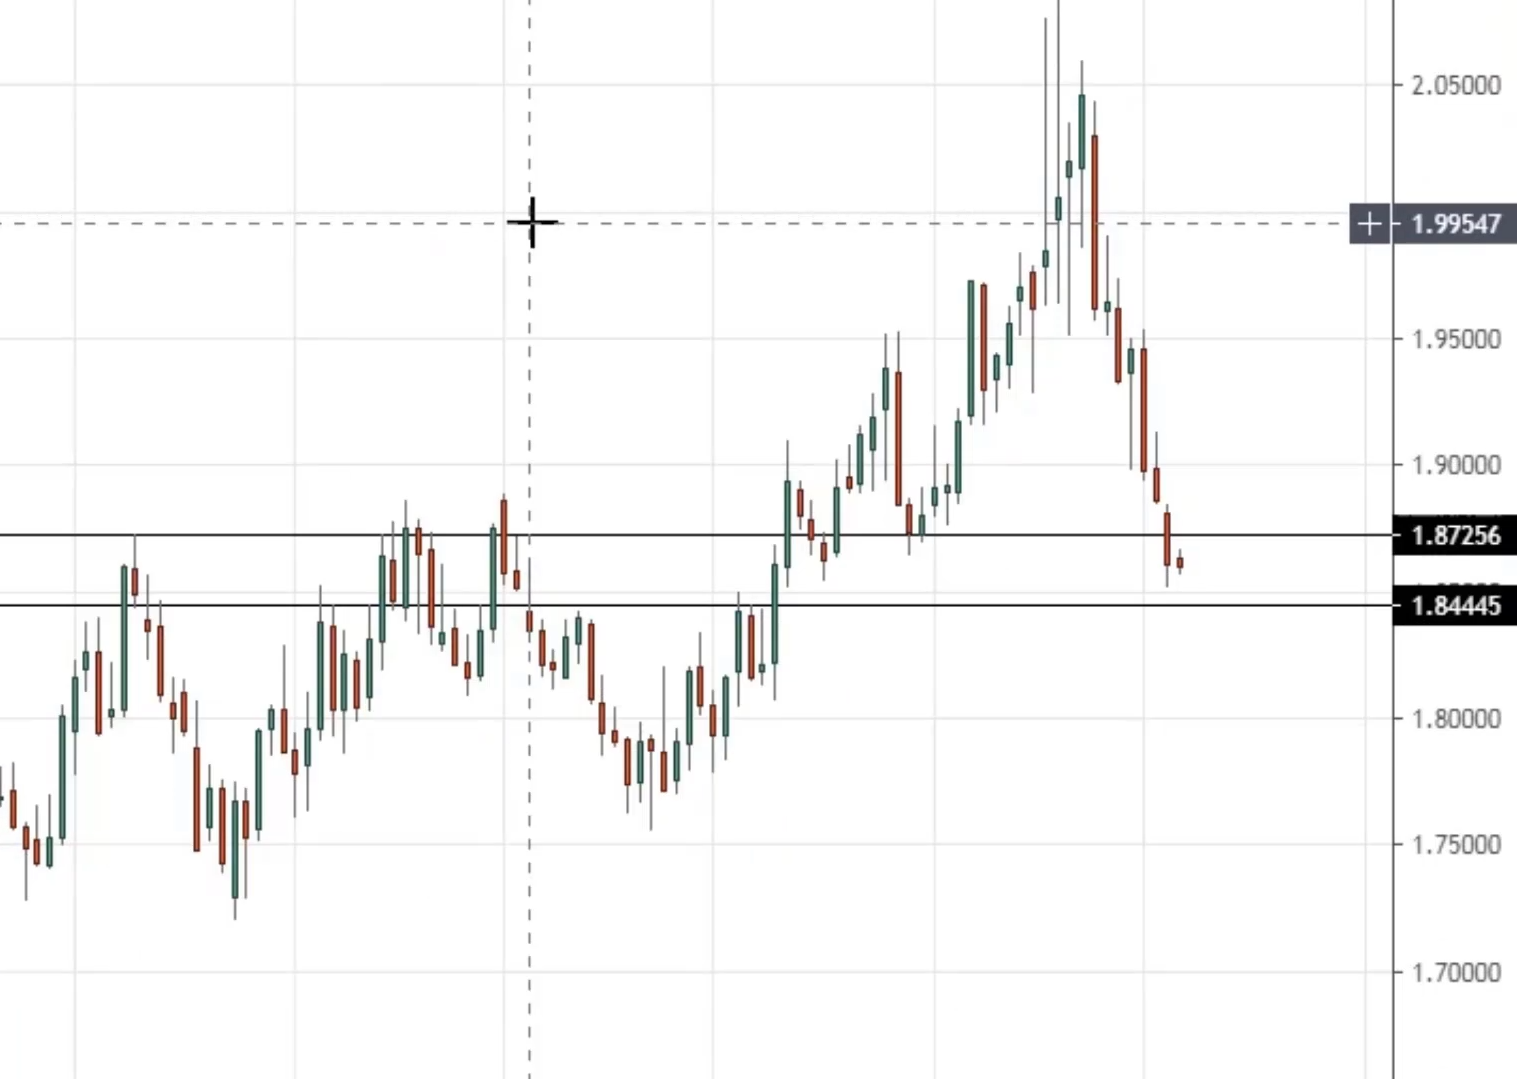
Example on GBP/AUD Weekly Timeframe…
This is something that you will be using on every trade.
Where is the area of value?
I would say its possibly here.
Let's say the market now is at this area of value and you are long maybe there's a bullish reversal pattern like a hammer and you go long.
Let me ask you.
At this point, which price point on the chart will this setup be invalidated with this area of value being broken?
At which point on the chart will the previous resistance that act as support be destroyed?
I'm sure you can agree with me that if the price were to reach around this, 180 level.
And this area of value, this area of support is invalidated because the price has breached through it and has broken below it.
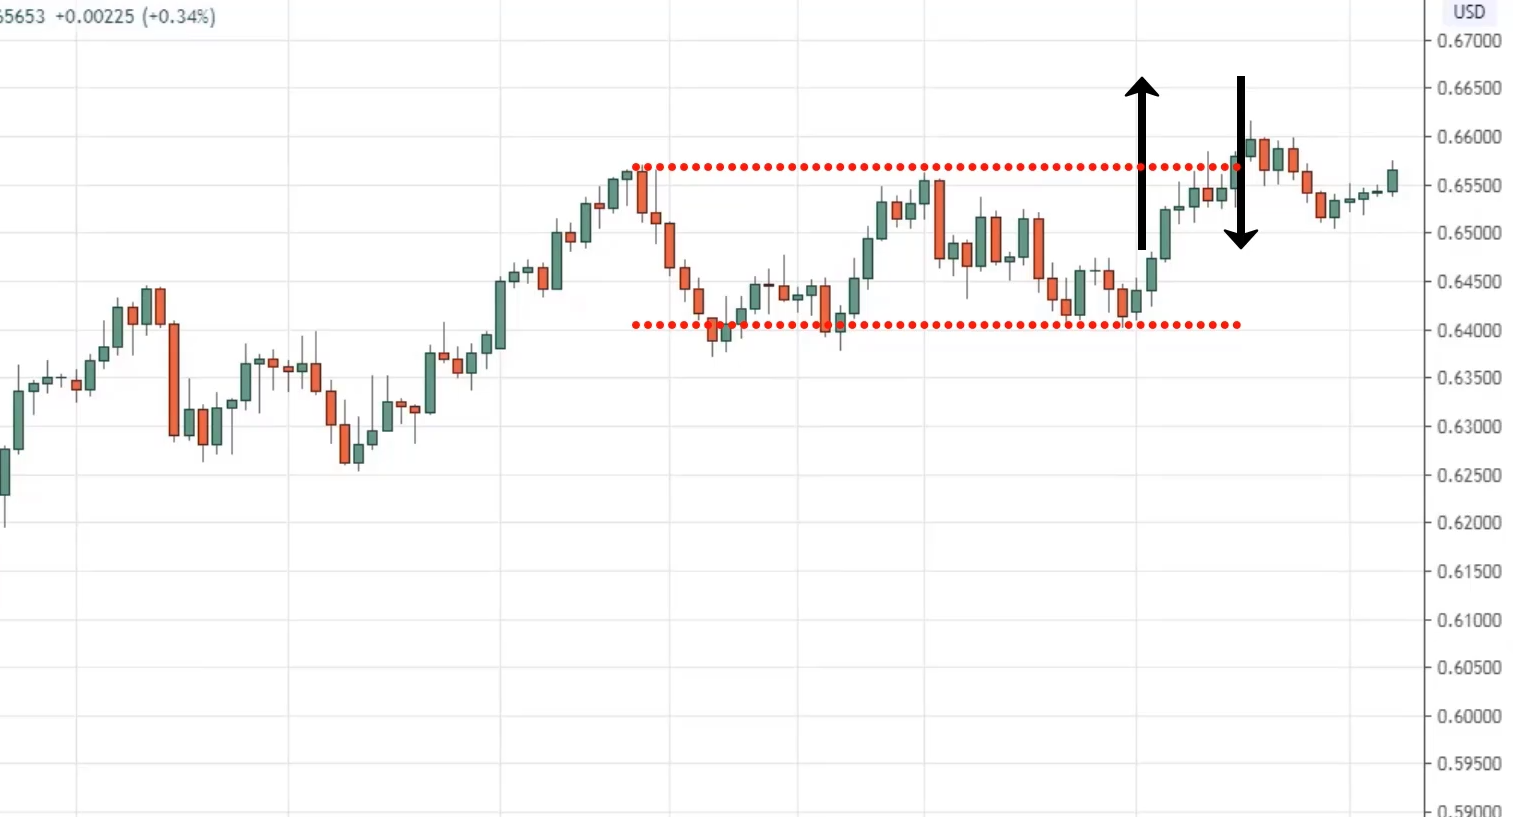
Example on the AUDUSD 8-hour timeframe…
At this point, you can see that you have a series of higher highs and higher lows.
Let's say you bought the breakout of these highs.
Let me ask you which price point on the chart would you know that your breakout has failed?
If you ask me there are two possible levels.
Levels to consider when placing your stops when you are wrong
You can reference these lows over here.
At this point, if the price reaches this level when the price breaks out and comes back down.
This break out has failed.
Because it breaks out and reverse down lower.
That is a logical place to put your stop loss at a point where your breakout trade has been invalidated.
Another way you can put it for more aggressive traders is that if the price breaks out.
And comes back to the middle of the range, then the breakout has failed as well.
It doesn't mean that the trend is invalidated but it means that the breakout trading setup that you've traded is invalidated.
Because the breakout trade doesn’t look like how a breakout should be like.
If you imagine this, the price breaks out of these highs and it comes back down lower to the middle of the range.
It doesn't quite seem how a real legitimate breakout should be like.
Here are two possible levels to consider depending on how aggressive or conservative you want to be.
This is what I mean by placing your stops at a level where it invalidates your trading setup.
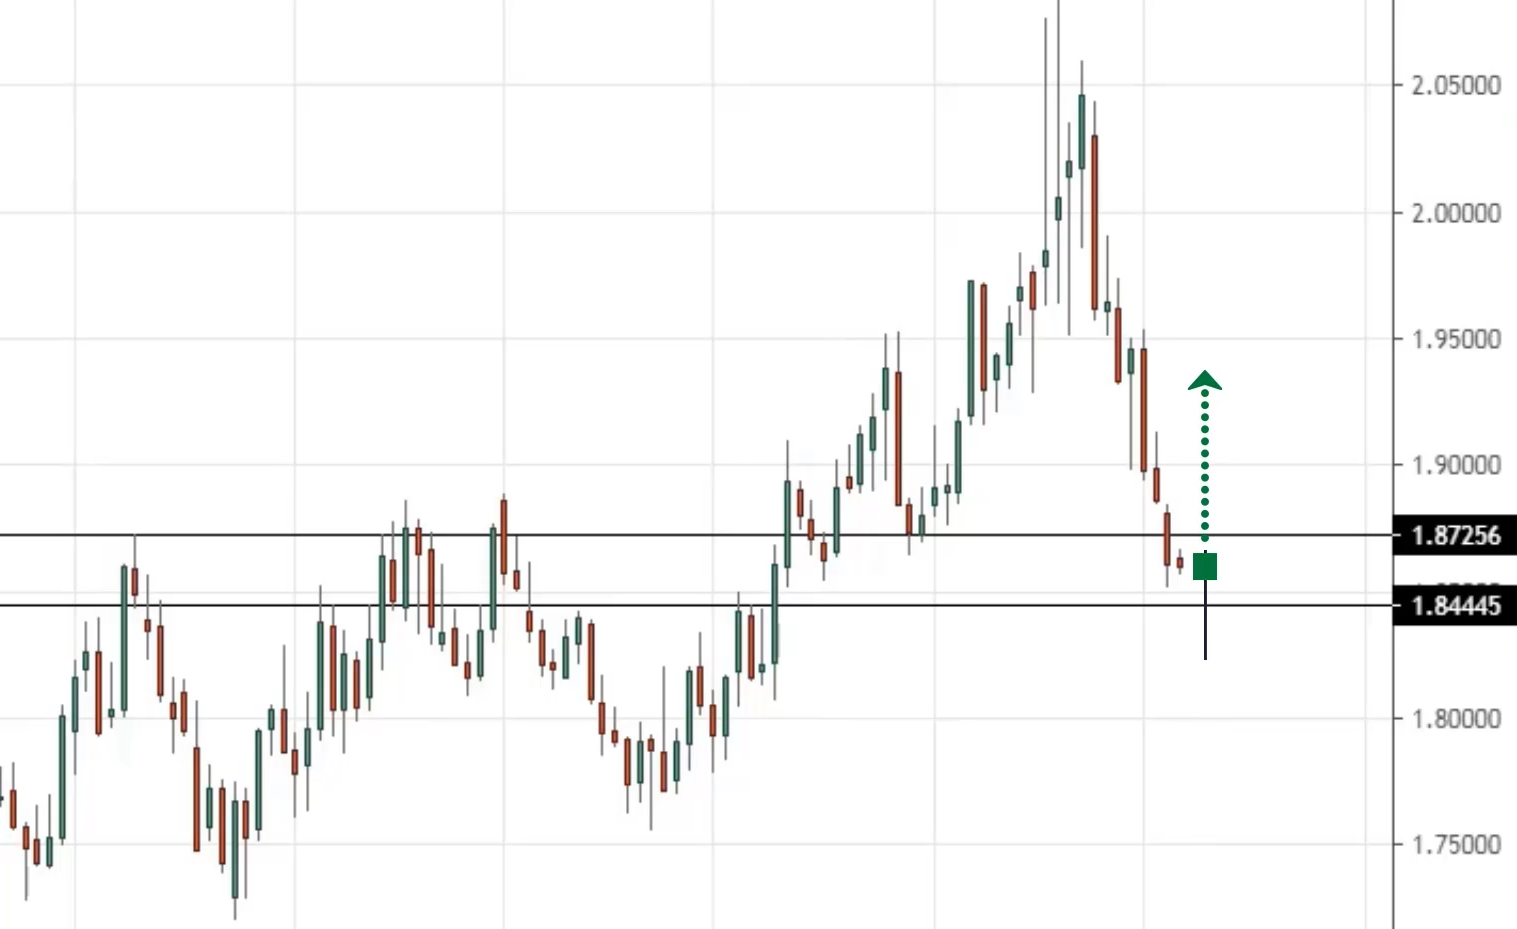
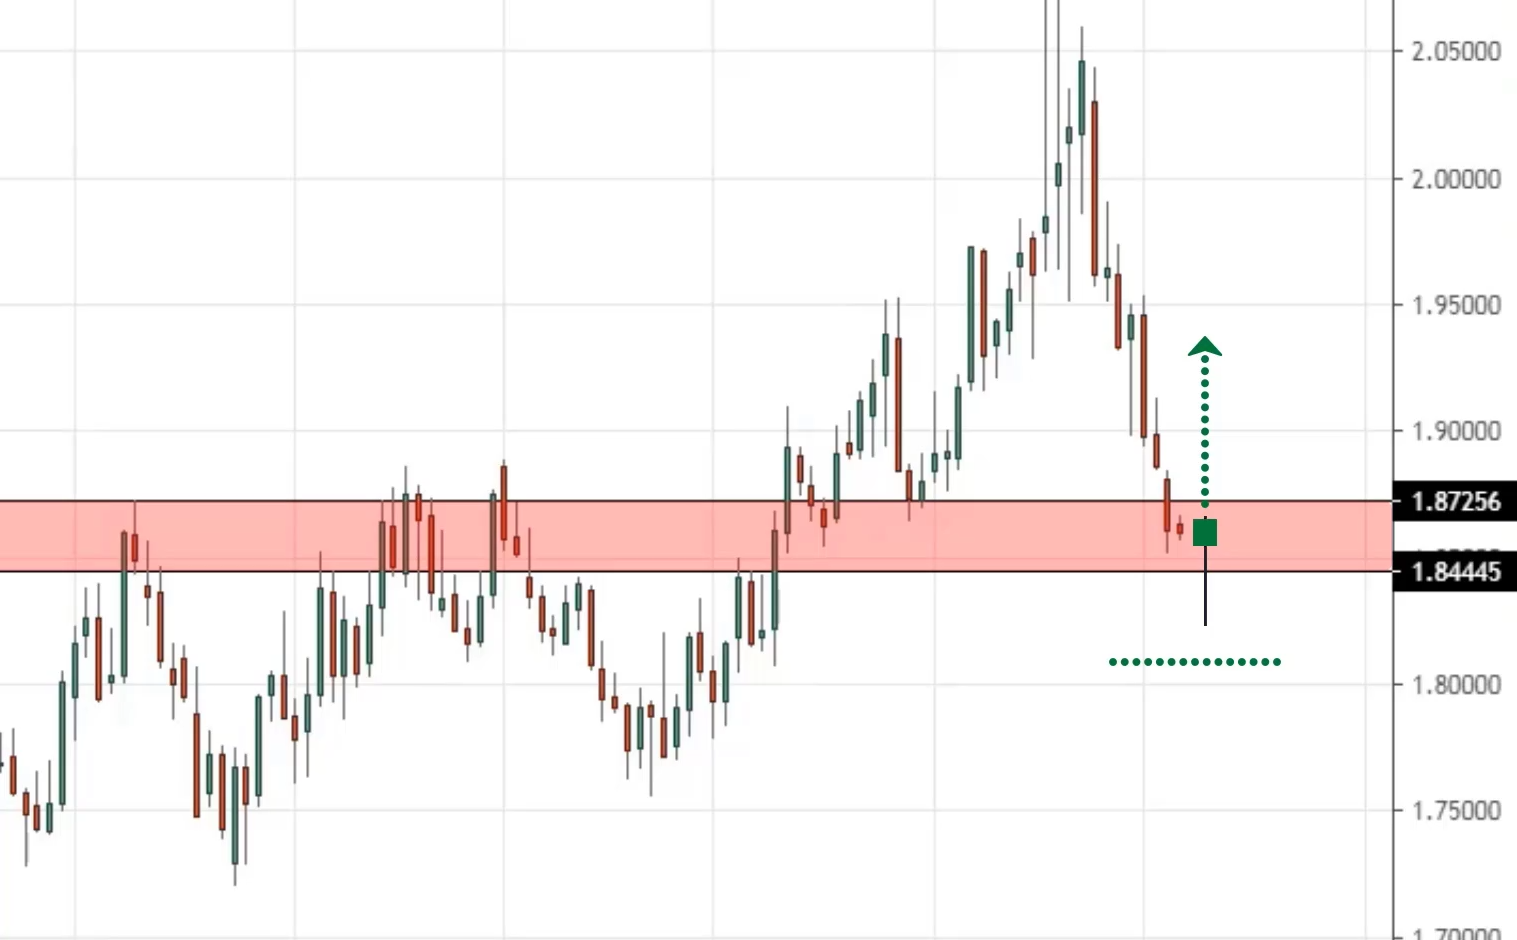
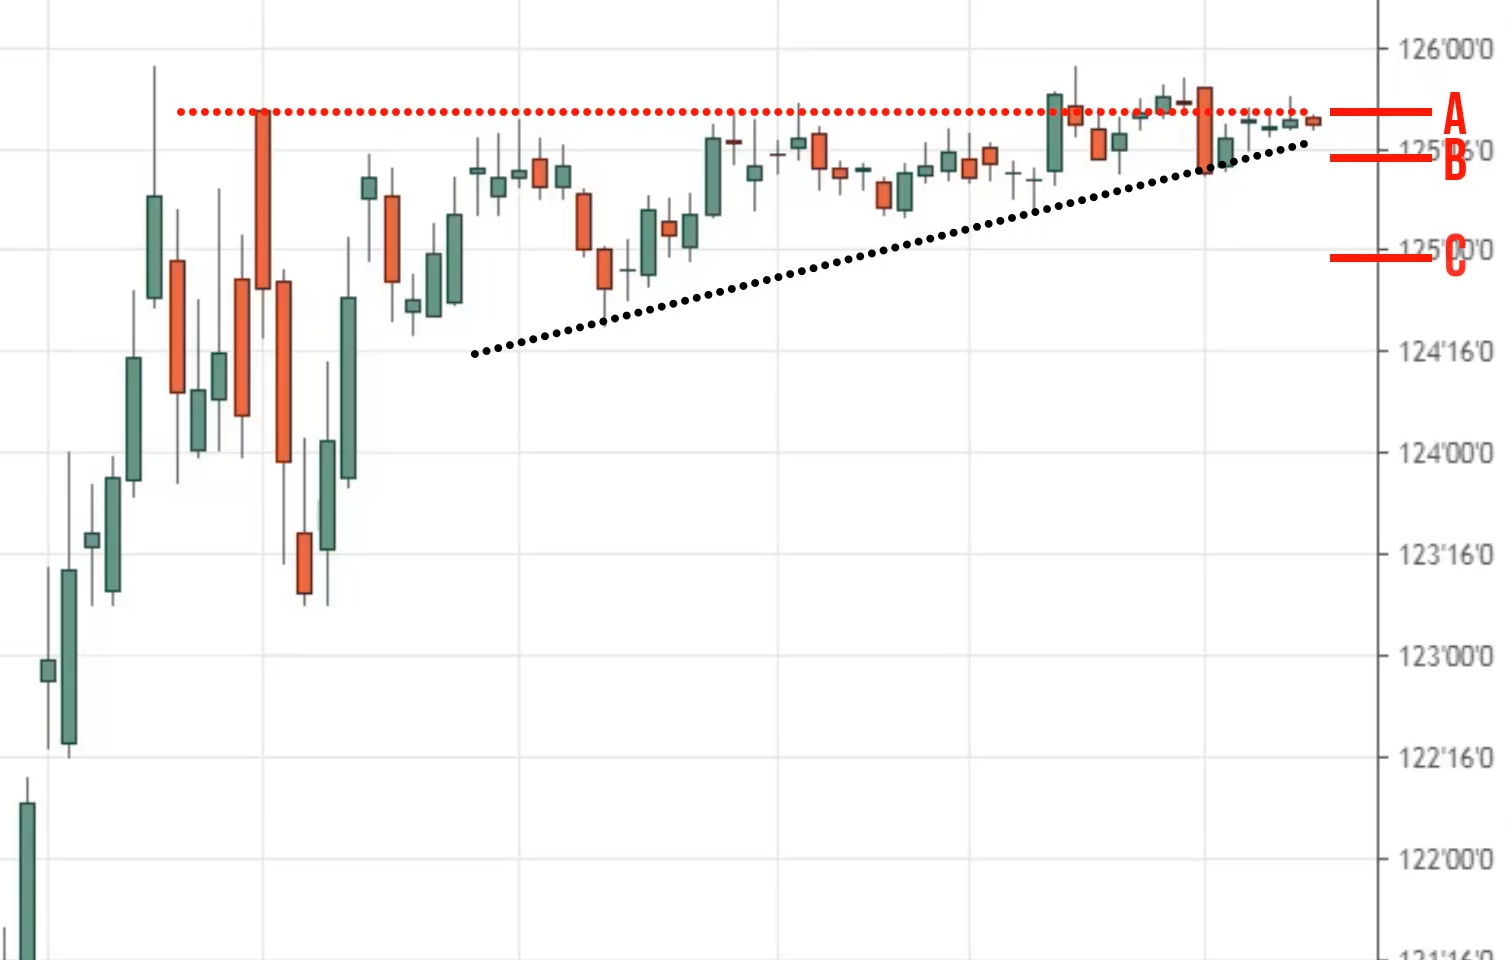
Example on 5-year T-note daily timeframe…
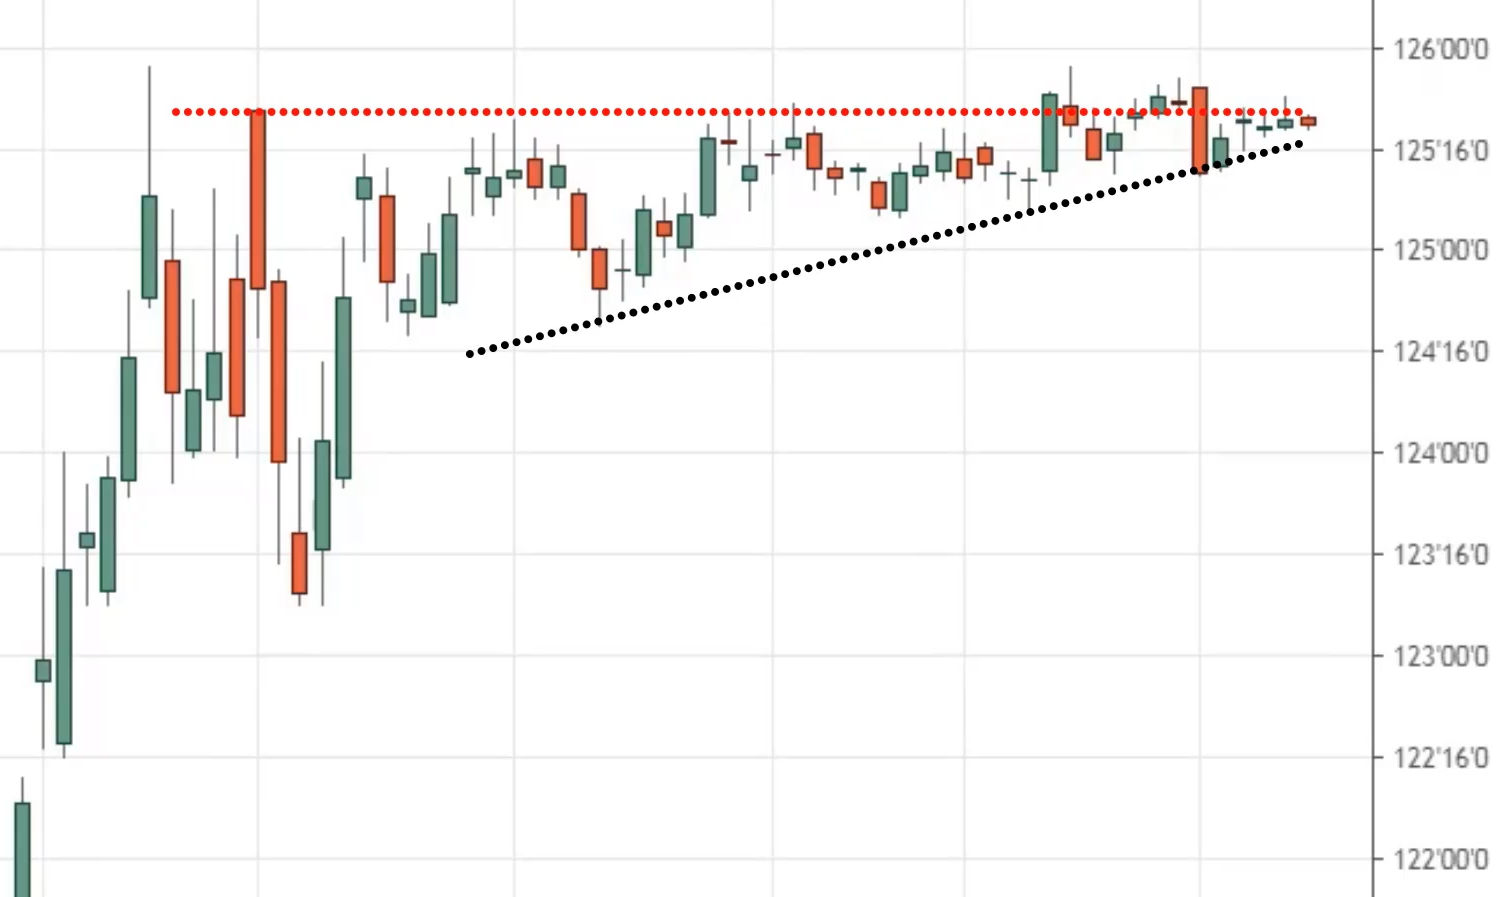
You can see the potential ascending triangle that’s being formed.
Let’s say the market breaks out of this ascending triangle.
At which point would the chart pattern be invalidated?
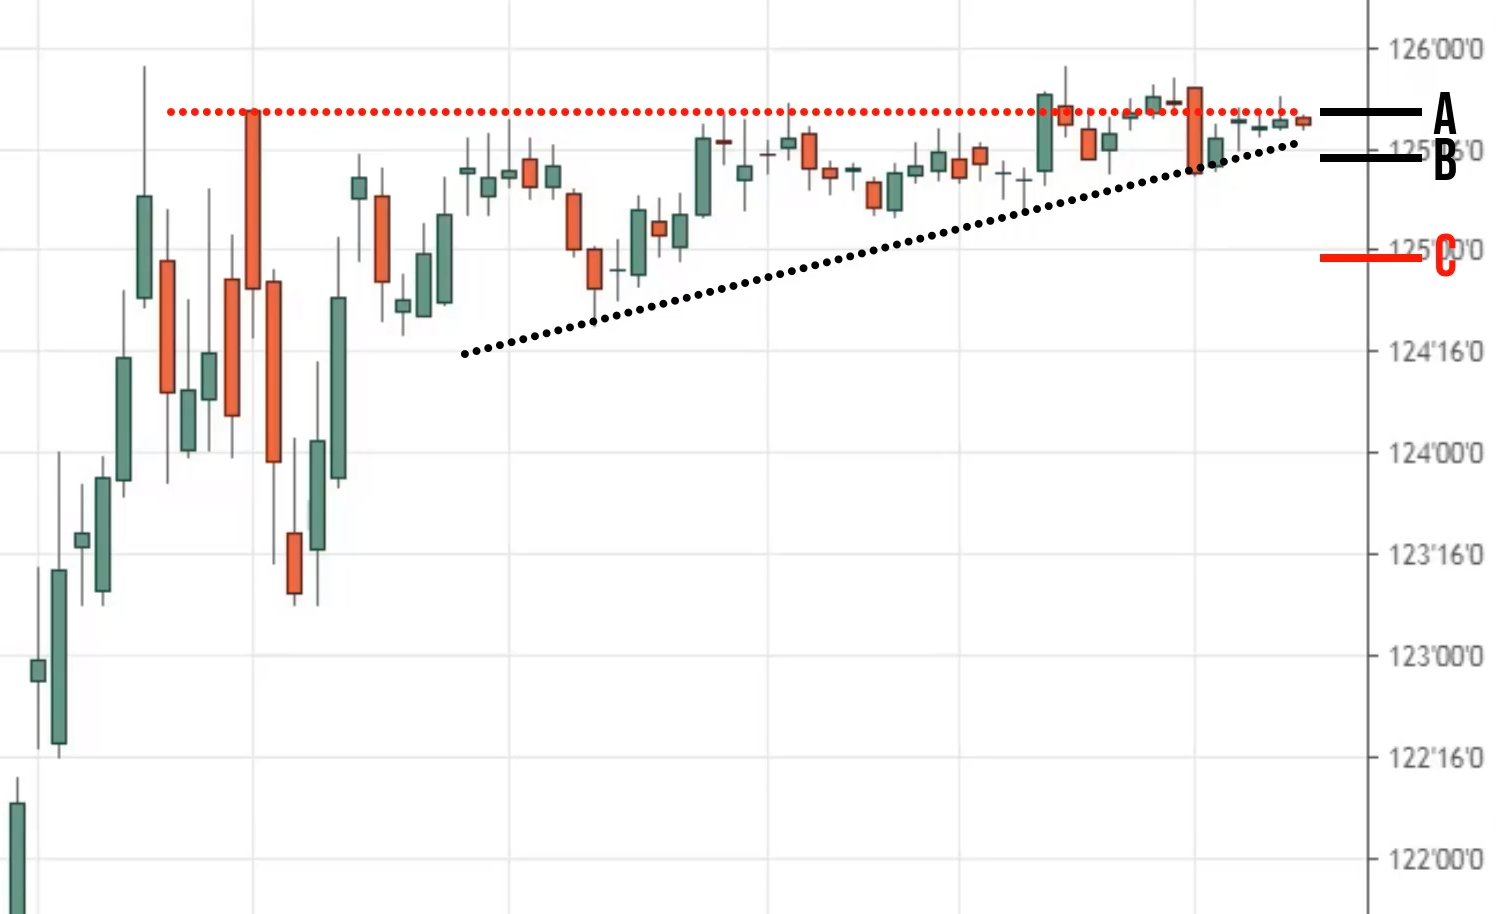
Is it at point A, B, or C?
The answer is Point C.
If the price reaches point C, this ascending pattern is invalidated. The price can go into A & B.
You can see that the triangle is still intact because the trendline is not yet broken.
This is a very simple concept, it's useful for placing sound logical stop loss.
Levels to consider when placing your stops when you are right.
What if the market moves in your favor?
Where do you exit the trade?
For this part, you need to look out for two things;
- Ask yourself, are you trying to capture a swing?
- Ask yourself, are you trying to ride a trend?
With different goals in mind, you would use different trading techniques.
If you're trying to capture a swing then what you have to do is have a fixed target profit, usually at swing high or swing low support resistance.
Most people even use Fibonacci extensions it’s up to you.
For trailing stop loss, you can use techniques like the moving average, price structure, chandelier stop, etc.
I’m only going to go through a few.
You can explore further and look through other training materials out there.
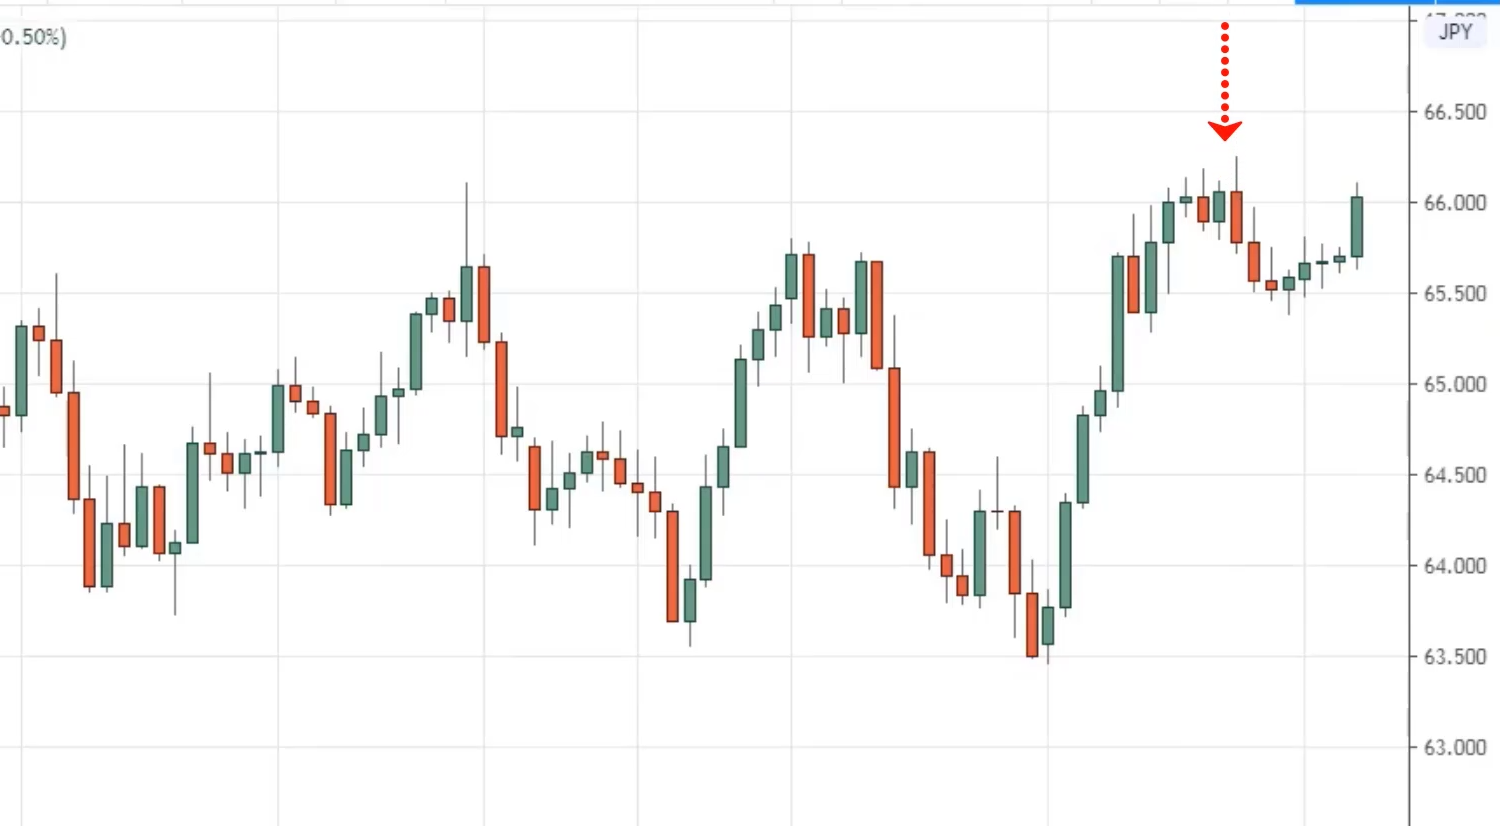
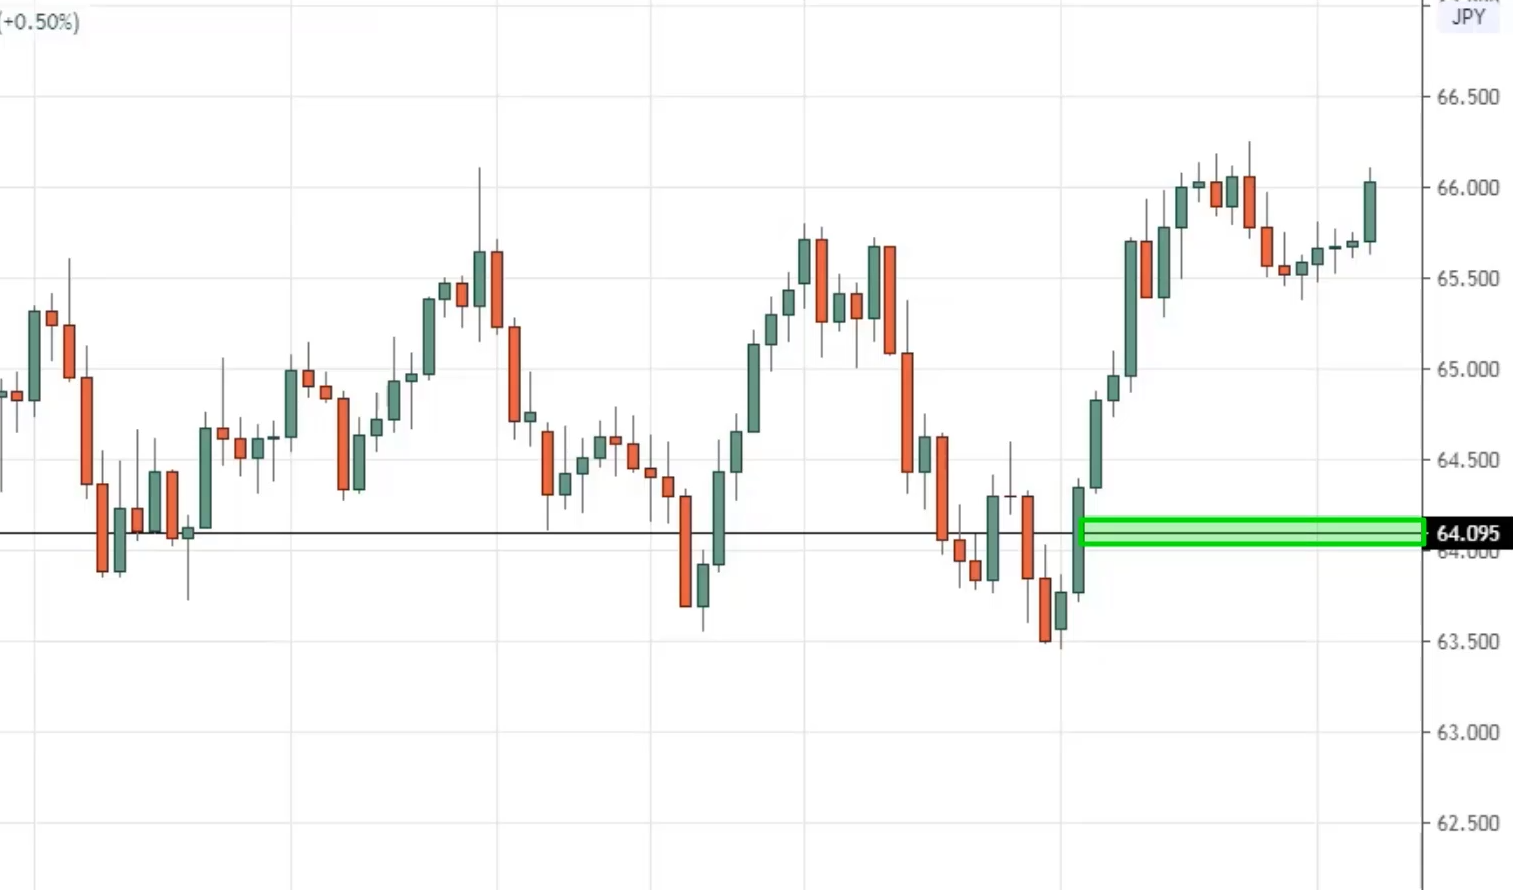
Example on NZDJPY 8-hour timeframe…
Let's say you have an entry trigger to go short, maybe there's this price rejection over here and a bearish engulfing pattern and you went short.
You want to capture a swing in this market. Looking at this chart right now, where might potential buying pressure come in?
Because you're selling at this point, so you want to exit your trade before the bias steps in and push the price higher.
You ask yourself, where would we likely have a potential buying pressure stepping in?
If I want to take profit if I want to capture a swing, I'll say the $64 price point right will be a level I'll be looking at to take profits.
Make sense?
How to piece the five things to look out for
If you still remember what I've shared;
- Market Structure
- Area of Value
- Entry Trigger
- Exit
This is what we call the “MAEE Formula”
Most of you might be familiar with it, let’s walk through a few examples and see how we can apply this amazing formula to your trading.
It doesn't matter whether you're trading stocks, forex, the daily timeframe, on a weekly timeframe, this concept can be applied the same.
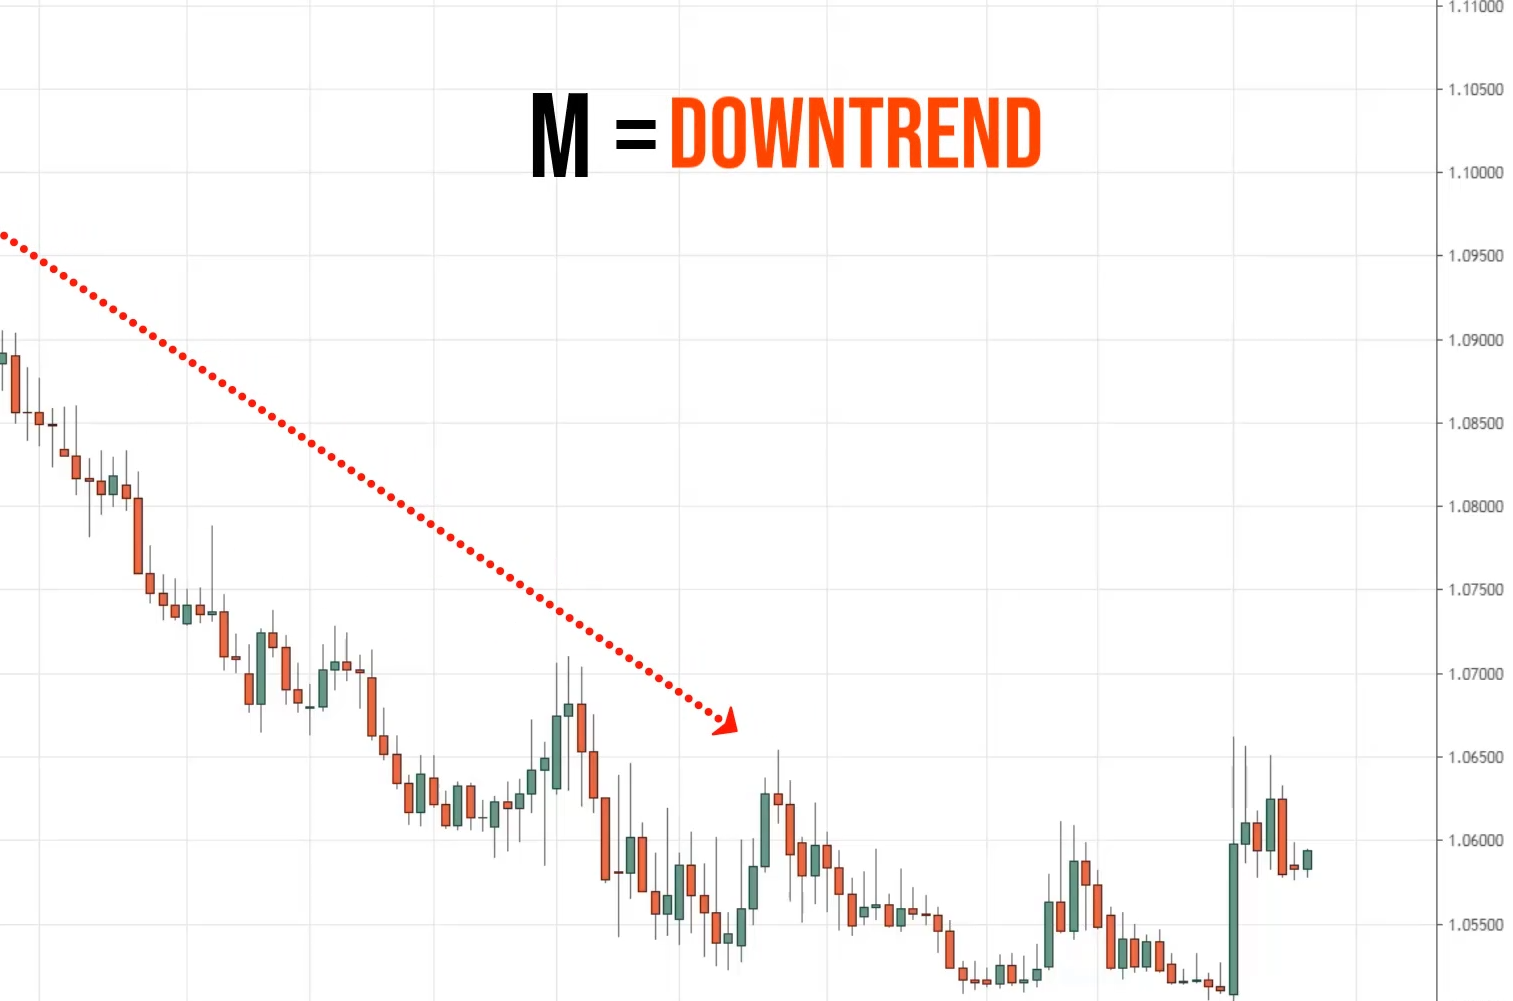
Example on EURCHF daily timeframe…
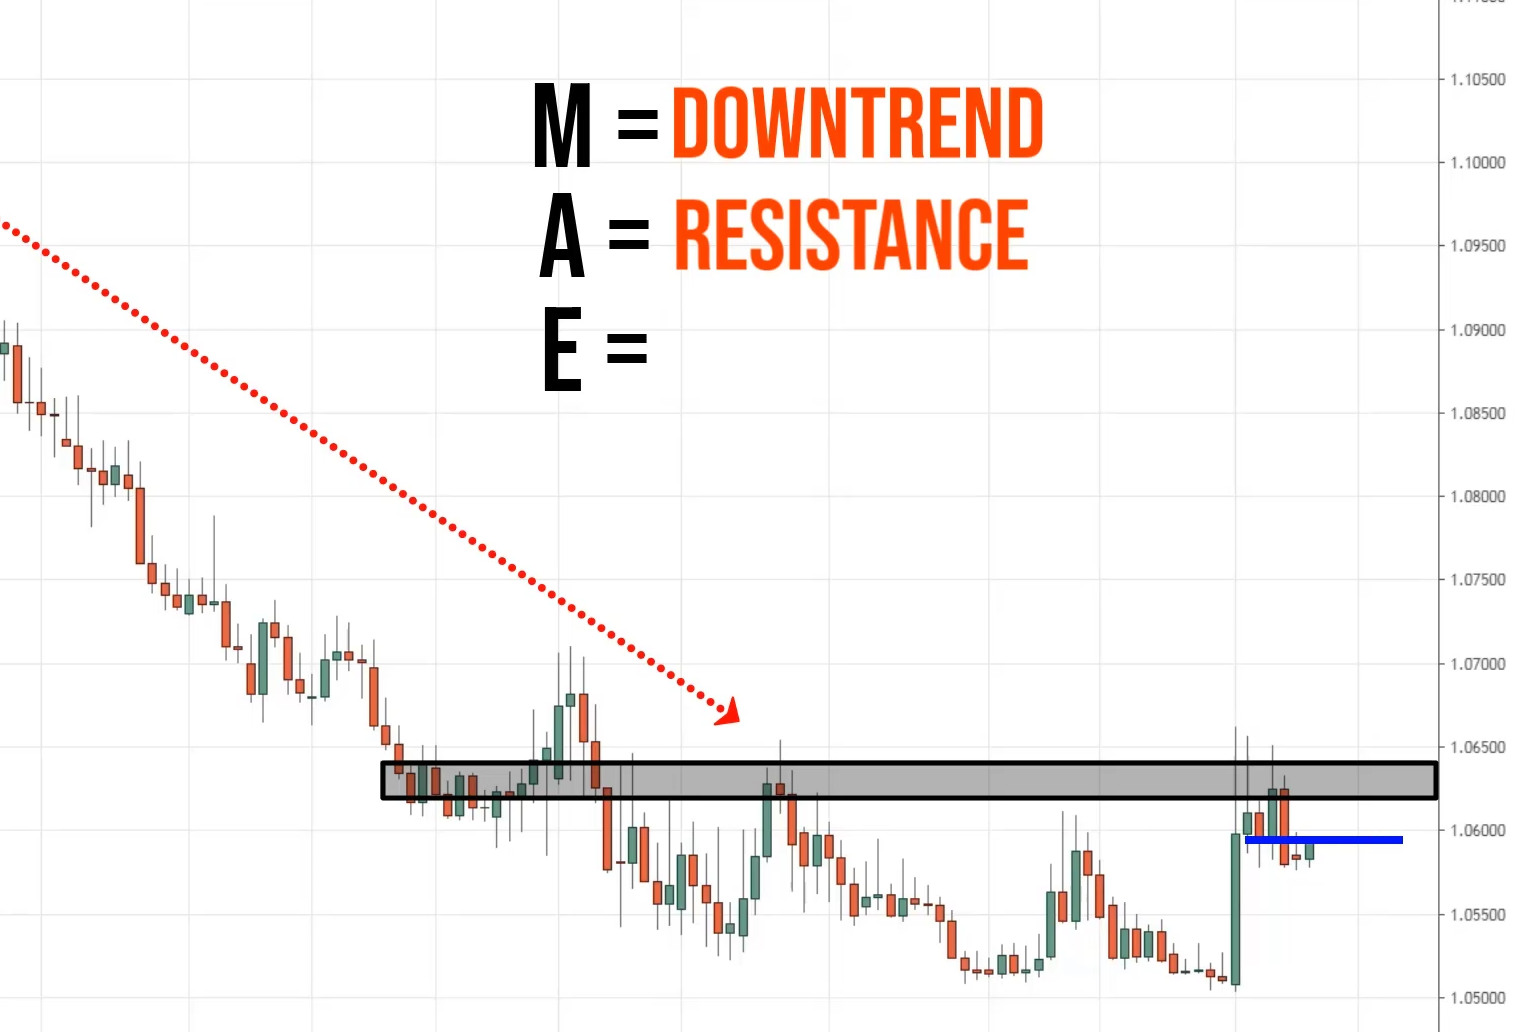
At this point, what is the market structure of this chart that you are looking at?
Downtrend?
Yes!!!
We know that the market structure here it's in a downtrend.
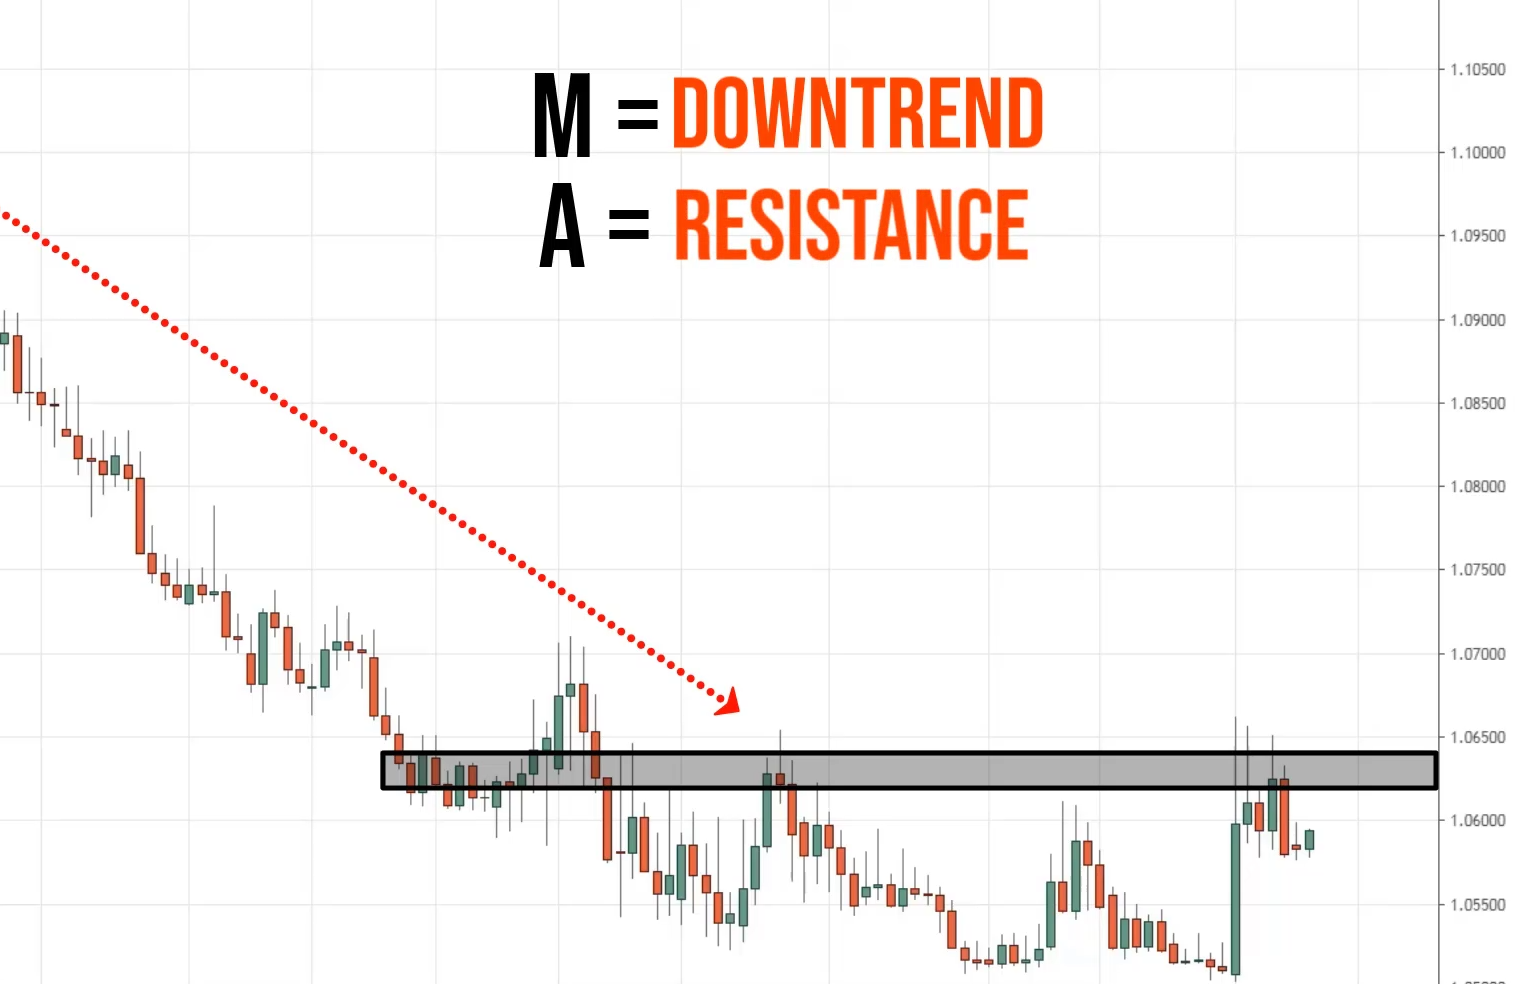
Where is the area of value?
From what I'm seeing over here, we have a possible area of value at this area over here.
Where this is an area of resistance.
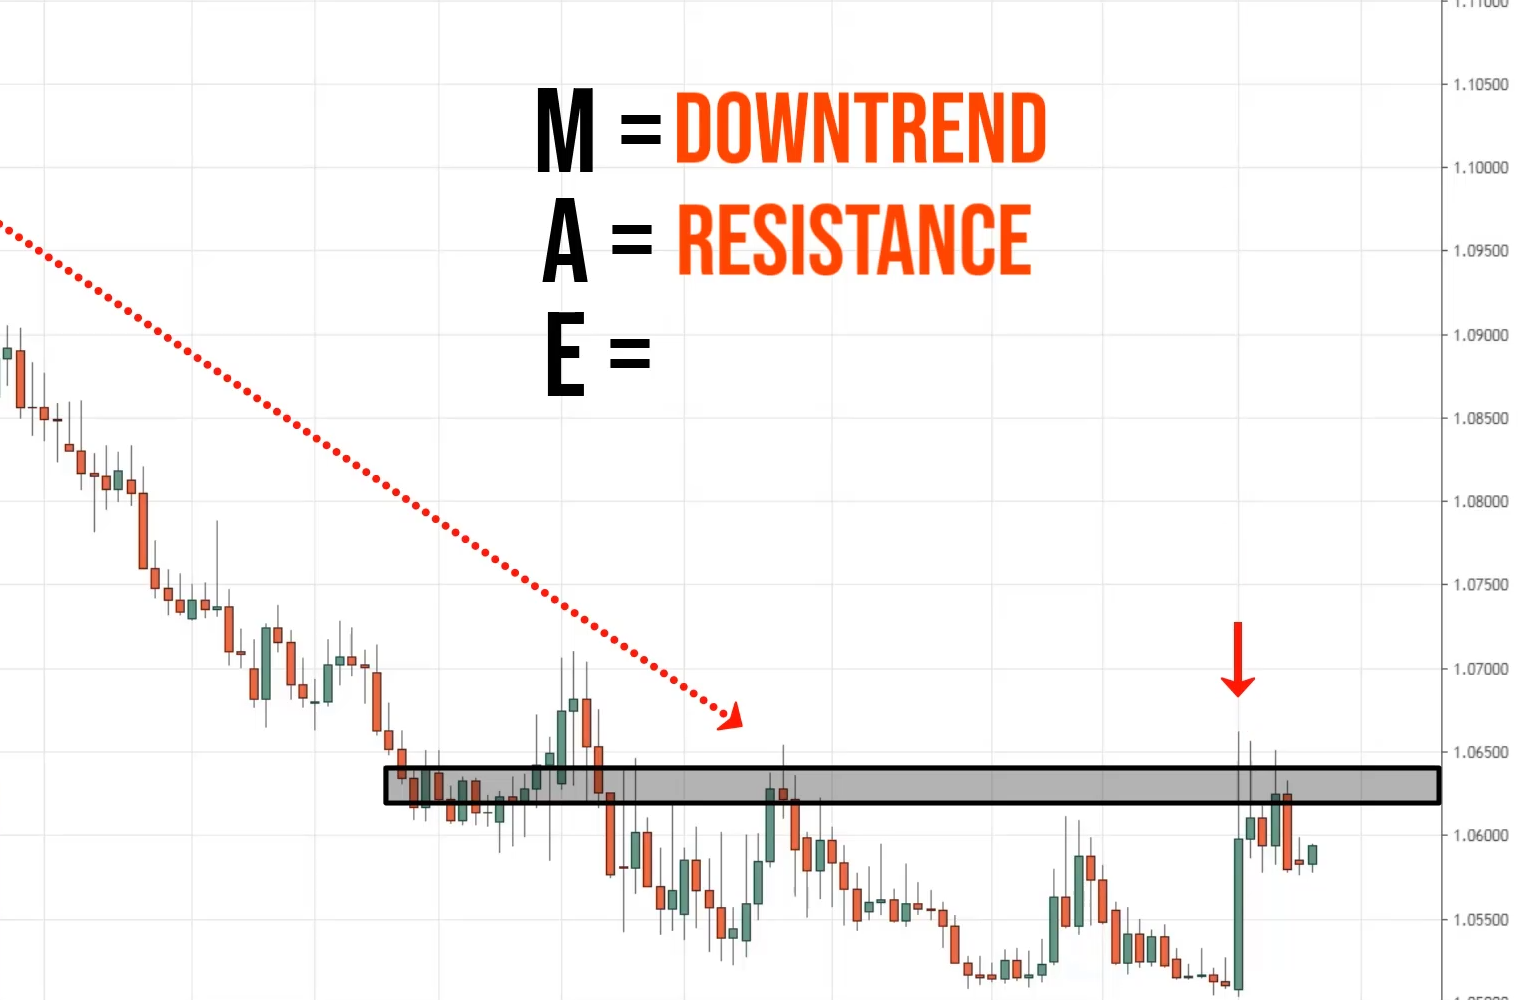
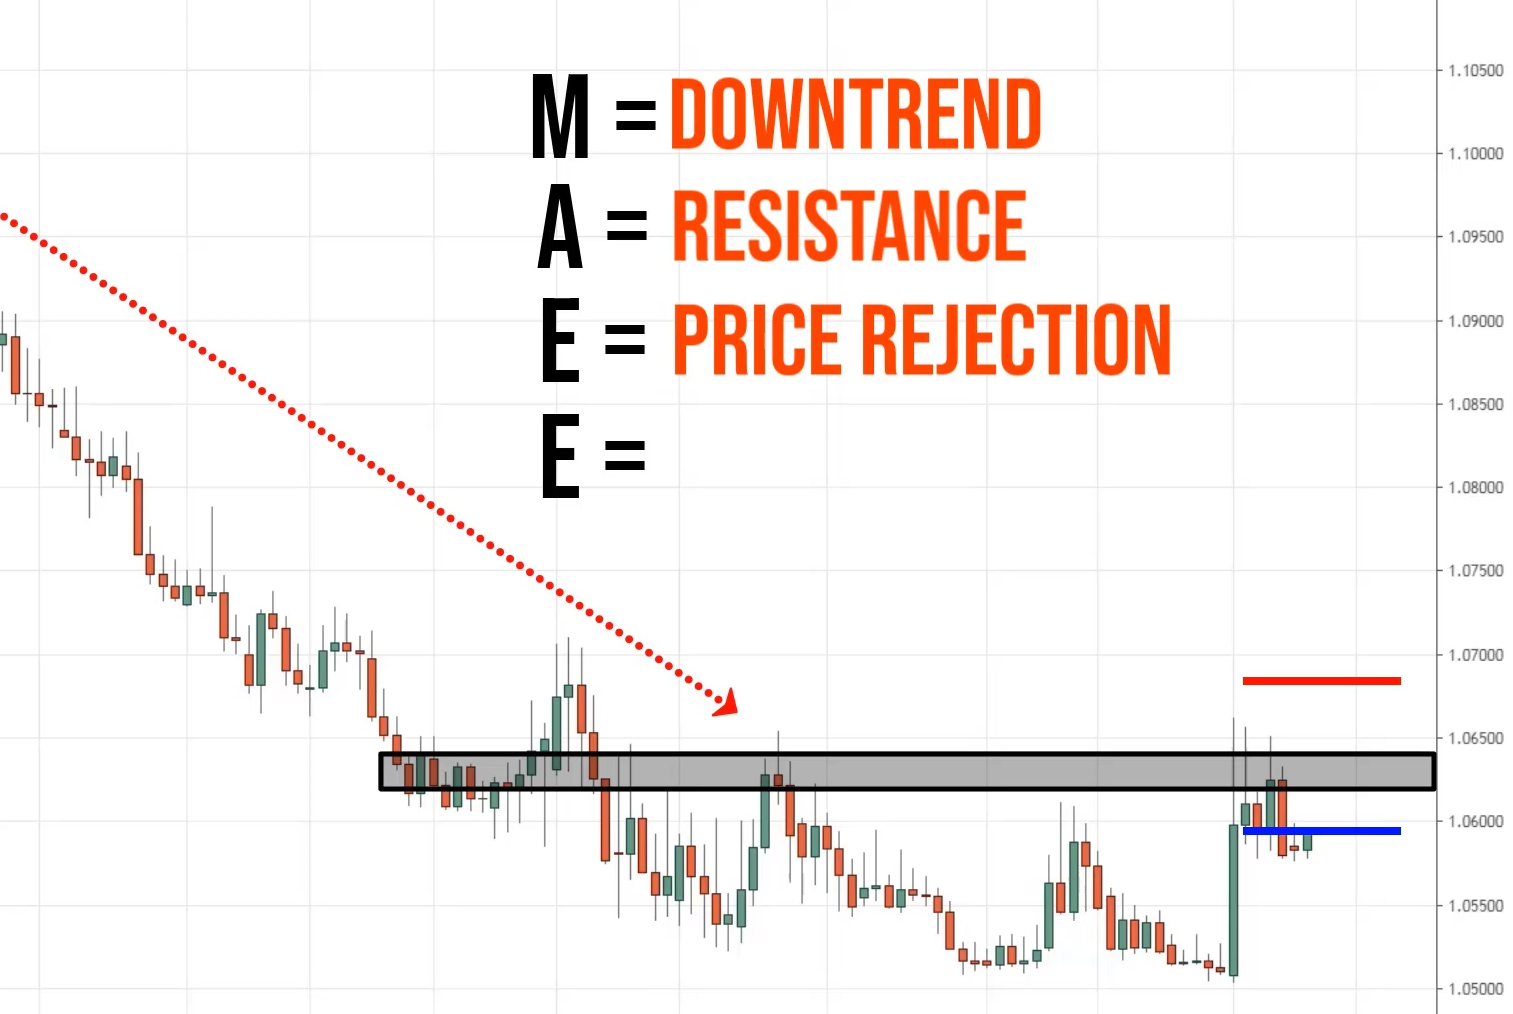
The next thing is the entry trigger. Do we have an entry trigger to trade this market?
There are multiple price rejection and this acts as an entry trigger to short this market.
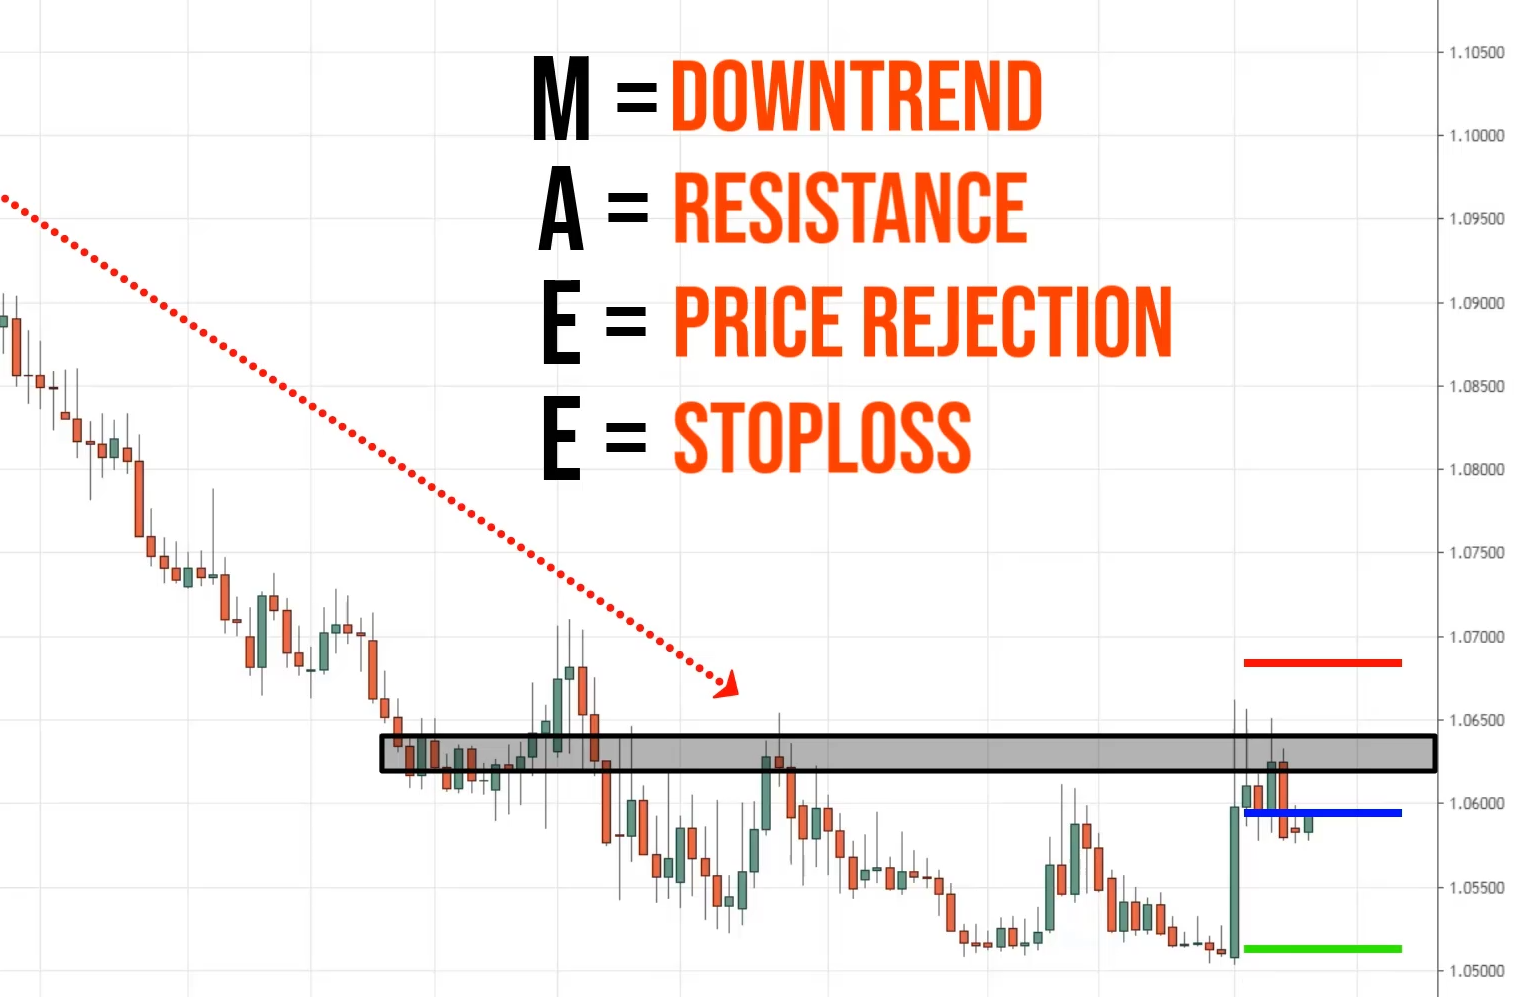
What about exit if we are wrong?
At this point, where the resistance will be invalidated is if the price reaches this level.
If it reaches this level, I will say this resistance is broken and I should be out of the trade.
We have our exit if you're wrong, we'll call this the stop loss.
What about exit if we are right?
This depends on what you're trying to achieve.
Are you trying to ride this downtrend or you're just satisfied with capturing one swing?
If you're just happy with one swing then this is a possible target to exit your trade at this area of support.
This is how you apply the MAEE formula to your trading.
Recap
- Market structure
- Area of value
- Entry trigger
- Exit if you’re right or wrong

