#11: Multiple Timeframe Secrets
Lesson 11
In today’s training, it’s all about multiple timeframe secrets.
Here's what we'll talk about:
- Stacked levels: How to identify market turning points with precision
- Rubber band effect: How to avoid low-quality setups that fool many traders because it looks like a “high probability” trade
- How to improve your winning rate instantly using this one simple technique
Let’s get started…
Avoid making these mistakes
When using multiple timeframes, the first mistake to avoid is:
Zoom out too little
Traders they zoom out their charts too little till it becomes meaningless.
Let's say you trade off the 5-minute timeframe and you use multiple timeframe analysis. You go up a higher timeframe like the 10-minute timeframe. To me that's useless.
That's irrelevant because, on both timeframes, you'll see that the information you get it's somewhat similar.
You don't get any new information just by going up from a 5-minute timeframe to whatever timeframe.
That's the first mistake.
You zoom out of your charts, or rather you go up to a higher timeframe, but it's not significant enough to give you any new information about your trading.
Zoom out too much
This is where you overkill things.
For example, you trade on the 5-minute timeframe and you zoom out to the monthly timeframe, that is an overkill because whatever happens on the monthly timeframe is irrelevant to a trader or the 5-minutes timeframe.
That is something like, let's say you are at your house and you ordered a piece and you want to know what your neighbour’s doing next door.
Something is noisy out there. You're curious, but you're blocked by a fence.
What do you do?
Normally, you would just pick a ladder and climb a ladder and you can see what your neighbour is doing.
But when you zoom out too much, that is like going into space and look down to see what your neighbour is doing, that is overkill.
That's what I mean by zooming up too much.
Where do you use multiple timeframe analysis?
The sweet spot
There is a sweet spot to it.
You cannot zoom up a little and at the same time you cannot zoom out too much because it becomes overkill.
What is the sweet spot?
Secret #1: Factor of 4 to 6
When you use multiple timeframe analysis you want to use a factor of 4 to 6. This is something that I believe it's mentioned by Alexander Elder or Adam grimes.
This is a technique that I learned from them.
Example
The higher timeframe between a factor of 4 to 6. What do I mean by that?
Let's say we go with a factor of 4.
Let's say you're trading on the 1-hour timeframe. Your higher timeframe should be the 4-hour timeframe.
How do you get 4-hour timeframe?
Just take a factor of 4 and multiply by your trading timeframe being the 1-hour and you get the 4-hour timeframe as your higher timeframe.
For a factor of 6, let’s say your trading timeframe is a 5-minute timeframe, and what is your higher timeframe?
If you are using a factor of 6, you just pick 6 and multiply it by 5-minute and you get the 30-minute as your higher timeframe.
This is a very useful technique to use to define what is your higher timeframe.
Let me give you another quick one.
Let's say you are going with a factor of 5. Let's say your trading timeframe is the 2-hour timeframe.
What is your higher timeframe? Your higher timeframe should be a 10-hour timeframe.
I hope you got that one. That's the first secret.
Whenever you use multiple timeframe analysis, whatever you have to define your higher timeframe.
Remember this factor of 4 to 6. Anywhere between 4 to 6 is fine, or even 3 to 5 is perfectly fine. Just remember this range.
Next…
Secret #2: Stacked levels
What is the stack level?
First scenario:
Let’s say on valentine's day, your wife/girlfriend they do appreciate it, they want to be loved on that day.
Second scenario:
On valentine’s day again, but this time it happens to be your wife’s birthday. It’s the same day that the two of you got married too, it’s your wedding anniversary.
Now let me ask you, which scenario is more significant?
Probably scenarios 2 would be more significant because we have a confluence of events coming up together on that same day.
Although I know the truth is because you want to be a cheapskate at it.
You can agree that in the second scenario where we have multiple loads of events that make the occasion more meaningful and significant.
Why am I sharing this with you? Because this is the same as trading.
Let's see you identify a level on the daily timeframe.
If that level has a confluence offer, let's say all sorts of a weekly level, same level. It becomes more significant.
Let me just explain to you what I mean by this.
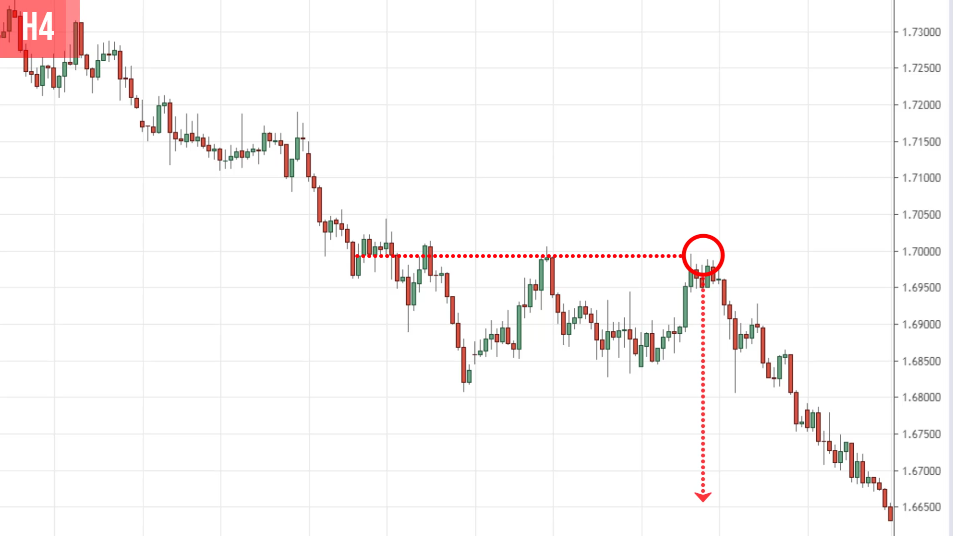
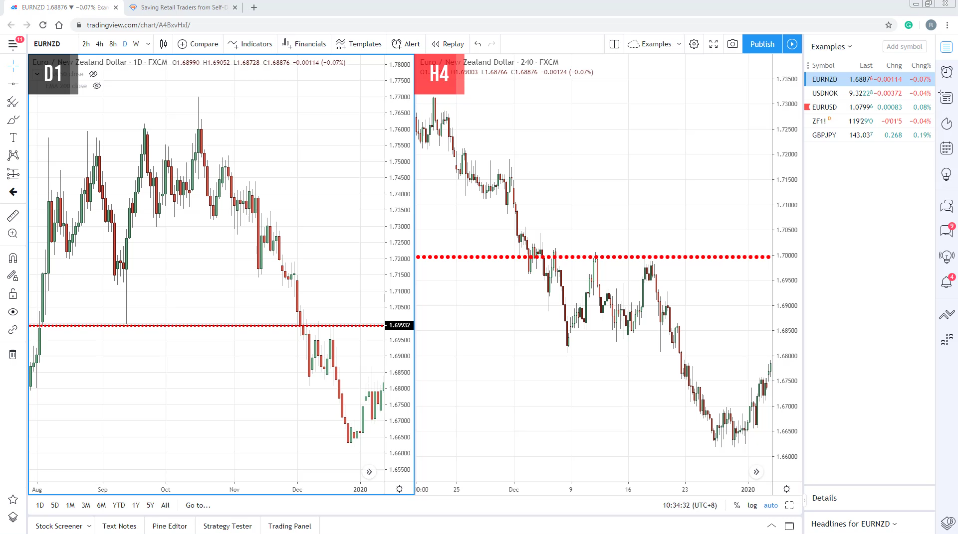
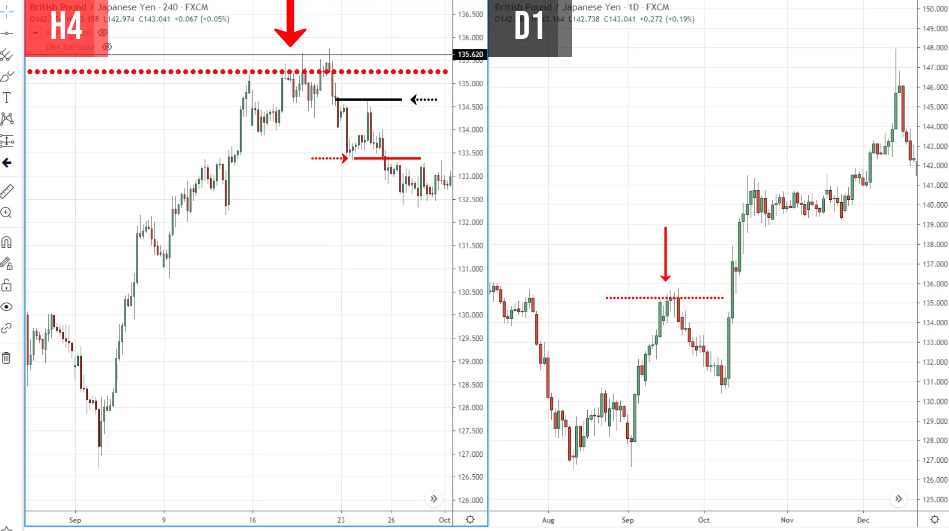
Look at this chart over here.
Why did it reverse at this particular level? Some of you might look at it and say, “Rayner, that’s an area of resistance level.”
What makes this one special?
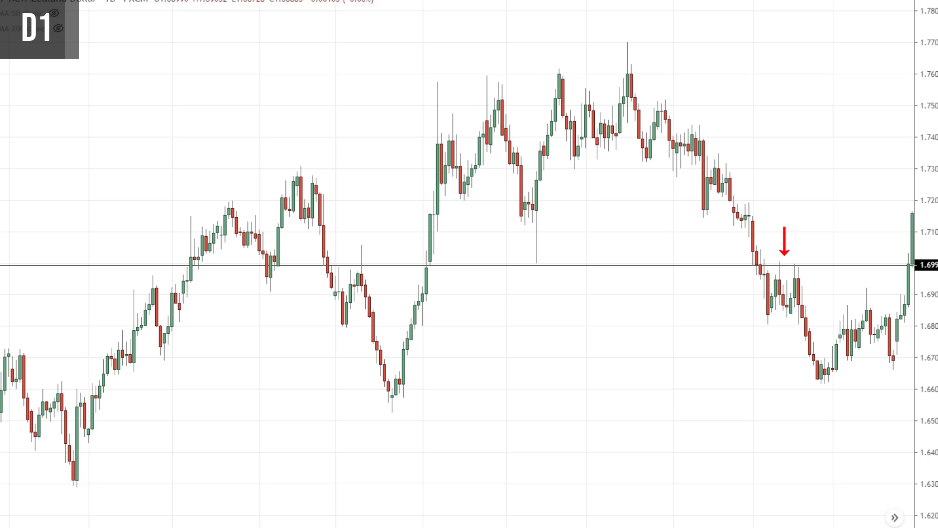
Remember multiple timeframe analysis. If I go up to the higher timeframe, as the daily timeframe from the 4-hour to the daily is a factor of 6.
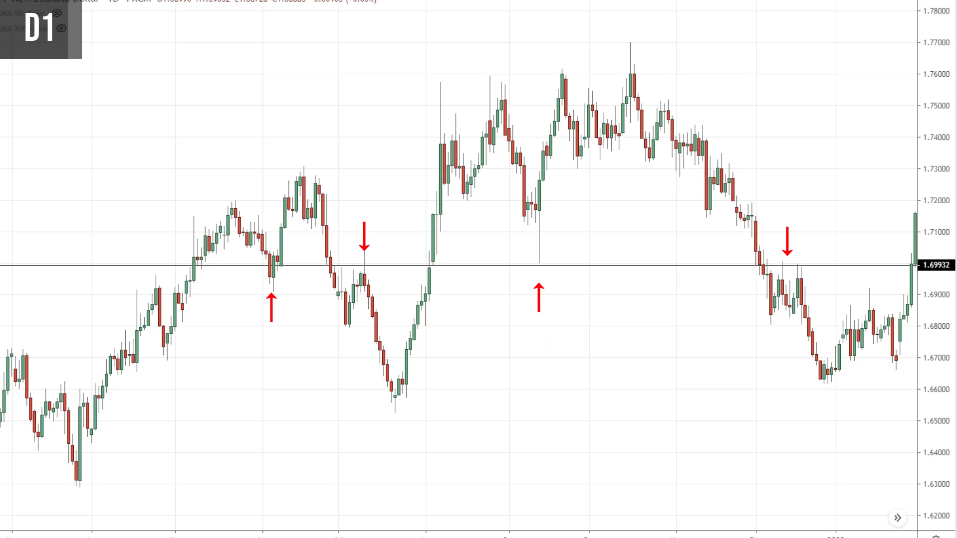
You can see on the higher timeframe, this particular level over here. Let me just point out.
It has a confluence of this one over here on the higher timeframe for multiple times.
You can see that on the higher timeframe, which is the daily timeframe, this level is significant.
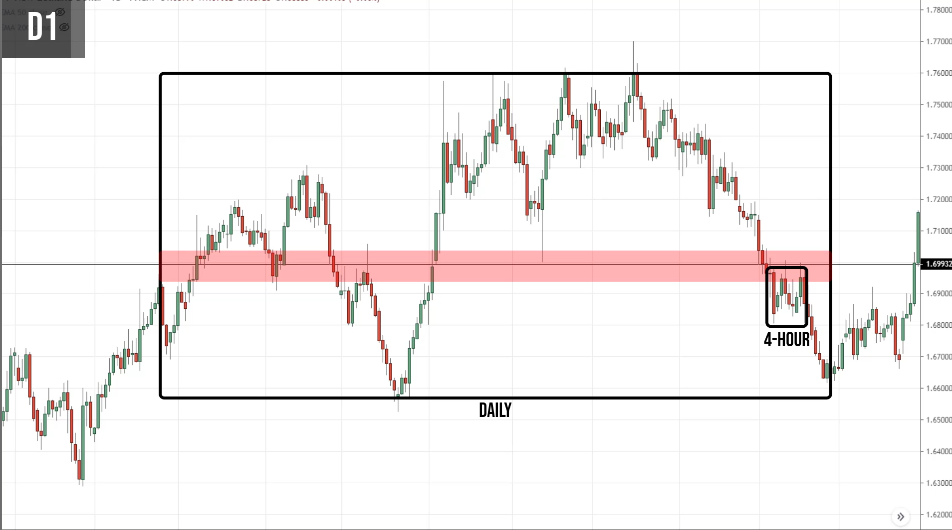
The 4-hour level has a confluence with the daily level, and that becomes a special level.
Let me just put this side by side so you can see where I'm coming from.
Do you see the significance of this?
This level now is no longer just a 4-hour timeframe resistance. It's also a daily level area of significance.
This is how you use your stack levels when you are using a multiple timeframe analysis.
If you identify a level, and there’s a confluence of a higher timeframe level at the same spot and area, that level becomes significant.
Secret #3: Rubber band stretch
When you understand multiple timeframe analysis. You will know when to buy and when to sell.
You don't want to be buying when the price is far away from the area of value on the higher timeframe.
I know that sounds confusing.
Example #1:
If you look at this chart over here:
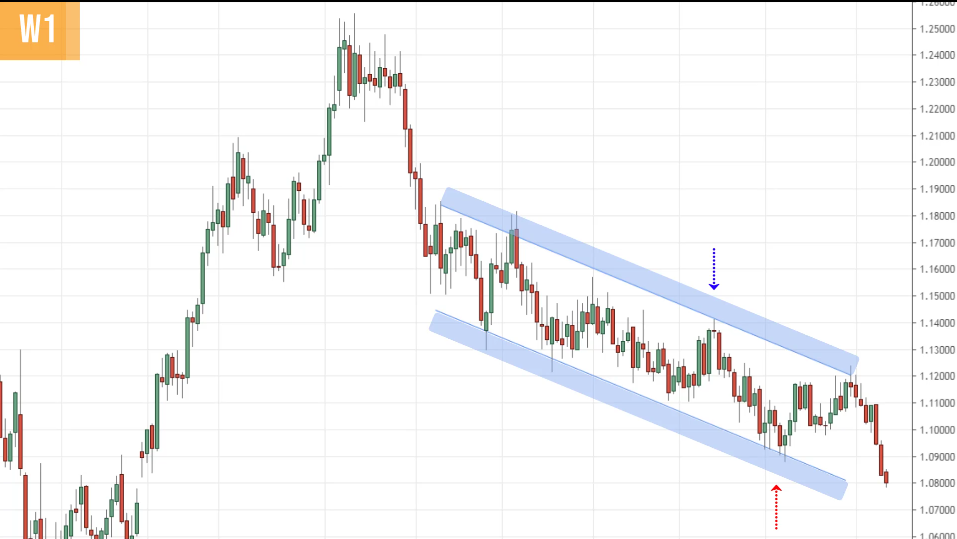
They would look at this price breakdown and the swing low and be like:
“Oh man, I should be selling, look at this Rayner, the market is in a downtrend. It just broke the swing low, let's sell!”
To be honest, this is what I used to do until I found out the mistake that I did. This revelation came only when I understood multiple timeframe analysis.
Let's look at the big picture.
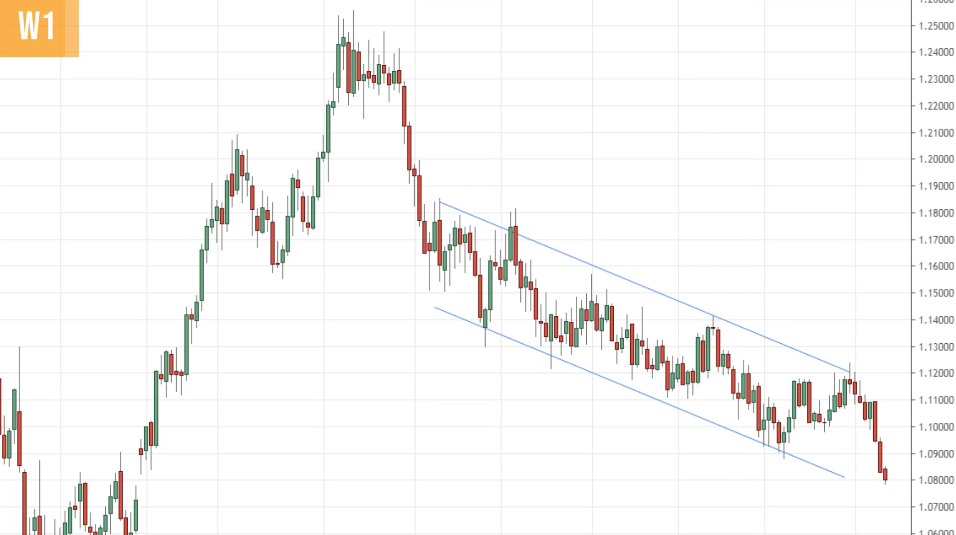
If we trade on the daily timeframe, we can use the weekly as our higher timeframe guide.
Let's identify the area of value of this chart, we can use tools like trendline, a moving average whichever you like.
In this case, I just go with the trend line. I realized I can draw a channel.
What you realize over here is that when you were selling early on a daily timeframe, you are selling near the lows of this trend channel.
Is this an area of value? If you think about this, you know that the market has been contained in this trend channel.
If you want to sell, you're going to be selling via the upper channel. And possibly you are taking profits near the lows of this channel.
You don't want to be selling at the lows of this channel because that is possibly one of the worst areas you can look to short the market.
You won’t know this if you don't understand multiple timeframe analysis.
If we go back earlier to the daily timeframe…
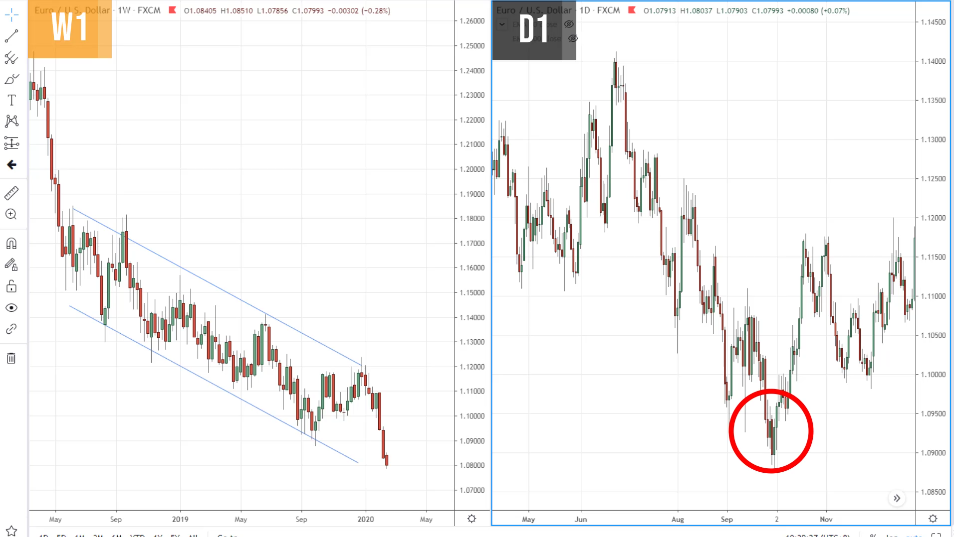
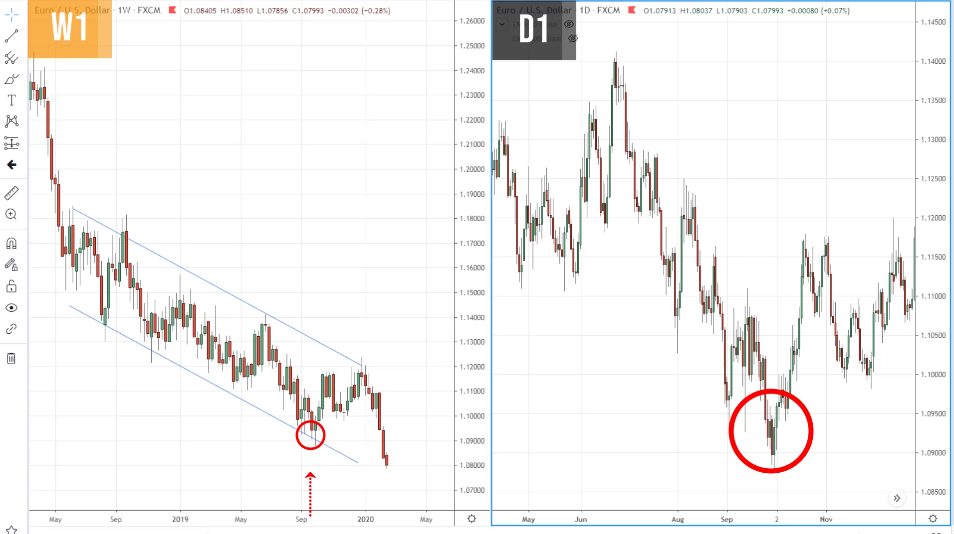
This is the weekly timeframe and the daily timeframe that you see over here.
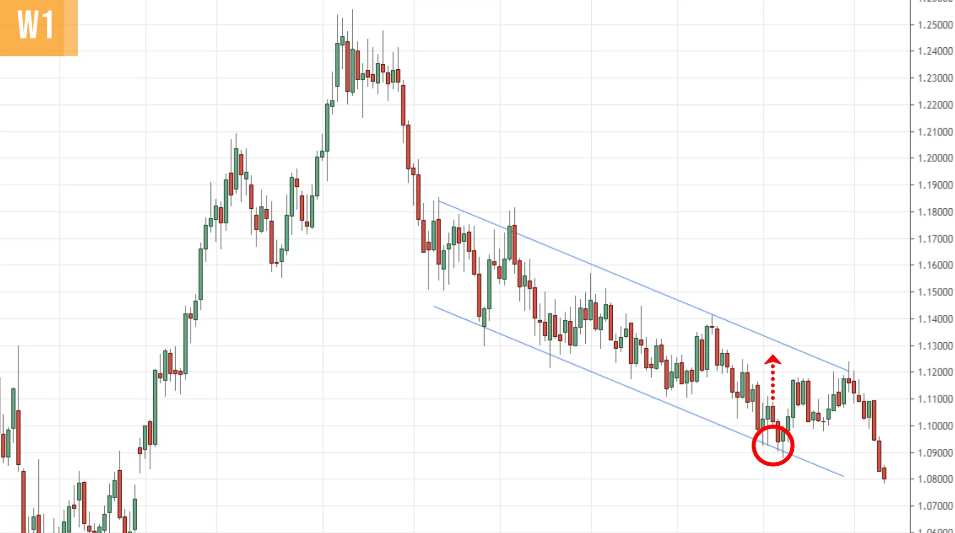
You can see that over here when you're selling it at this point, you are selling near the lows of the channel on the weekly timeframe where buying pressure will step in to push the price higher.
You can see the significance when you understand multiple timeframe analysis.
It gives you an extra visual, a bird's eye view of what you're doing in the market, whether you are selling into an area of resistance or support. This is important stuff.
Let me give you one more example.
This time around we'll use a different tool to define your area of value.
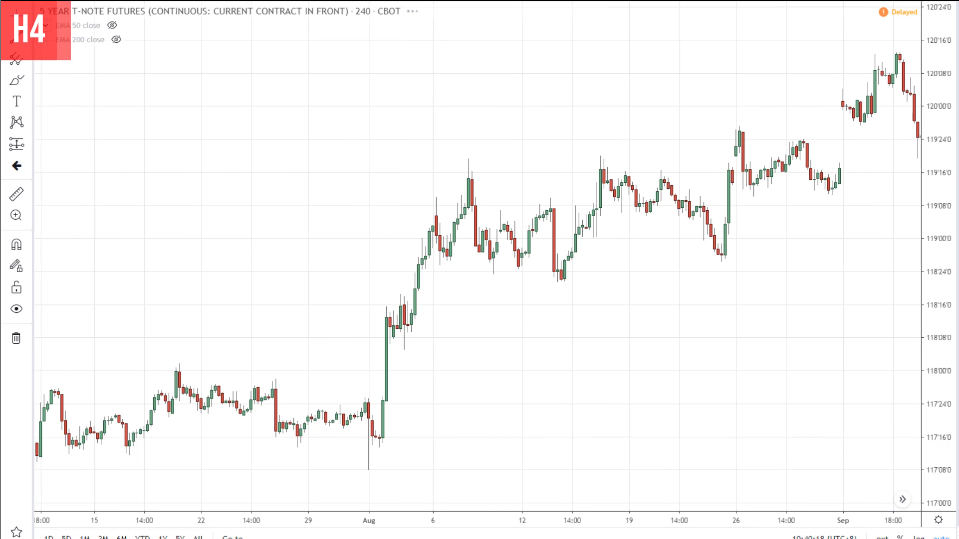
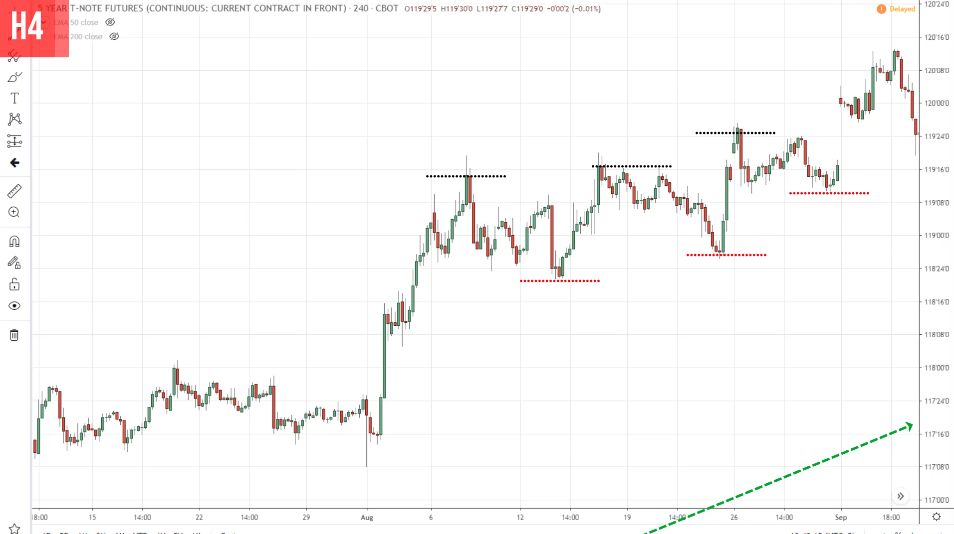
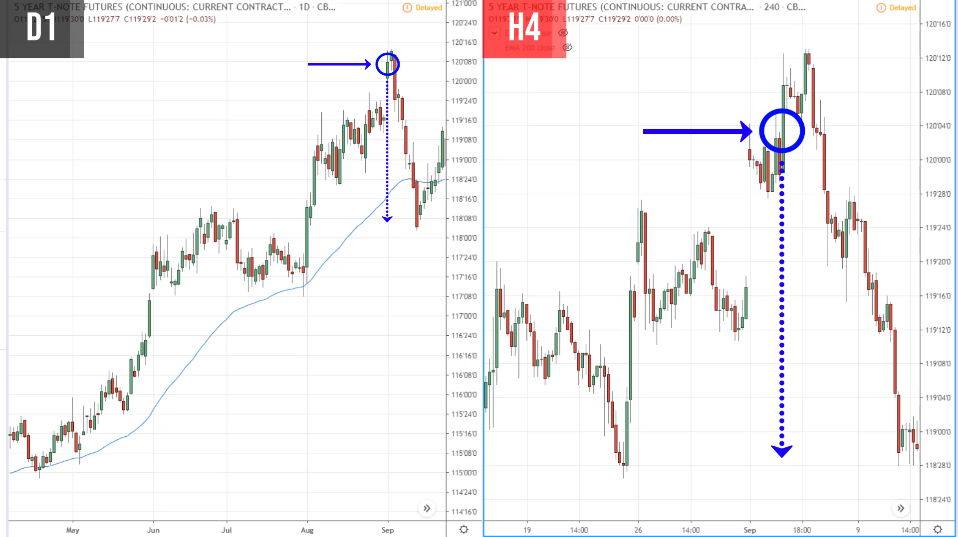
Example #2 (5 Year T-Note Futures):
If you look at this chart, many traders will say, “Oh Rayner, look at these higher highs and higher lows, the market is in an uptrend!”
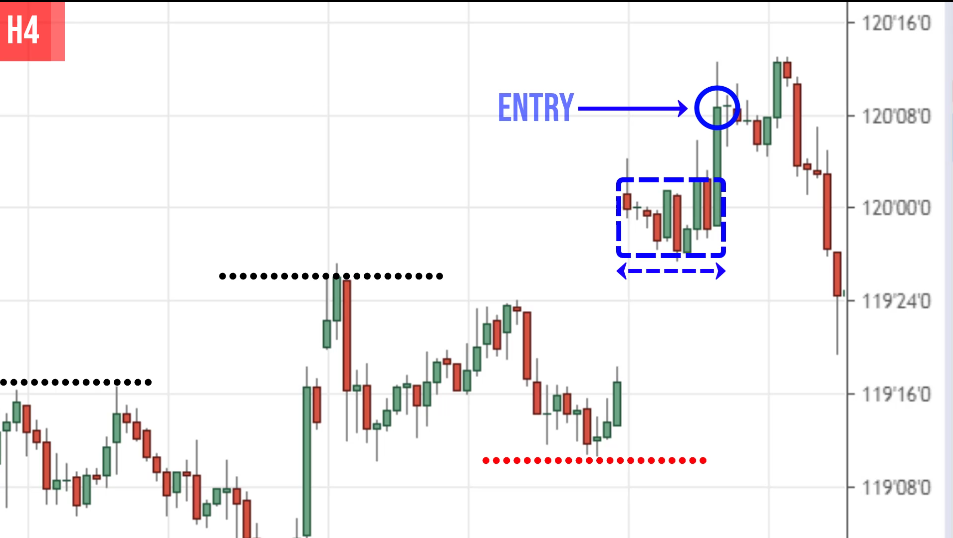
“There's a consolidation here Rayner let's buy the breakout”
Do you want to do that? I hope not.
Because you want to see where you are in the grand scheme of things. You want to know where you are in the big picture.
Again, using multiple timeframe analysis. How can we do that?
This is a 4-hour timeframe. I’ll use a factor of 6 so the higher timeframe to me is the daily timeframe.
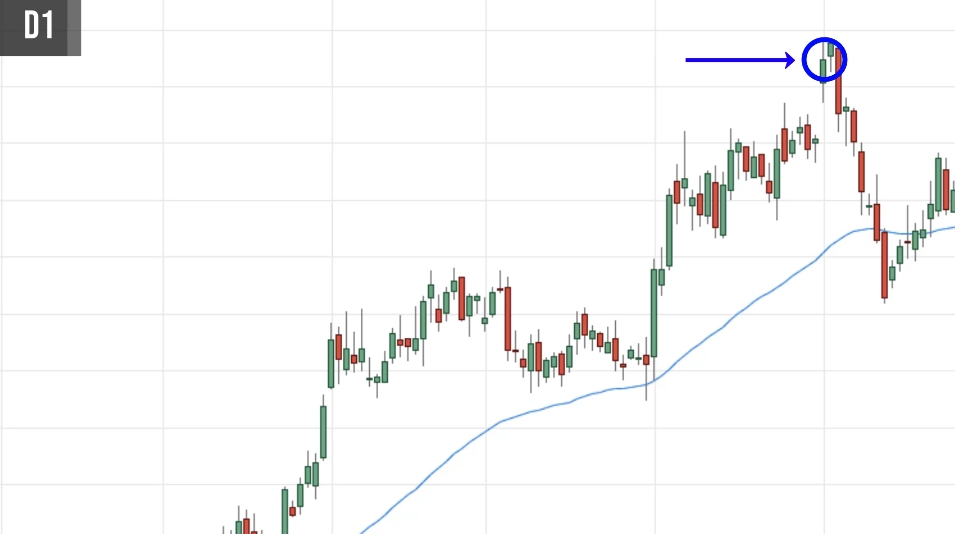
Let's look at the daily timeframe and see where we are.
Earlier at that point where you are buying, you are buying at this point over here on the daily timeframe:
When you look at this, do you want to be buying this high on the daily timeframe?
If you take a step back and you look, you notice that the price tends to respect the 50-period moving average.
There you know, the 50-period moving average is an area of value for this market.
You don't want to be buying near these highs because if the market does a pullback, you will get stopped out.
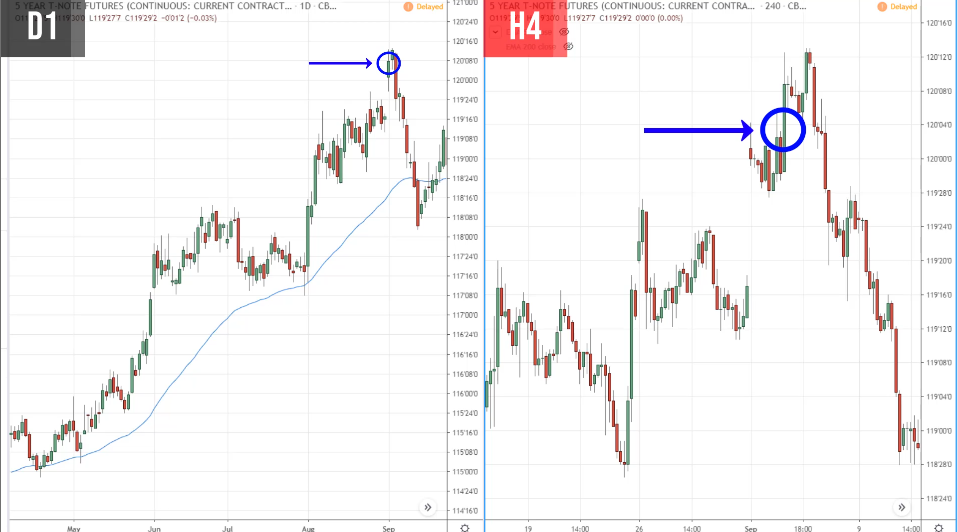
Layout the chart side by side, so you can see what you are doing in the grand scheme of things.
What you did earlier is that on a daily timeframe, you would be buying near this high over here.
For the 4-hour timeframe, if you’re not aware of multiple timeframe analysis. You’ll just buy blindly.
That you will get you stopped out on this pullback over here.
But if you're a trader who is well-versed with multiple timeframes analysis, you might hold your horses and decide:
“I don't want to buy at this high because the price now is overstretched away from the area of value. I might want to wait for the price to come to my area of value before I look to enter a trade.”
This is what multiple timeframe analysis can do for you when you understand how the big picture works.
Secret #4: Improve your win rate
How do you improve your winning rate using multiple timeframe analysis?
Look for a break of structure in the direction of the higher timeframe trend.
This might not be clear enough to understand, this is why I like to give examples to illustrate my concept.
Often, traders might say:
“Rayner, why are you cherry-picking all these charts? It’s all on hindsight.”
Yes. It's all in hindsight. I cherry-picked these charts to illustrate my concepts, but I'm not expecting you to blindly trade them.
I expect you to verify the concepts that I share with you, whether it works or not.
This is not one of those spoon-feeding session, telling you this is the way to do this or you must do it this way. This is to open up your mind and your horizon to be like water my friend.
To see that there are different ways to trade the market, different concepts that might resonate with you.
And if you think it has resonated with you, test it out and see if it works for yourself.
Don't just blindly take my word for it. This is important.
Moving onto the break of structure, let's have a look.
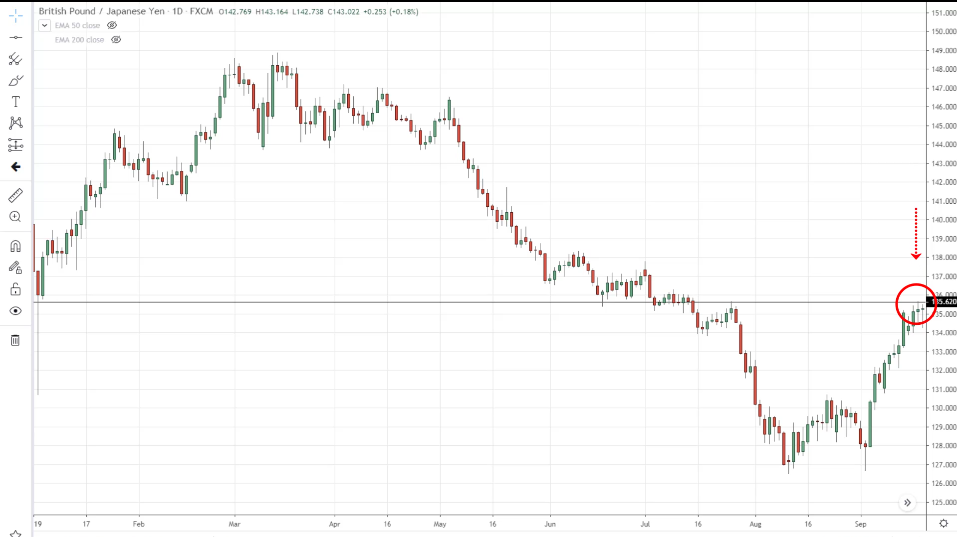
Example #1 (GBP/JPY on the daily timeframe):
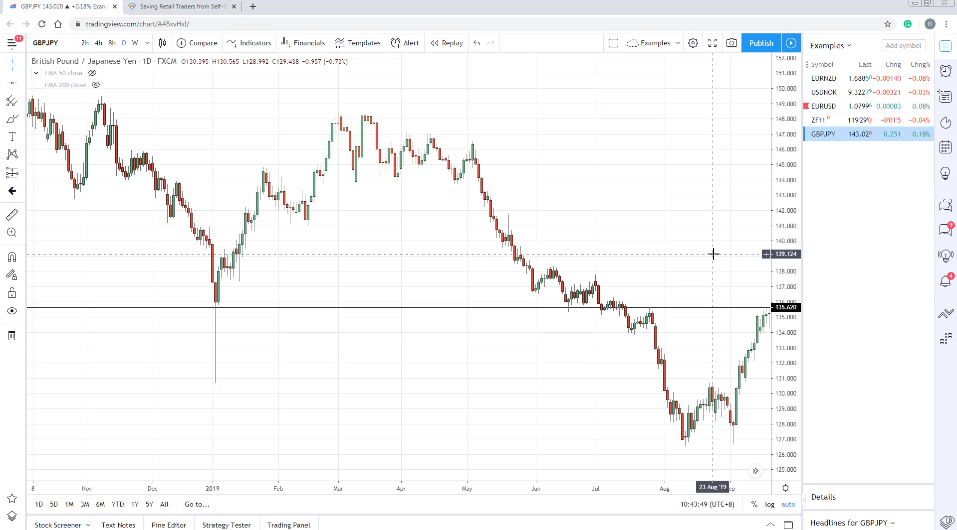
If you look at this market, you’ll notice that the price has come into this area of resistance.
You're wondering, often when traders traded support and resistance, they are all looking for common candlestick patterns like the shooting star, hammer, etc.
That’s perfectly fine.
But what if the market doesn’t form this textbook pattern that you are familiar with?
Do you forego the trade? Just let it go? No.
Because you understand multiple timeframe analysis, you’ll realize that you can time your entries without candlestick patterns.
The only thing you need to do is understand the market structure.
It is really simple. And I would explain to you how this works.
Again, on the GBP/JPY, you can see that price is in this area of resistance. This was previous support now turned resistance.
What is our entry trigger? How do we enter the trade?
There’s no price rejection, and no bearish engulfing pattern, etc.
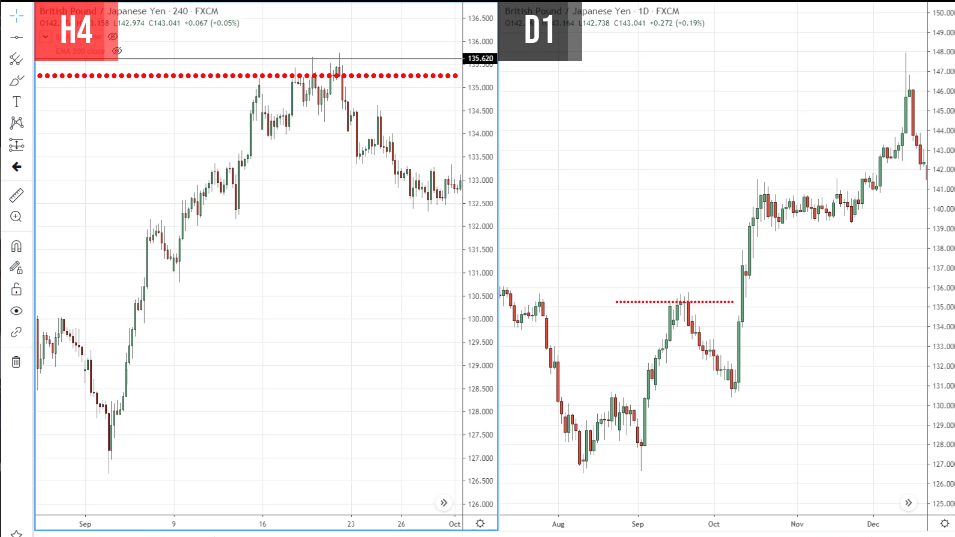
What you can do is use multiple timeframe analysis. We go down to the 4-hour timeframe, this is a factor of six.
If I overlay the chart side by side, you will see it better.
On the daily timeframe, this is the level that we saw earlier, and on the 4-hour timeframe.
The break of a structure is very simple.
Notice that there is a series of high highs and higher lows coming into this area of resistance on the 4-hour timeframe.
Break of structure simply means when you're looking for a break of this prevailing price structure.
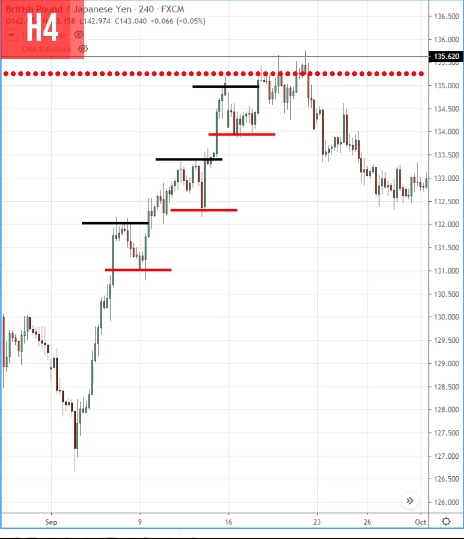
You're looking for a lower high and lower low.
Where did that happen?
The lower high and lower low occurred at this point.
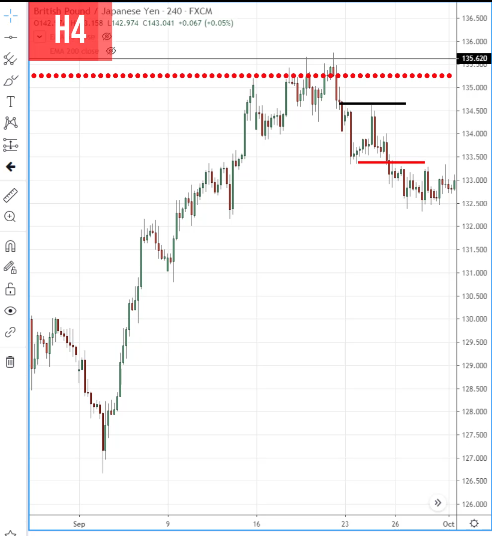
And this is not just any break of structure because this is a break of a structure at a key area on the daily timeframe.
It’s in line with the overall downtrend of the higher timeframe.
This break of structure technique allows you to better time your entries with a higher timeframe trend.
This is what I mean by the break of structure.
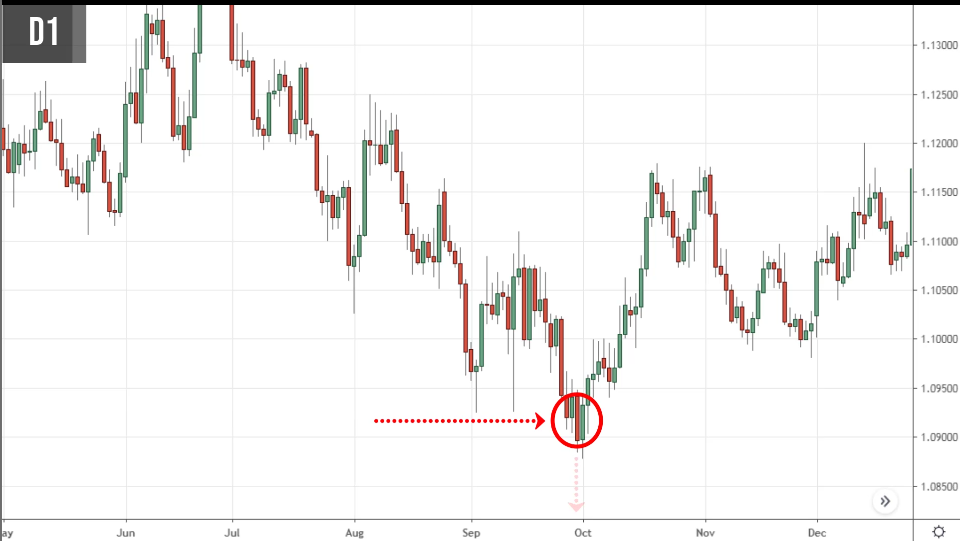
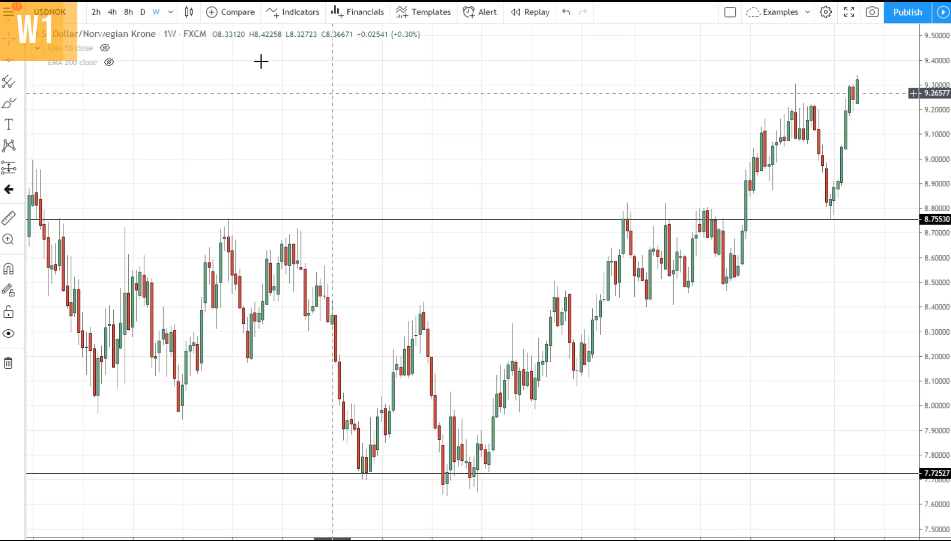
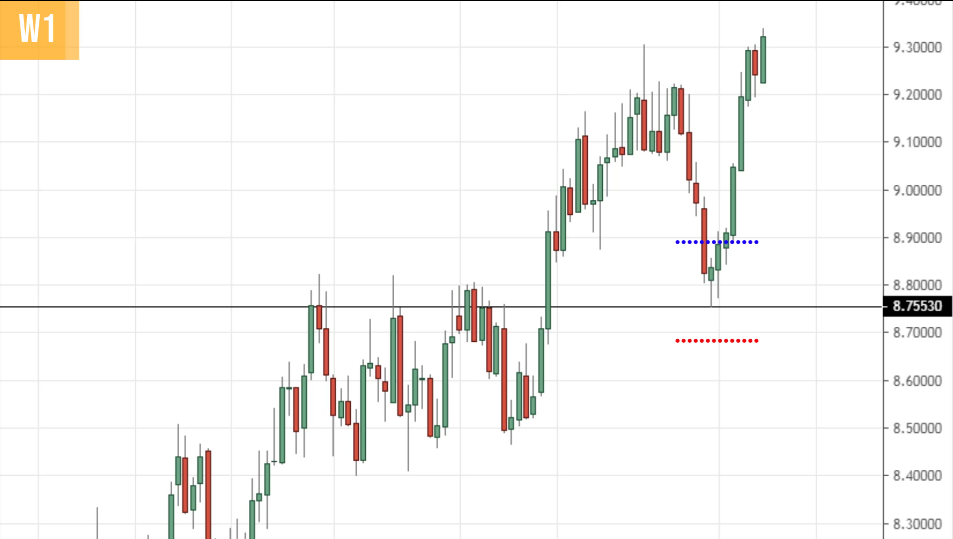
Example #2 (USD/NZD daily timeframe):
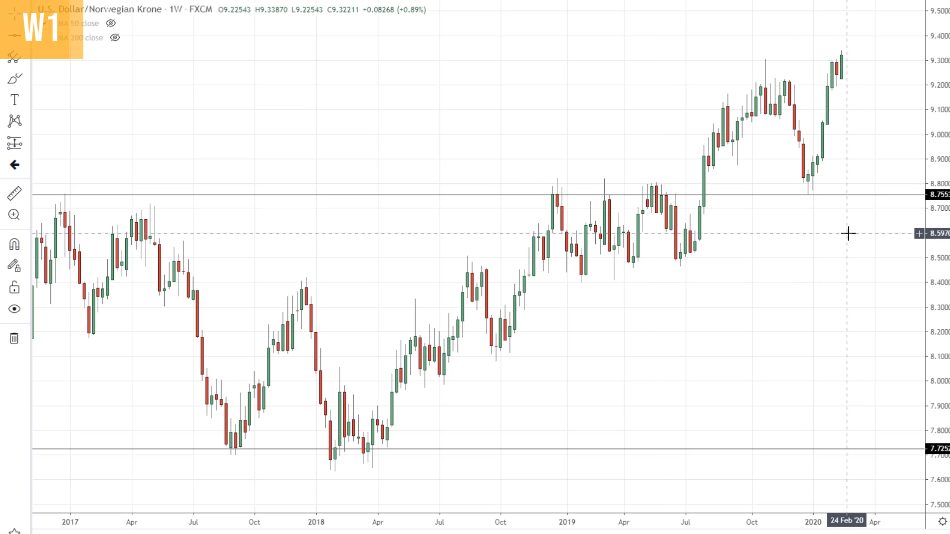
We saw earlier that on the weekly timeframe, the price is in this significant area of previous resistance turned support.
Let's say you don't have any price patterns to enter a trade, what can you do about it?
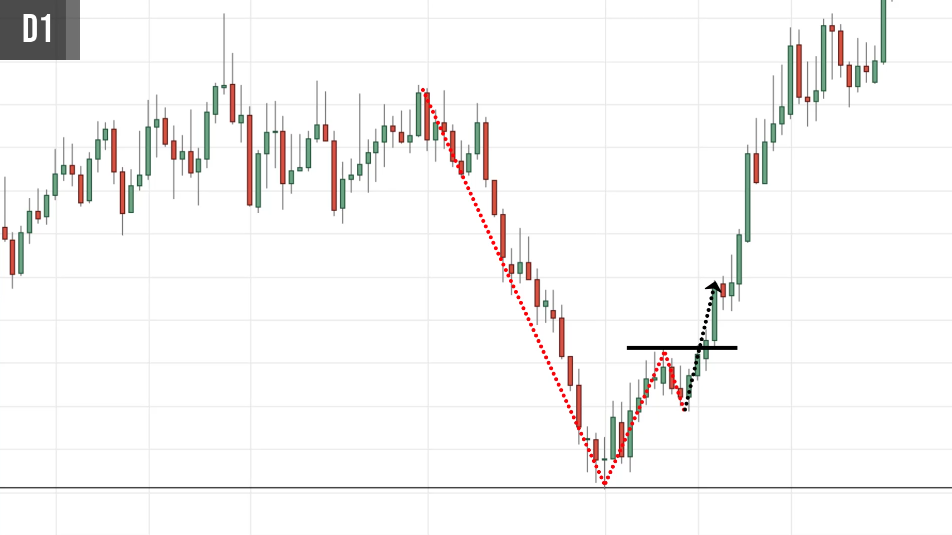
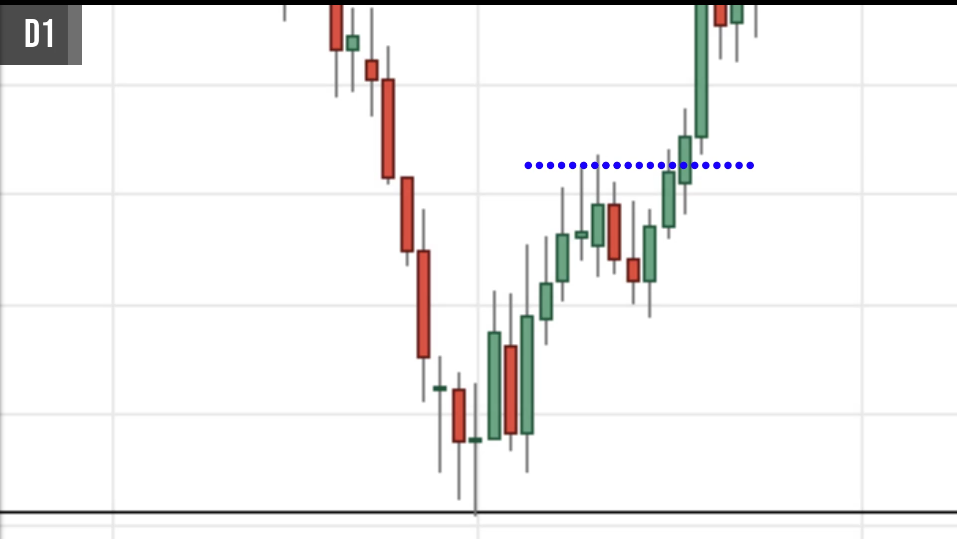
You can use multiple timeframe analysis and look for a break of structure.
Going down to a lower timeframe of a factor of 5 is the daily timeframe.
You're now looking for a break of structure.
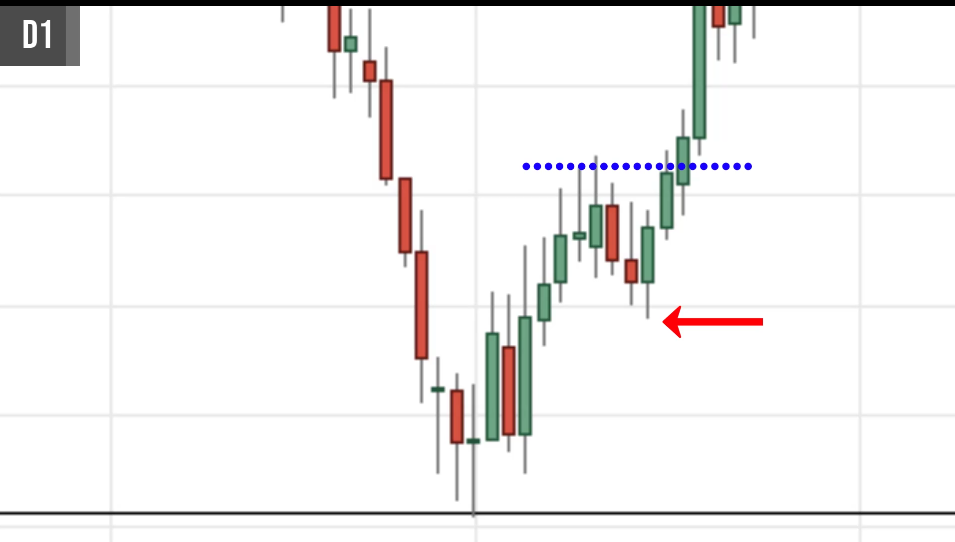
You can see that a price came down lower here, and went back and then pulls back. But the price breaks above this high.
What do you have over here? Higher high and higher low.
And on top of it, the weekly timeframe being your higher timeframe is in an overall uptrend.
Can you see the significance of this break of structure technique using multiple timeframe analysis?
You don't have to rely on candlestick patterns and price rejections.
If you understand multiple types of analysis, you can go down to a lower timeframe to better time your entry.
And also, on the weekly timeframe, most traders would set their stop loss 1 ATR below the lows:
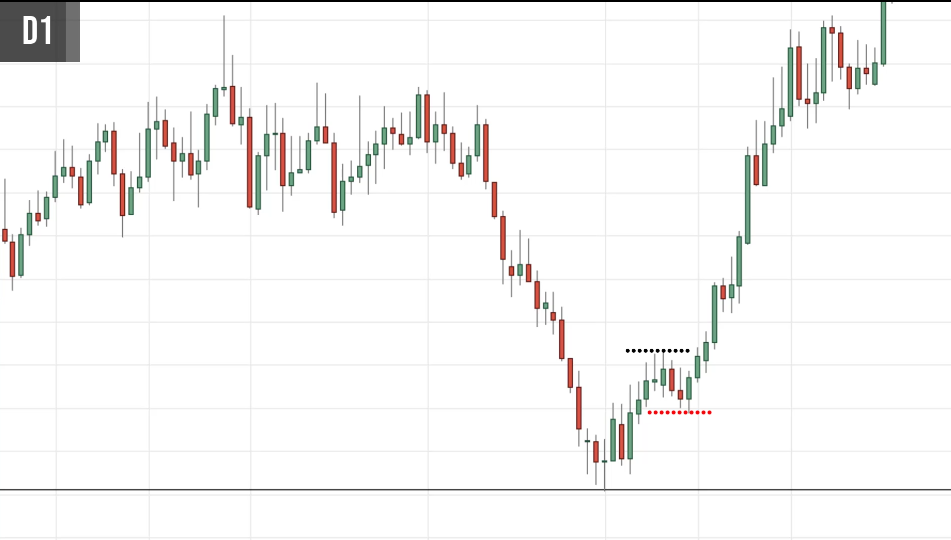
But if you understand multiple timeframe analysis, you can reduce the size of your stops because now your stop loss can be based on the market structure on the lower timeframe.
On a daily timeframe when the price broke above these highs.
You can reference this new swing low to set your stop loss.
A tighter stop loss offers you a more favourable risk to reward on your trade.
Let’s do a quick recap.
Recap
- Adopt a factor of 4-6 when using multiple timeframes
- Stacked levels increase the odds of a reversal
- Don’t buy when the price is overstretched
- Increase your win rate: trade the break of structure

