#13: Sniper Trading Entries To Profit In Bull & Bear Markets
Lesson 13
Hey, hey, what's up my friend?
In today's training, It's all about sniper trading entries.
So you'll discover 4 simple price action patterns you can use to better time your entries, predict market turning points and improve your overall trading results.
Let's get started.
Breakout with a buildup
This is an entry technique that helps you identify high probably break out trades.
Here are the things to look for:
- You want to have the market to be in a range for at least 80 candles or more
- Wait for the 20 MA to support the price before a breakout
I’ll explain…
1. You want to have the market to be in a range for at least 80 candles or more
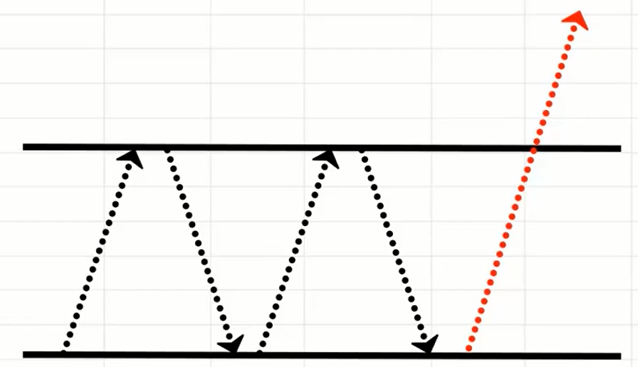
Based on my observations, the longer a market ranges, the harder it breaks. And the reason is quite simple.
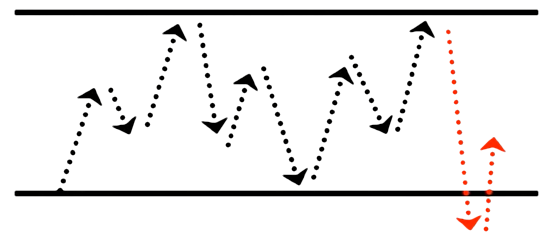
Because the longer a market is in a range, more resting orders will accumulate above the highs of resistance and below the lows of support.
Traders will look to buy low at support and sell high at resistance. Now, when you buy at the lows of support, where will you put your stop loss? Probably below the lows of support.
Now, if you’re long at support, then your stop loss is, in essence, a sell stop order. So the longer the market is in range, the more sell stop orders will accumulate at the lows of support.
And likewise, traders who are shorting near the highs at resistance will have their stop loss orders, which are in essence buy stop orders, above resistance.
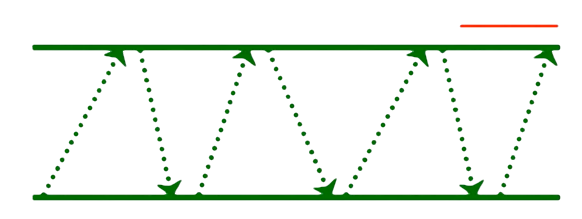
So when the price breaks out of this range, this cluster of stop orders will be hit.
Imagine that the price breaks out of resistance, it will hit a cluster of buy stop order that creates buying pressure to push the price up even higher.
This is why we want the market to be in range for at least 80 candles or more.
Now you don't have to get to too know anal about this. The market could be in range for 78 or 79 candles, it's fine. As a general guideline, use 80 candles.
2. Wait for the 20 MA to support the price before a breakout
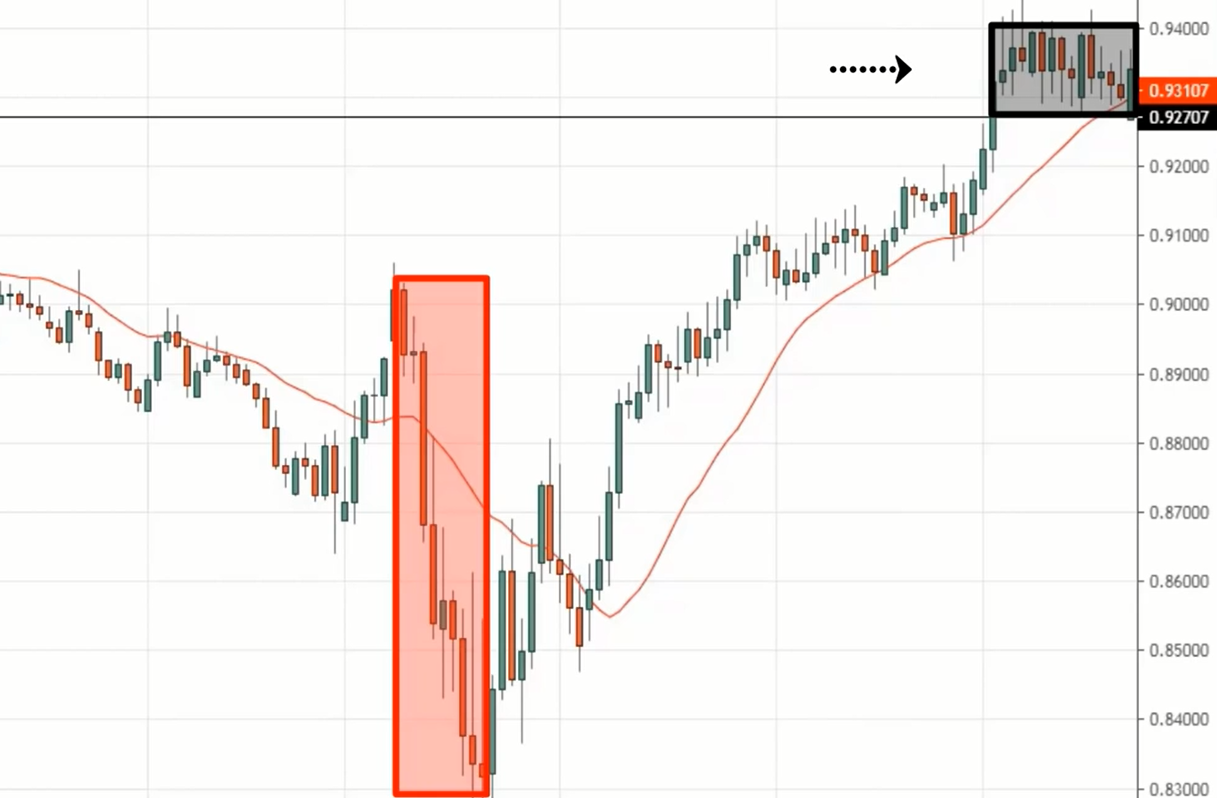
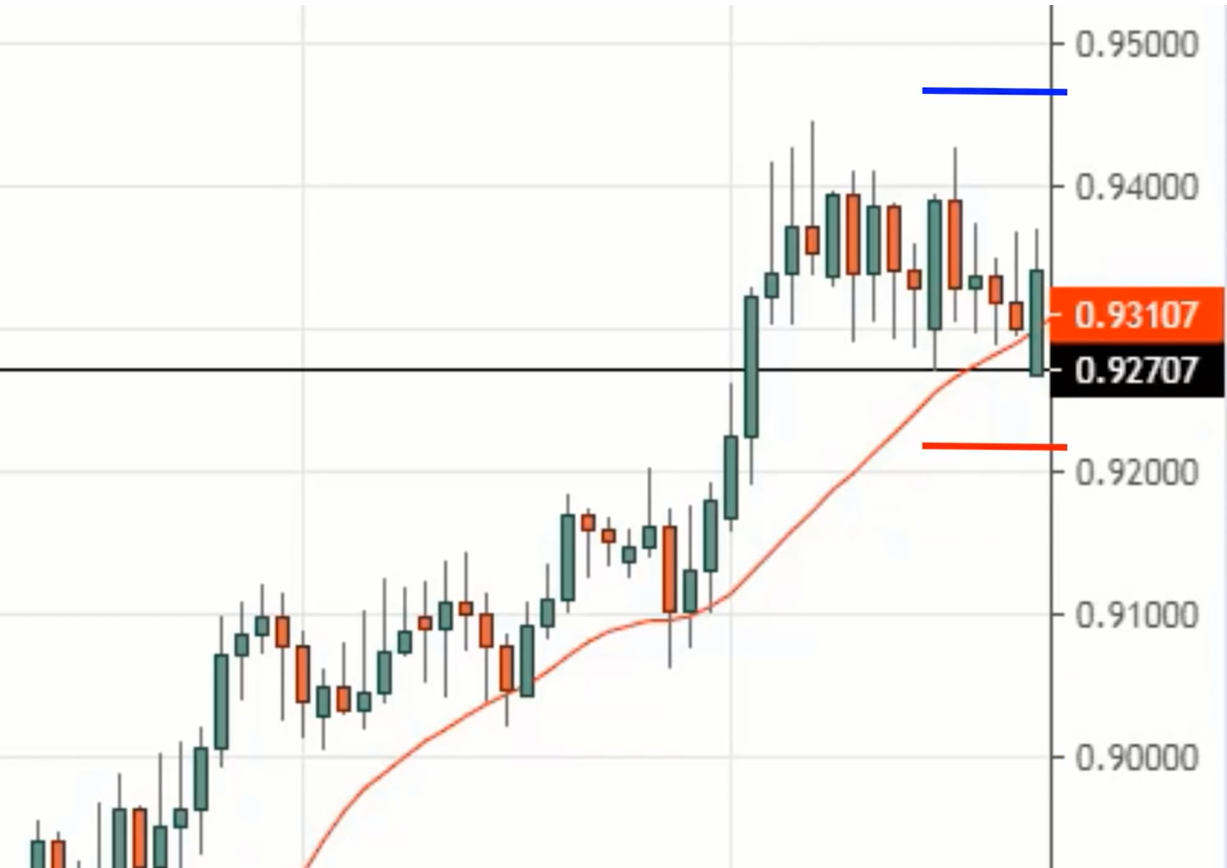
What you’re looking for is for the price to consolidate just before it breaks out like this:
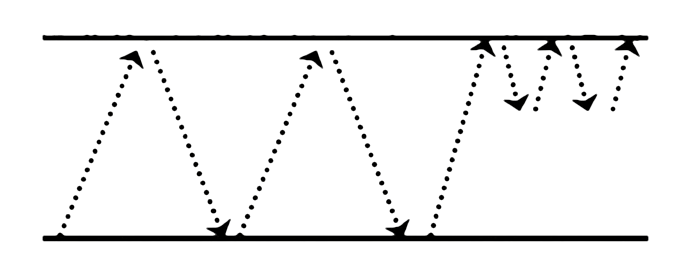
You’ll want this consolidation is for two reasons.
Number one, when it consolidates near the highs of resistance, this is a sign of strength. It tells you that buyers are willing to buy at these higher prices.
Number two, you have a logical place to set your stop loss because now your stop loss can just go below the lows of this buildup.
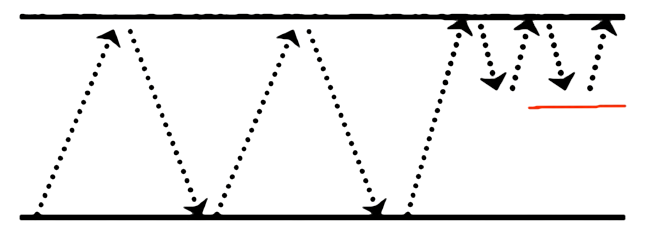
Compare that to a scenario where the consolidation didn't form, which looks something like this:
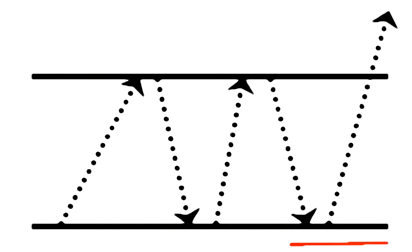
You can see that the nearest point where you can set your stop loss is below the lows of support and it's usually pretty darn far away.
But when you have a buildup that's being formed, it offers you a more favourable risk-to-reward on your trades.
Let me share with you a few examples about the breakout with buildup.
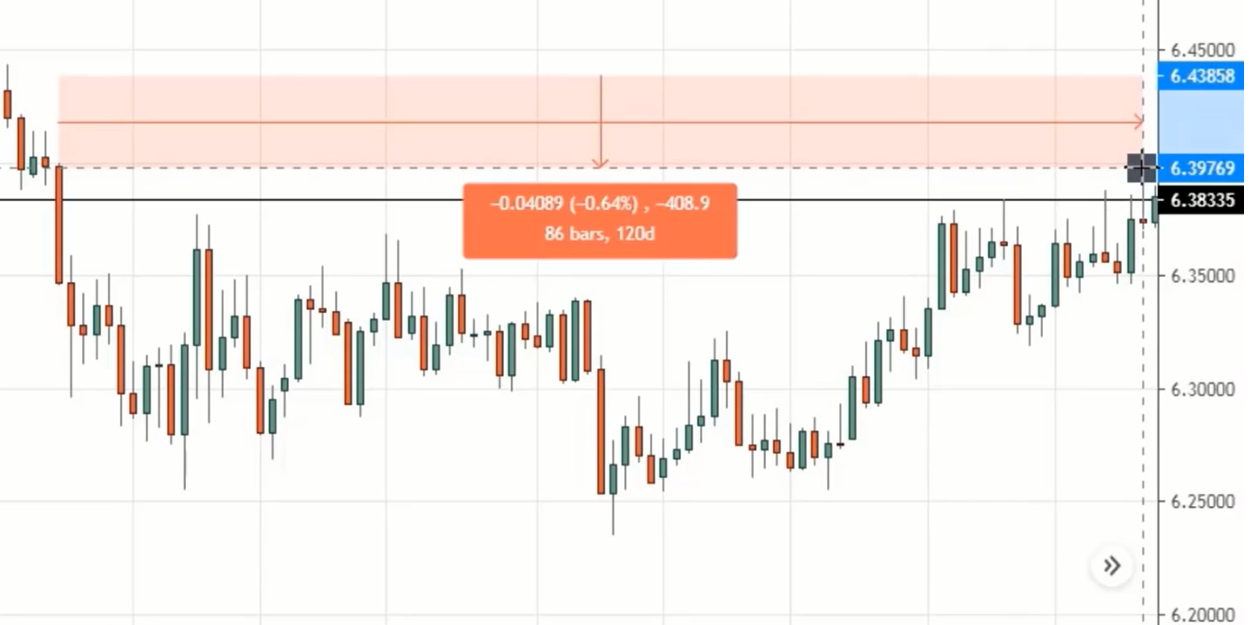
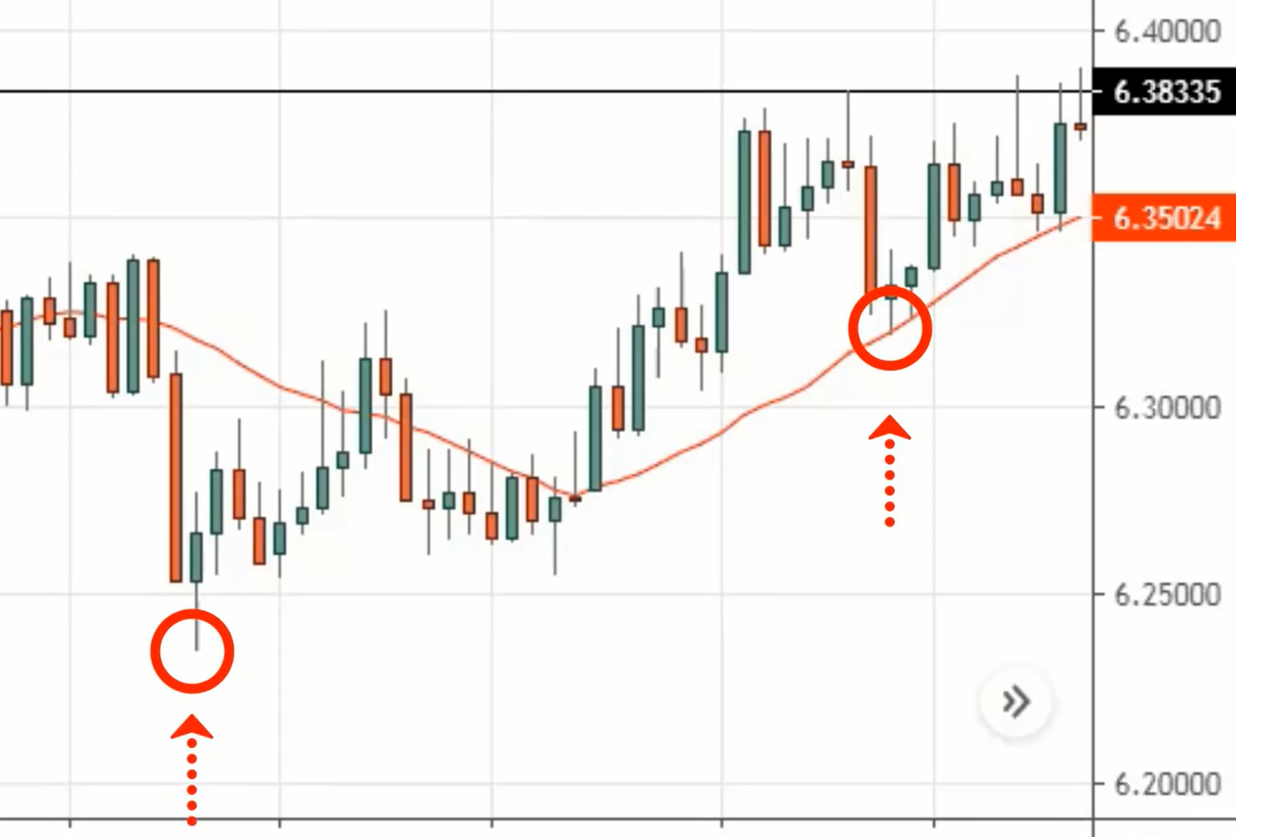
Example #1 (buildup before resistance in USD/CNH):
Remember, the first thing you want to see is at least 80 candles formed from the start of the range to the end of the range.
And like I've said, 80 is just a general guideline. If you have 75, 77, 78.69, etc., it's fine as well.
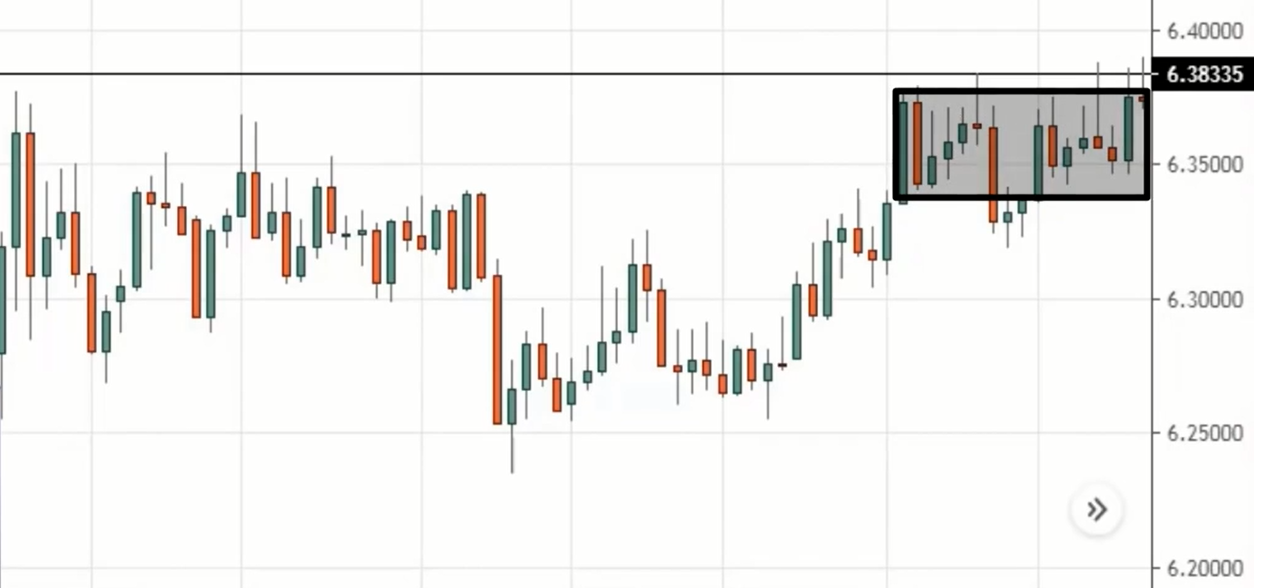
The second thing to look for is a breakout with a buildup.
The key thing to note is that you want the 20 MA to catch up with the low of the buildup to signal to you that the market is getting ready to make a move.
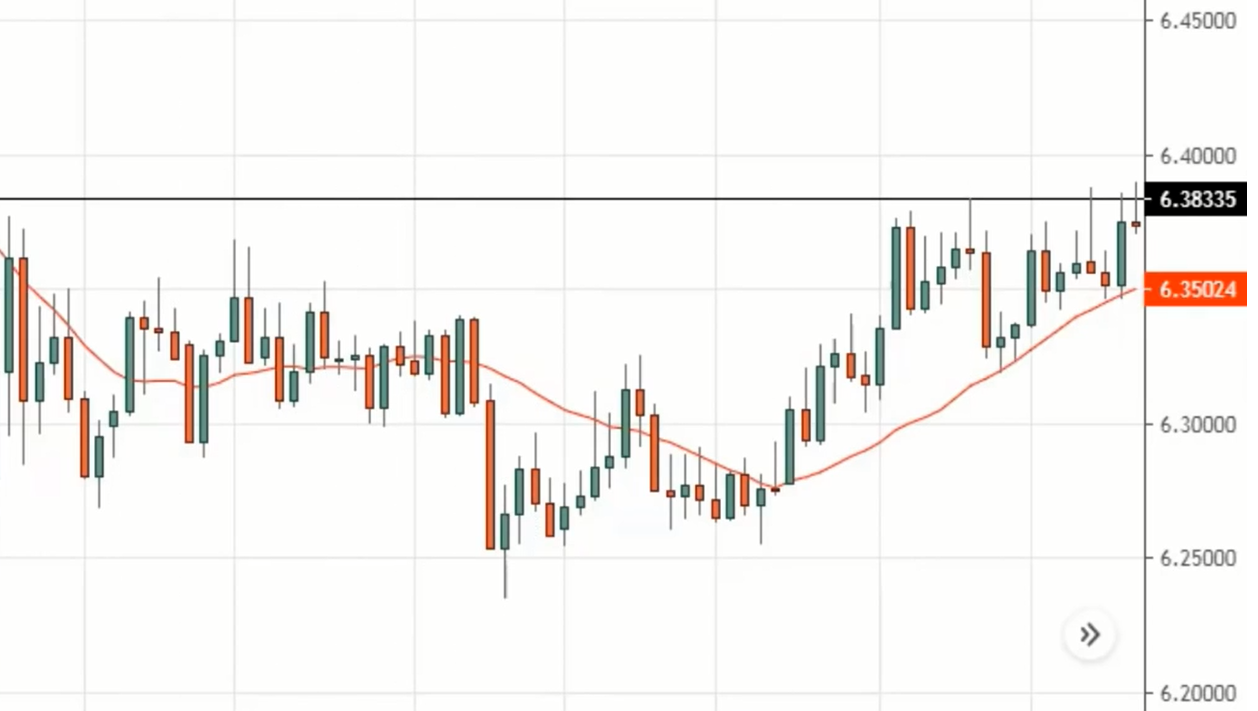
Now some of you might be asking, “Oh Rayner, should I use the 20 EMA, the SMA or the WMA?” Honestly, it doesn't matter. The concept is what matters.
Whether you use the EMA, SMA, or WMA, it’s not gonna be much of a difference.
In this case, over here, I’m using an EMA. You can see over here that the 20 MA has caught up with the lows of the buildup.
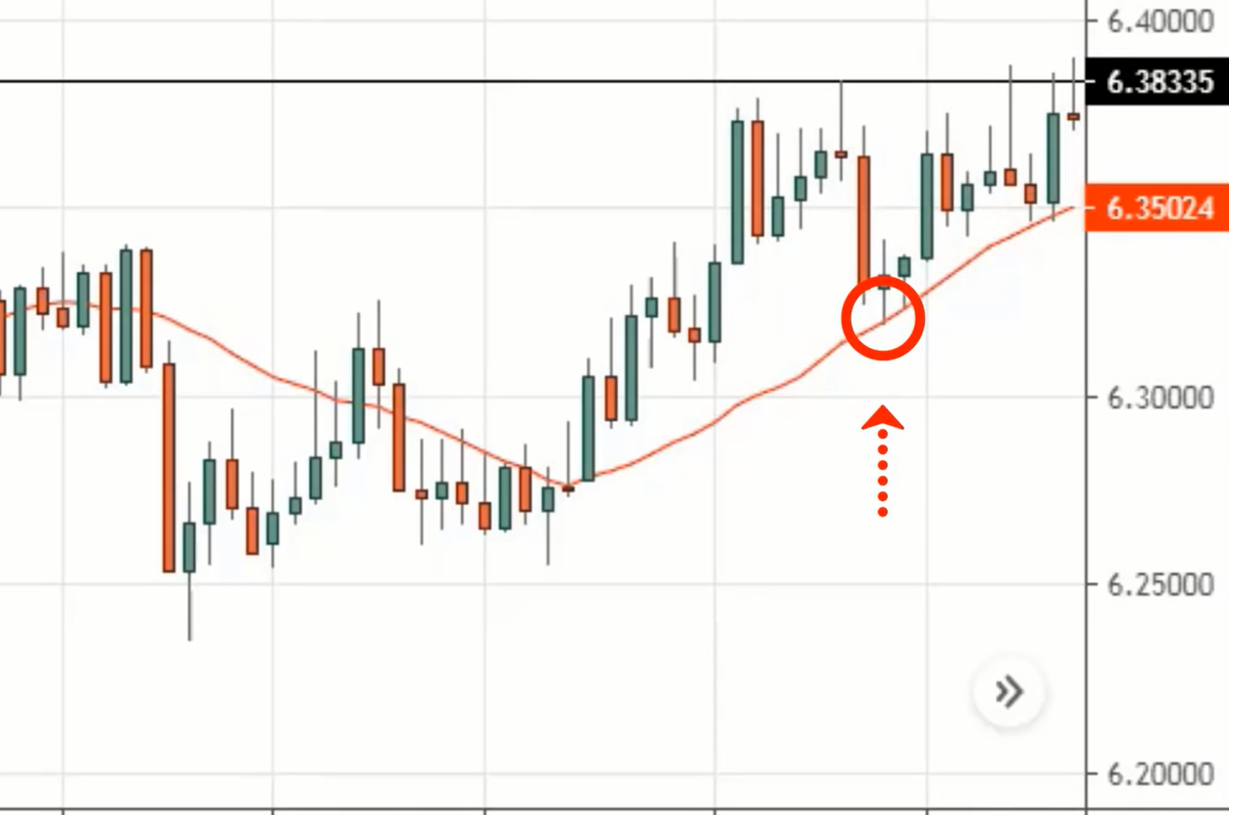
This tells you that the market is ready to make a move. What you can do is simply to place a buy stop order above these highs and your stop loss below the swing low of the buildup.
Without this buildup your stop loss will likely be referencing from the lows at 6.25 over here:
It’s a very wide stop loss that doesn't offer a good risk-to-reward on your trade.
So this is what a breakout with a buildup looks like.
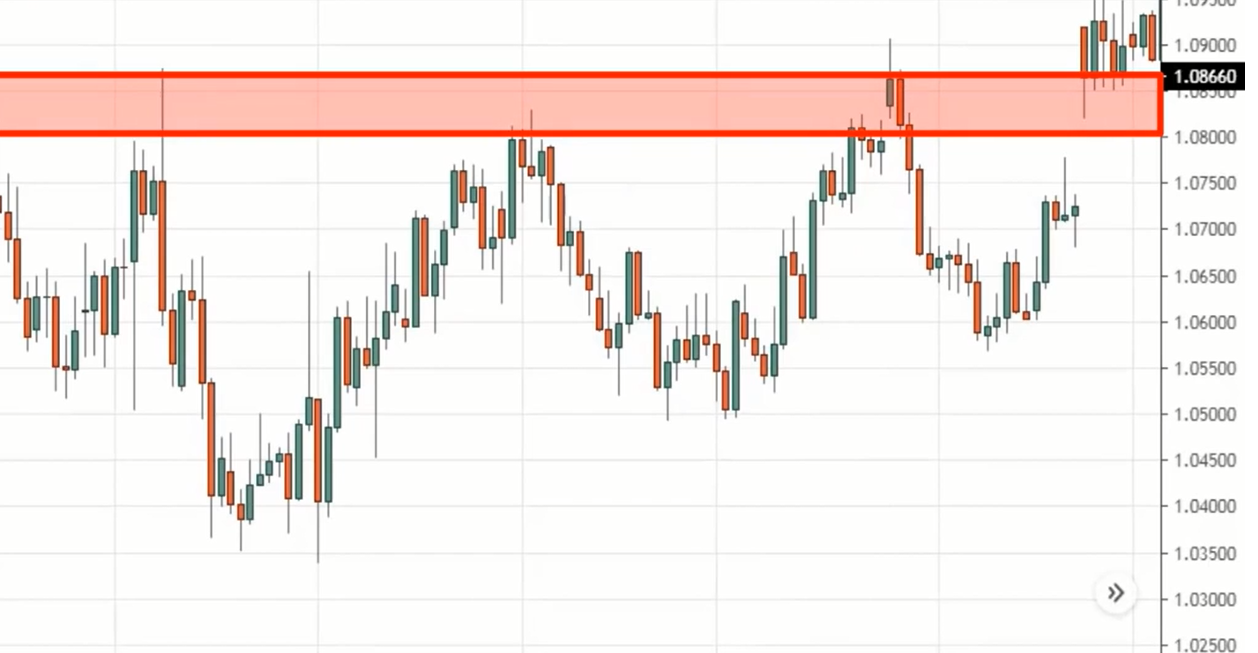
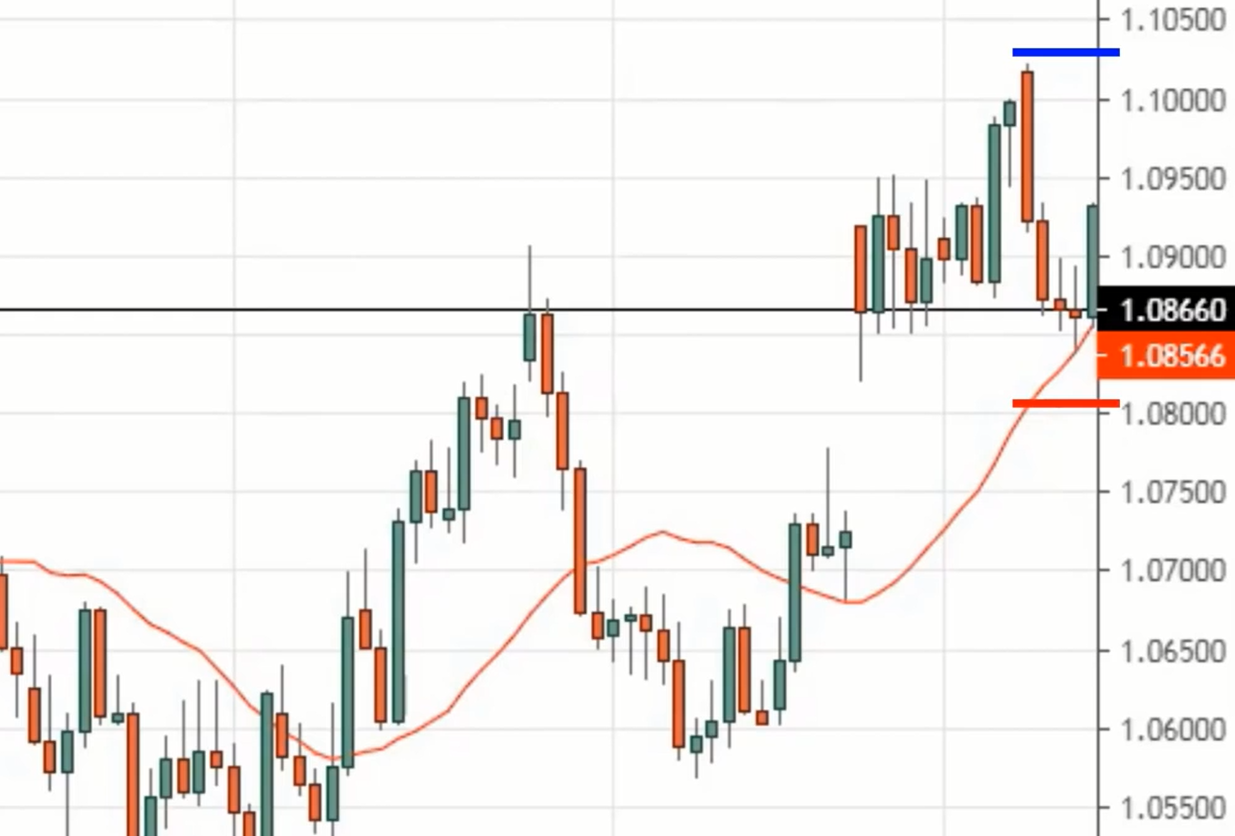
Example #2 (buildup after resistance in EUR/USD):
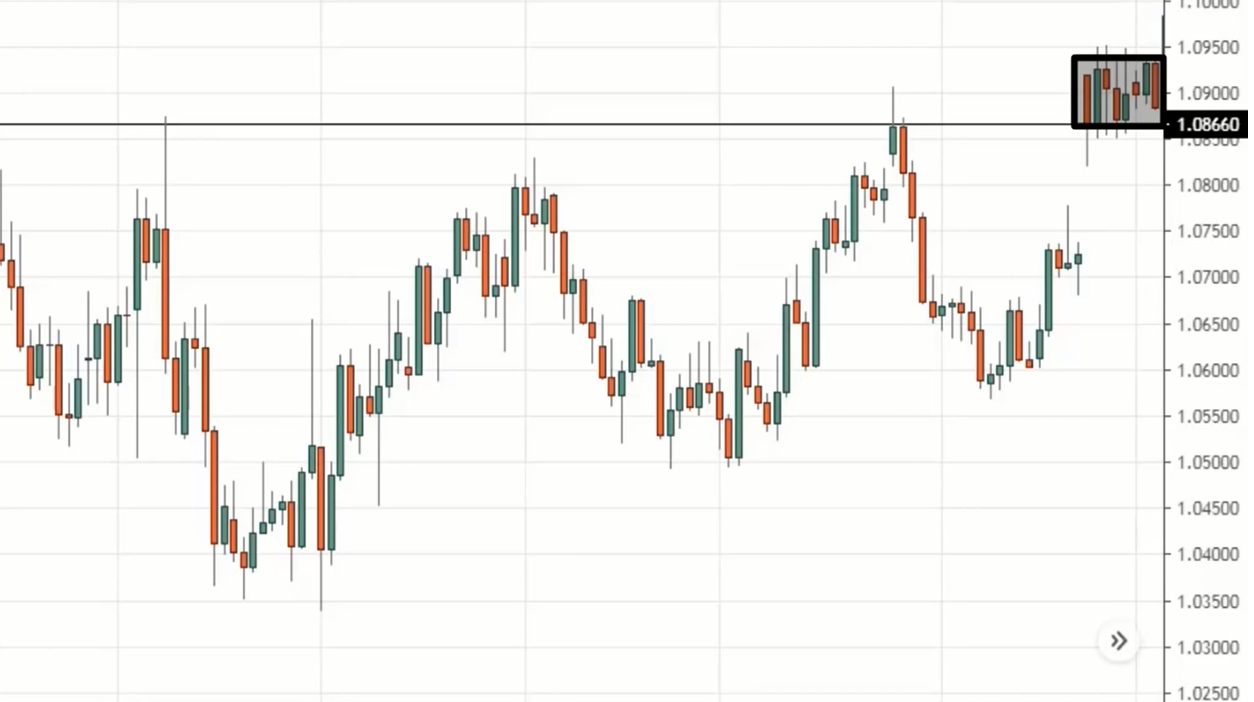
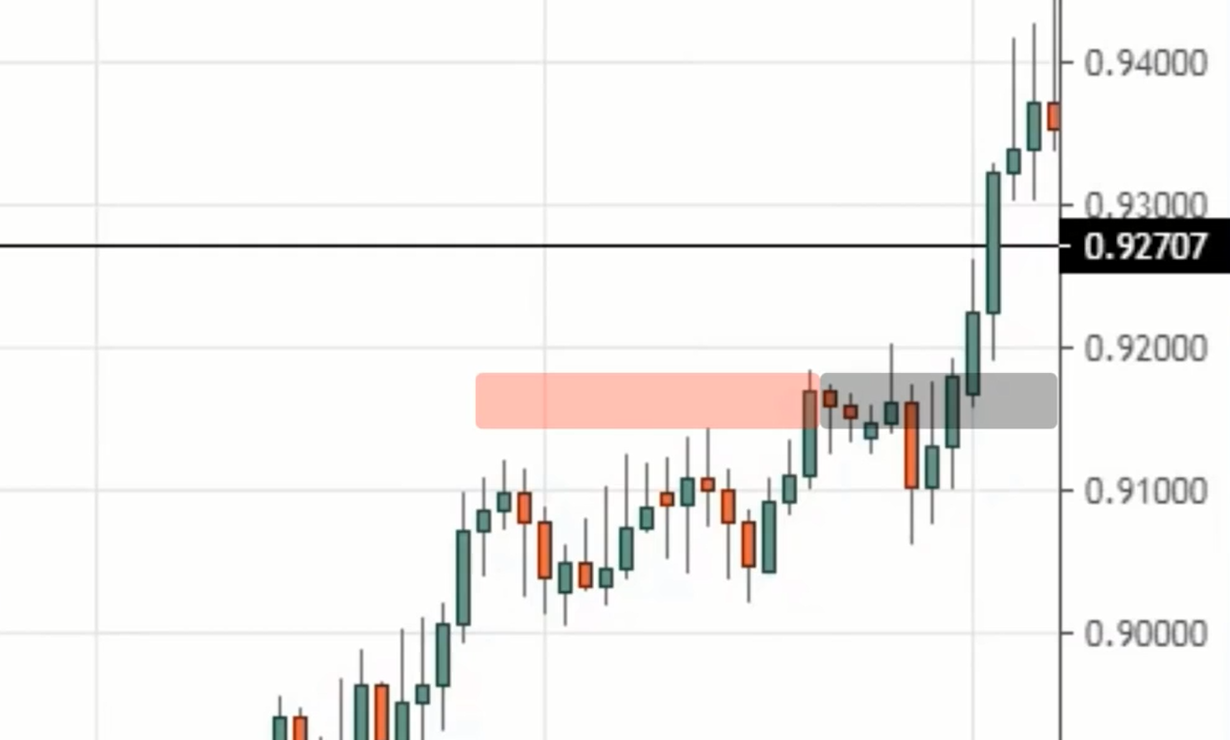
This time around, the buildup forms after the price has gapped above the area of resistance.
Here's the thing about technical analysis, as much as I want to share with you textbook examples, or cherry-picked examples, but when you are trading the live markets, it's very important to understand the concepts that I'm teaching instead.
Because the variations that are going to unfold for your market and your timeframe will be different. It's not going to be exactly perfect.
This is why it's important to understand the concept and so that you can handle the variations that the market throws at you.
In this case, you can see that the market broke out of resistance and forms a buildup just above the highs of resistance.
Logically, the market could head lower and it's anyone's guess, but the fact that it can still consolidate at the highs of resistance without breaking down lower, is a sign of strength as buyers are still willing to buy at these higher prices.
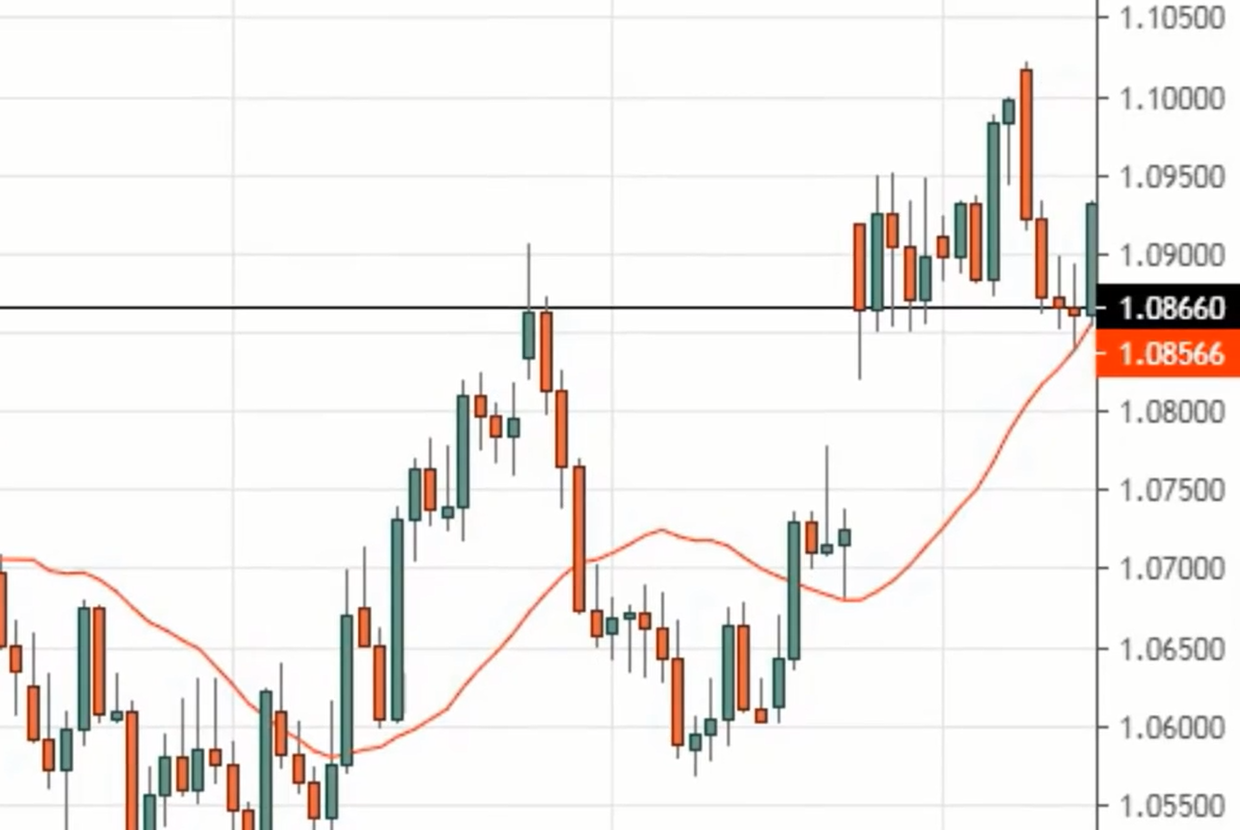
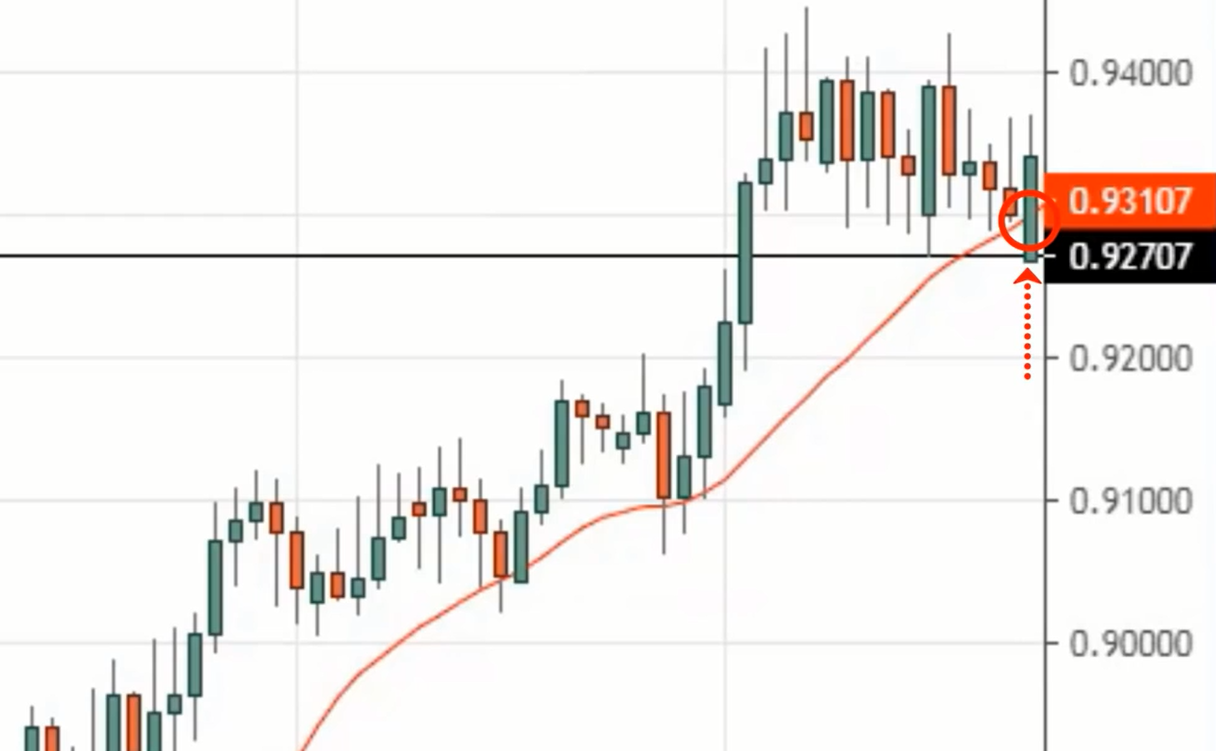
So again, you want to make sure that the buildup formed is long enough. Pull out the 20 MA and make sure that the 20 MA has caught up with the lows of the buildup.
The 20 MA touched the lows of this buildup and the price starts to bounce up higher.
At this point you could place a buy stop order above this high with stop loss below the buildup:
So this is another variation to trading the breakout with a buildup.
Another example…
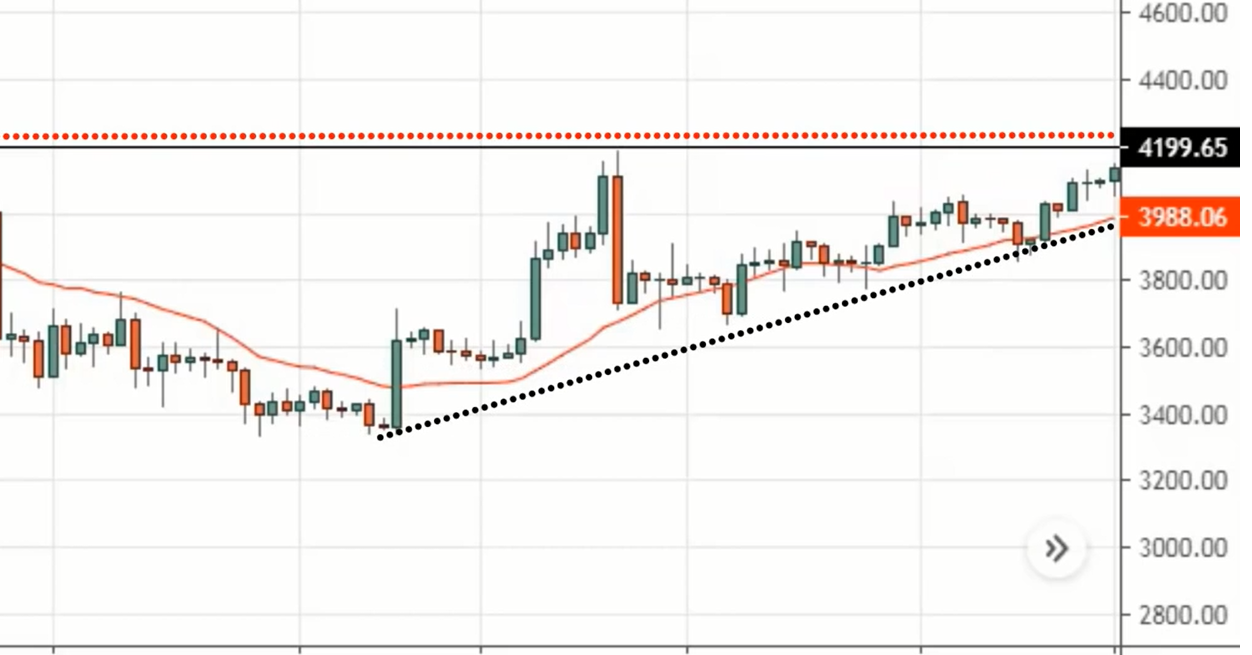
Example #3 (ascending triangle in BTC/USD):
Similarly, look for a range of at least 80 candles and wait for a buildup to form at resistance.
Then let the 20 MA catch up with the lows of the buildup.
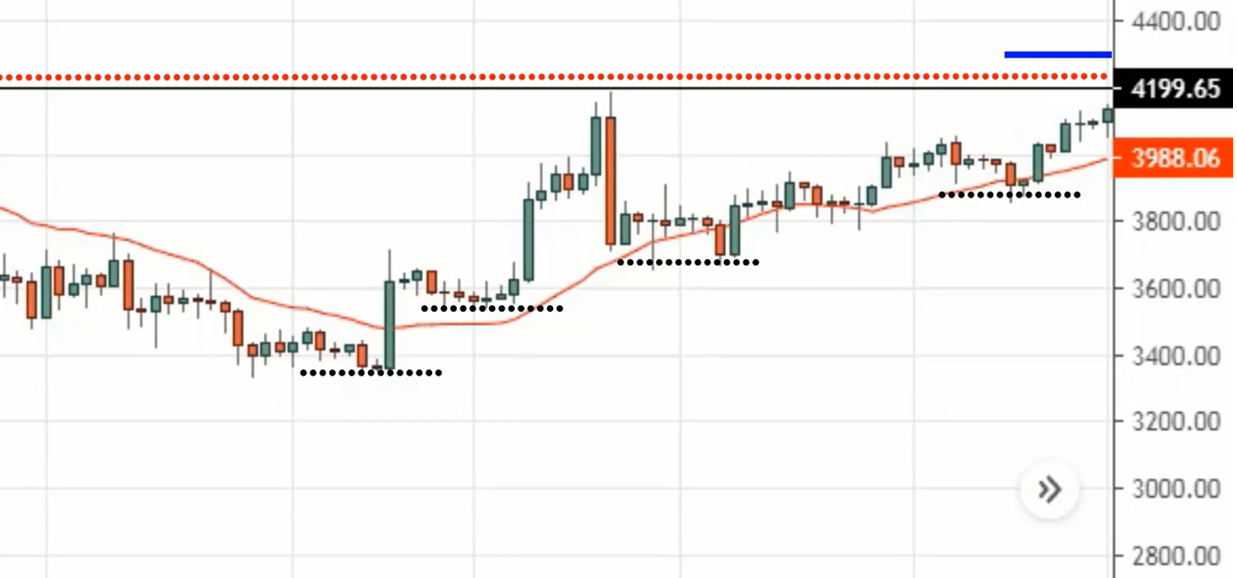
In this case, you can see the price formed a series of higher lows into resistance and the 20 MA has caught up with the lows of the ascending triangle here.
This is another sign of strength as buyers are willing to buy at higher prices.
That's why you have a series of higher lows into resistance.
Now, where can you enter the trade? You can set your buy stop order just above the highs of resistance somewhere here:
And you can reference from this swing low to set your stop loss, maybe somewhere around here:
Because you have this higher low that you can reference from to set your stop loss.
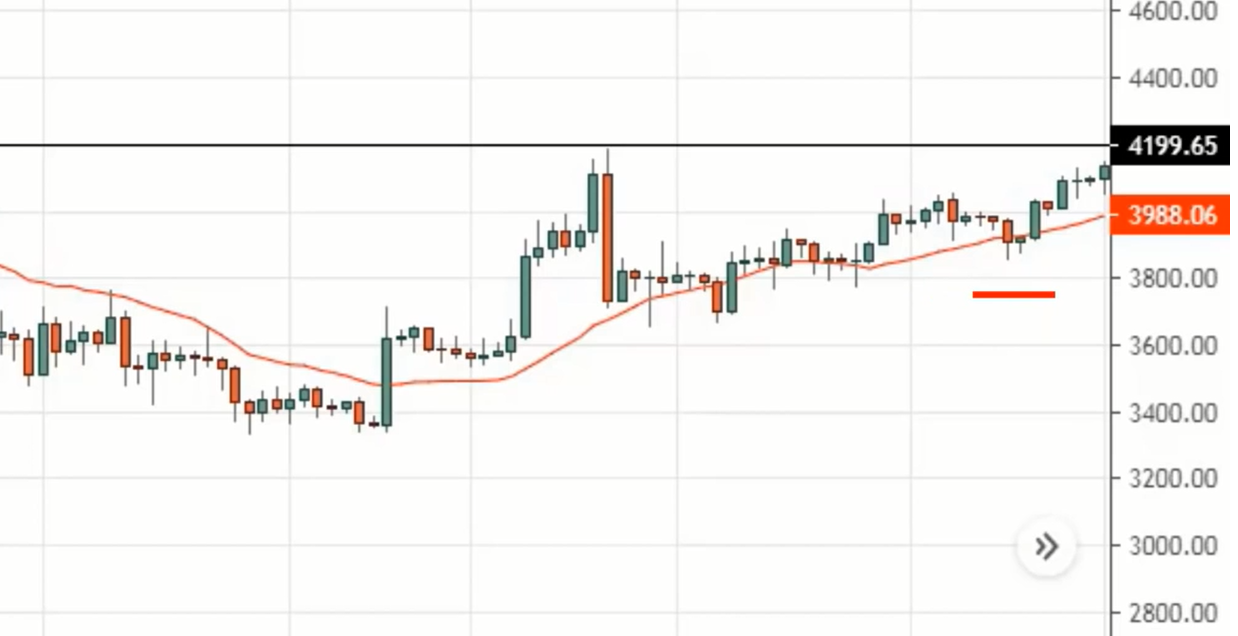
This is what I mean by a breakout with a buildup. And the opposite of that would be a breakout without any buildup like this:
This is the type of breakout that I avoid because there's simply no logical place to set your stop loss.
Moving on…
First pullback
Here's the thing…
Sometimes when you’re trading the breakout with a buildup, you might miss the move as the market didn’t form any buildup it simply just breaks out of resistance.
This is where you want to pay attention to the first pullback. Because whenever the market breaks out, there’s a high probability that it's going to make a pullback as it needs to breather.
The good thing about the first pullback is it allows you to catch a trend, even if you missed the first wave of the move.
Here are the things you want to look out for:
- Breakout of resistance
- A weak pullback (with small-ranged candles)
- 20 MA has caught up with the price
Let me share with you a few examples of the first pullback.
Example #1 (Gold):
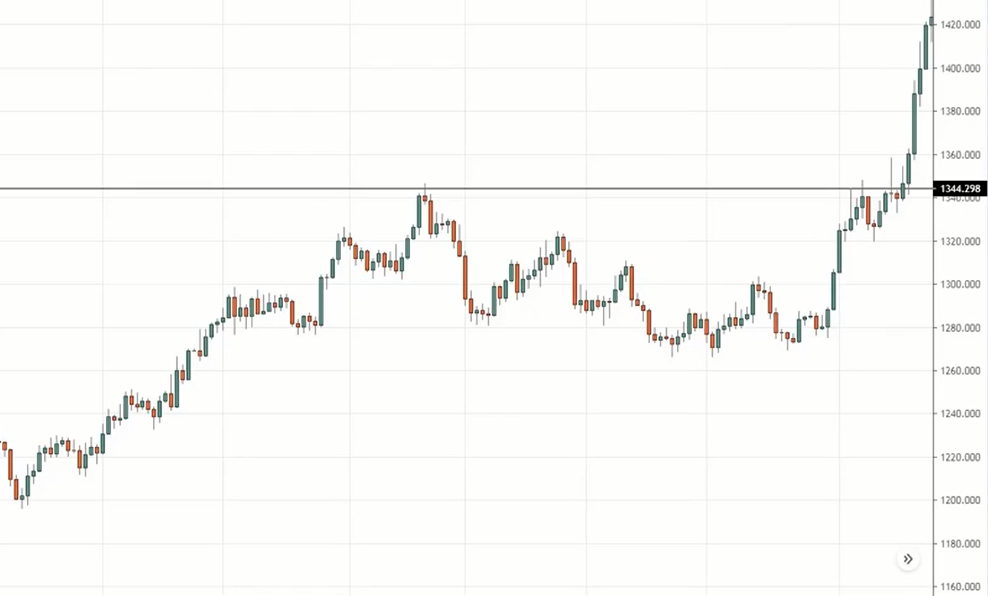
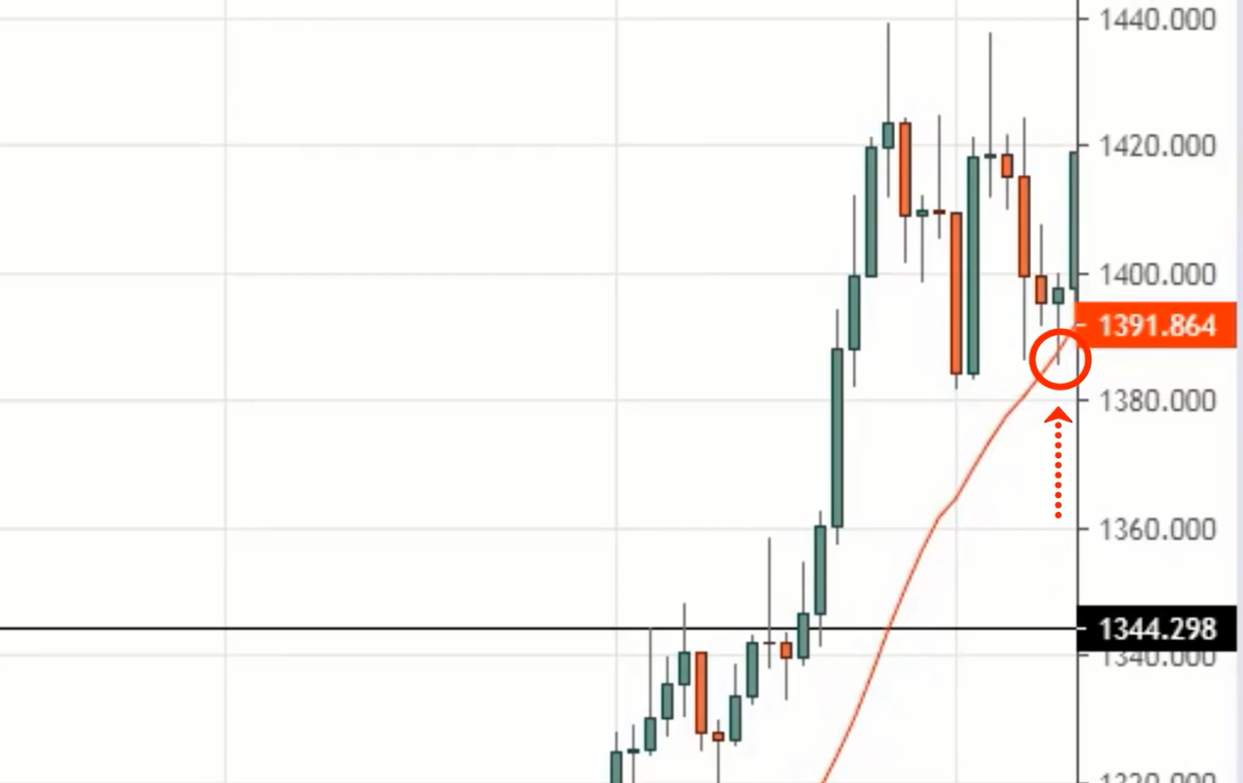
If you look at gold over here, you can see that the price has broken out higher.And a mistake that many new traders make is that they chase the breakout because the candles look so bullish, thinking the market is going to the moon, it's time to buy.
Well, that's me when I started trading 10 years ago.
But no, you don't want to be buying at this point. Remember, I mentioned that if you were to chase breakout or buy breakout without a buildup, there’s no logical place to set your stop loss.
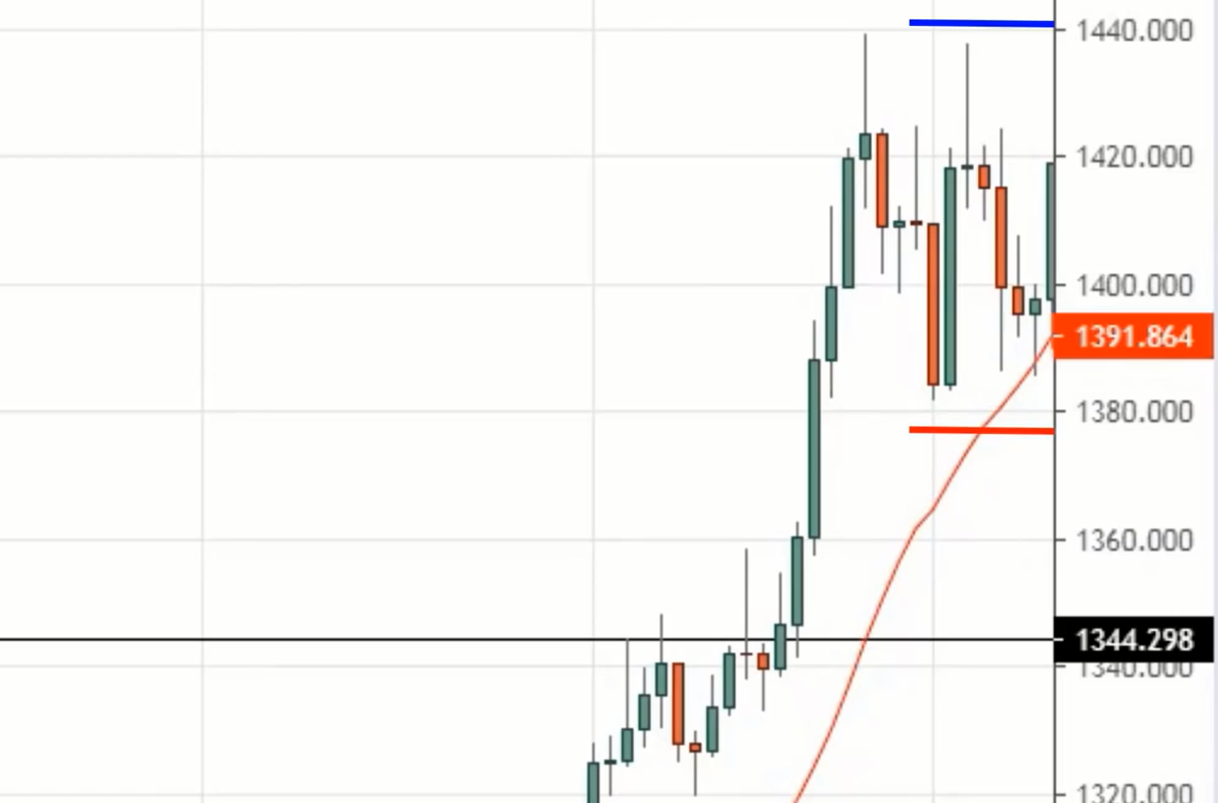
If you look at this price structure, the nearest price structure is possibly the previous resistance that could become support.Your stop loss might be somewhere about here, which is pretty darn large.
Remember, I said that if the price breaks out and you missed the move, don't worry. Wait for the first pullback.
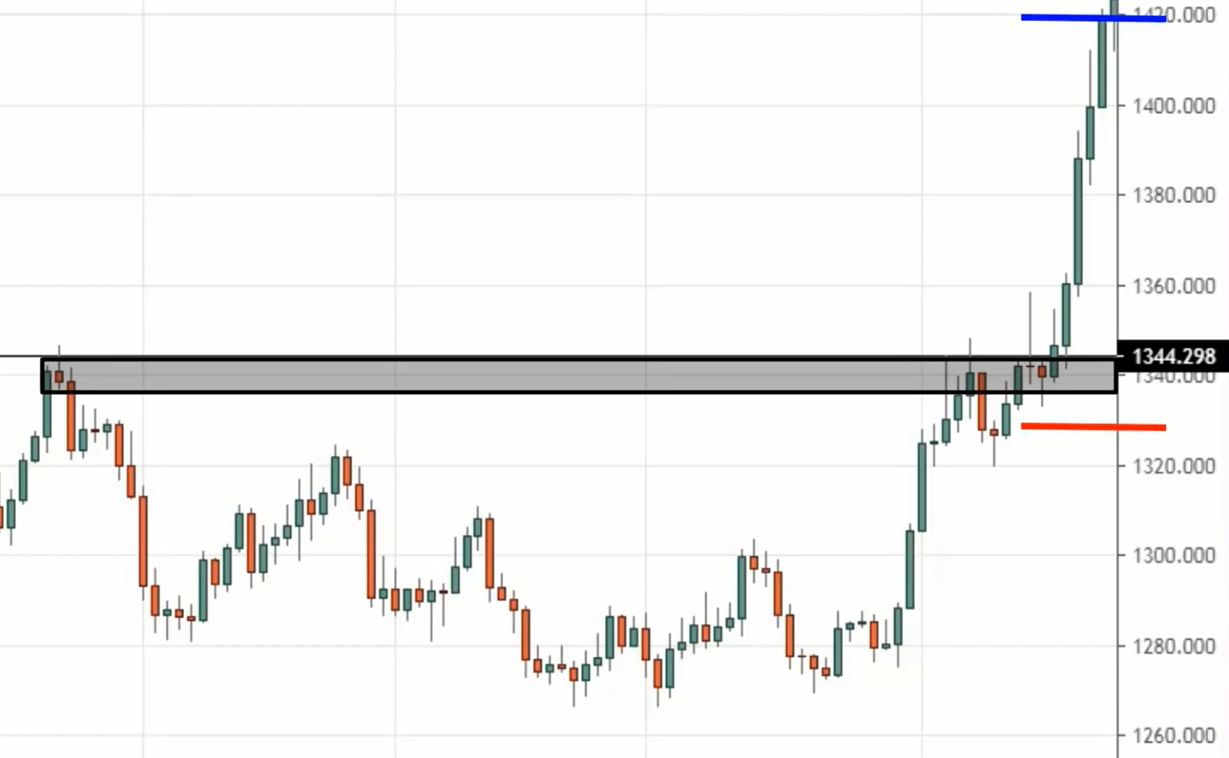
So what you want to look for is for the price to retrace with small-bodied candles and let the 20 MA be your guide.
Because here's the thing, when the price pulls back, like at this point, you'll be wondering, “Man, is it time to enter the trade?”
This is where the 20 MA comes in useful.
Let the 20 MA catch up with the price first. If the 20MA is still a distance away from the price, then give it some time, perhaps a few days for the 20 MA to catch up with the price.
When the 20 MA has caught up with the lows of the buildup, that’s when you're ready to place an order to enter this market.
So your buy stop order can just go above the highs and a logical stop loss can be below this swing low over here:
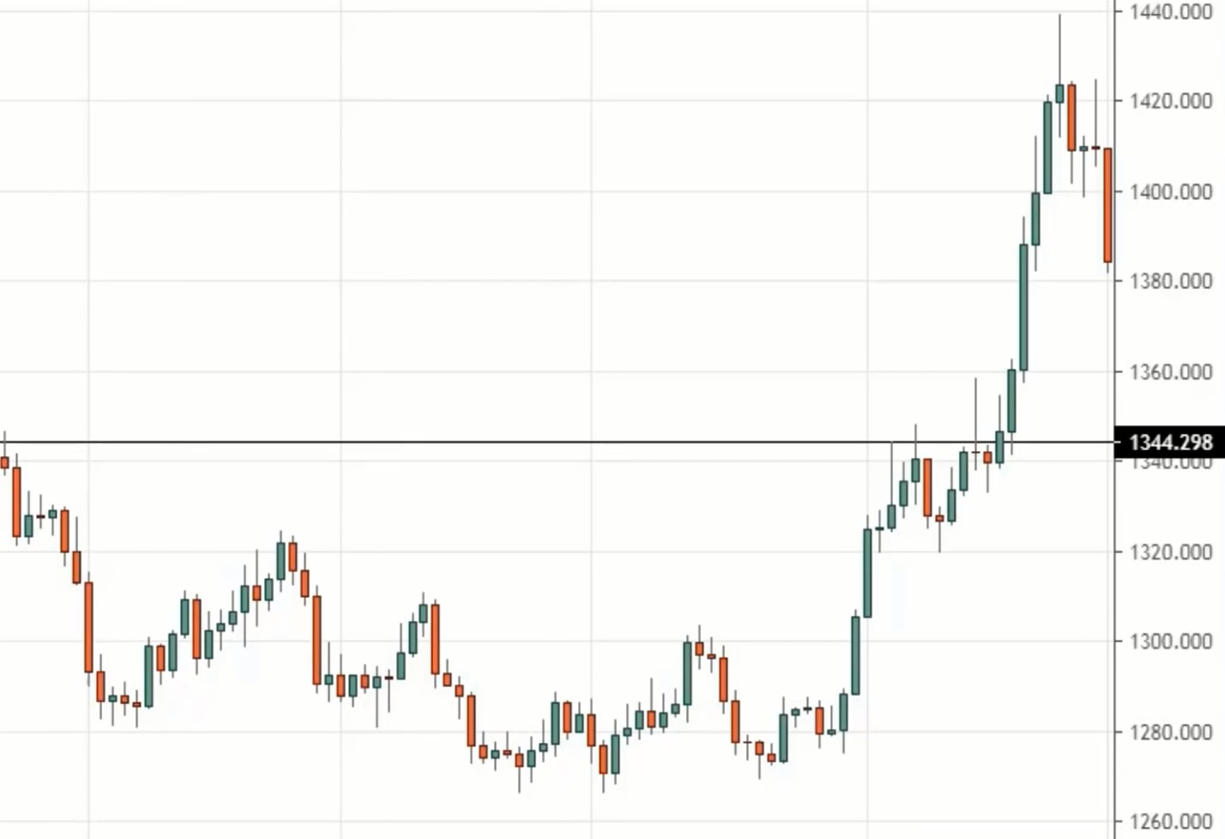
Can you see a difference between chasing the markets and waiting for the market to come to you?
This is what I mean by the first pullback. So even if you've missed the first move, don't worry. Opportunities can still come around.
Example #2 (AUD/CAD):
I'm going to walk you through the psychology of traders who are looking at this market.
You can see that as price broke out, what traders will do is that they wait for a pullback, possibly at the previous resistance that could turn into support.
Sometimes the market does retest that, while sometimes it doesn't.
Now, remember the first pullback? What you're looking for is a weak pullback, with small-ranged candles and let the 20 MA touch the lows of the pullback.
Great, the 20 MA has touched the lows of the pullback, and if you look at the range of these candles, it's very nice and tight. That's good.
Because it tells you that there isn't any strong selling pressure controlling the market to push the price lower.
Compare those small-ranged candles with these huge bearish candles over here (on the left):
Clearly, the one on the left has huge selling pressure, but for the buildup on the left, the buyers and sellers are in equilibrium. No one's in control.
You want to see this type of price action where the range of candles are small and the 20 MA has caught up with the price.
You can just go with a buy stop order above the highs and stop loss can be 1 ATR below the low.
And that's how you trade the first pullback. Make sense?
Next…
False break
This is simply a reversal price pattern, to profit from losing traders. I'll explain more on that later.
Here’s what you're looking for in a long setup:
- A strong move into support (or resistance, depending on your trade direction)
- Strong move into support
- Price to trade below the lows of support and close bullishly above it
(And it’s just the opposite for short trades.)
You can see that there’s a false breakout of the lows.
Example #1 (GBP/CAD):
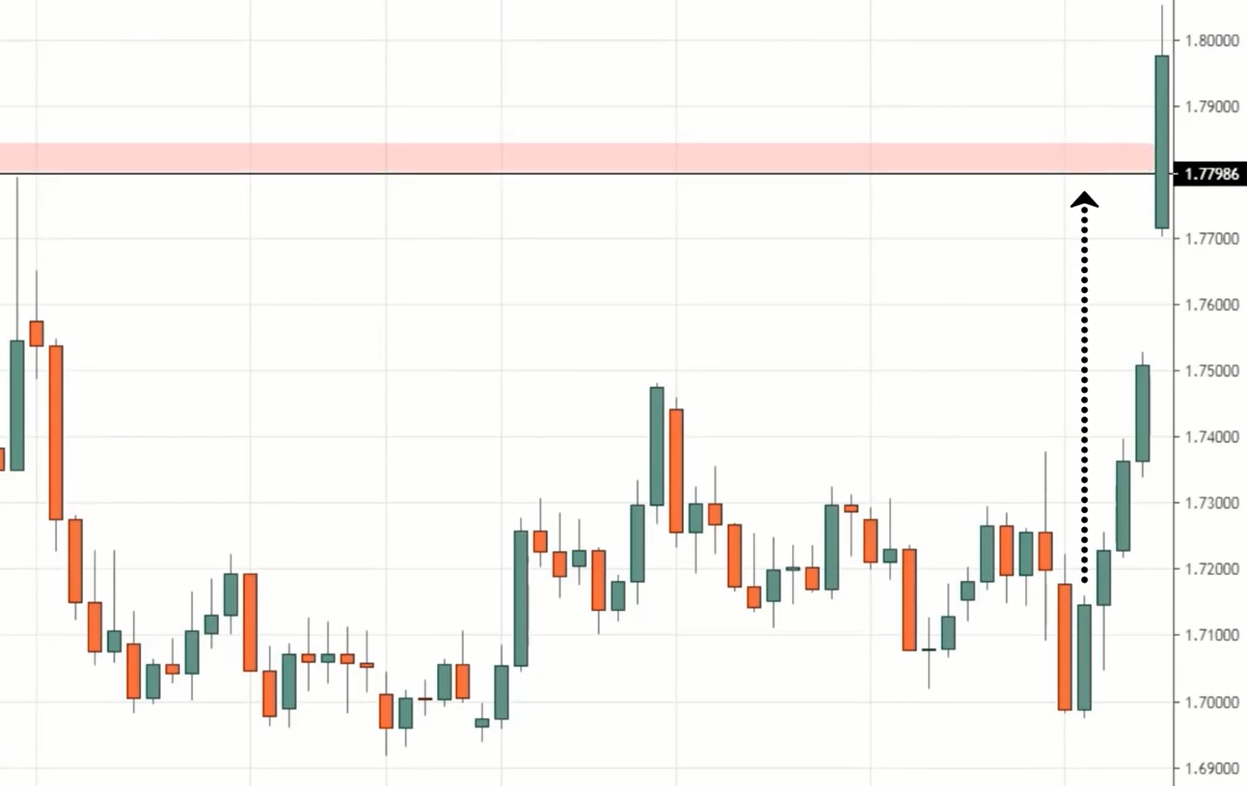
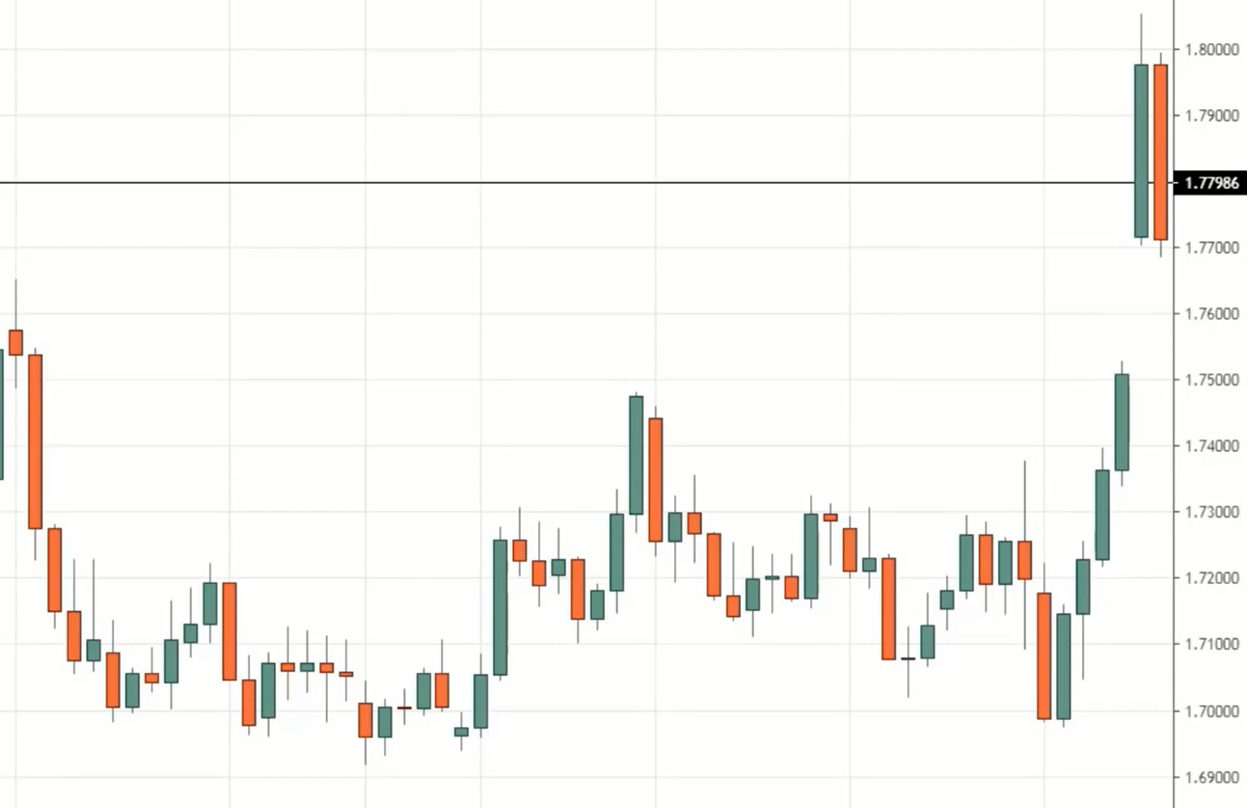
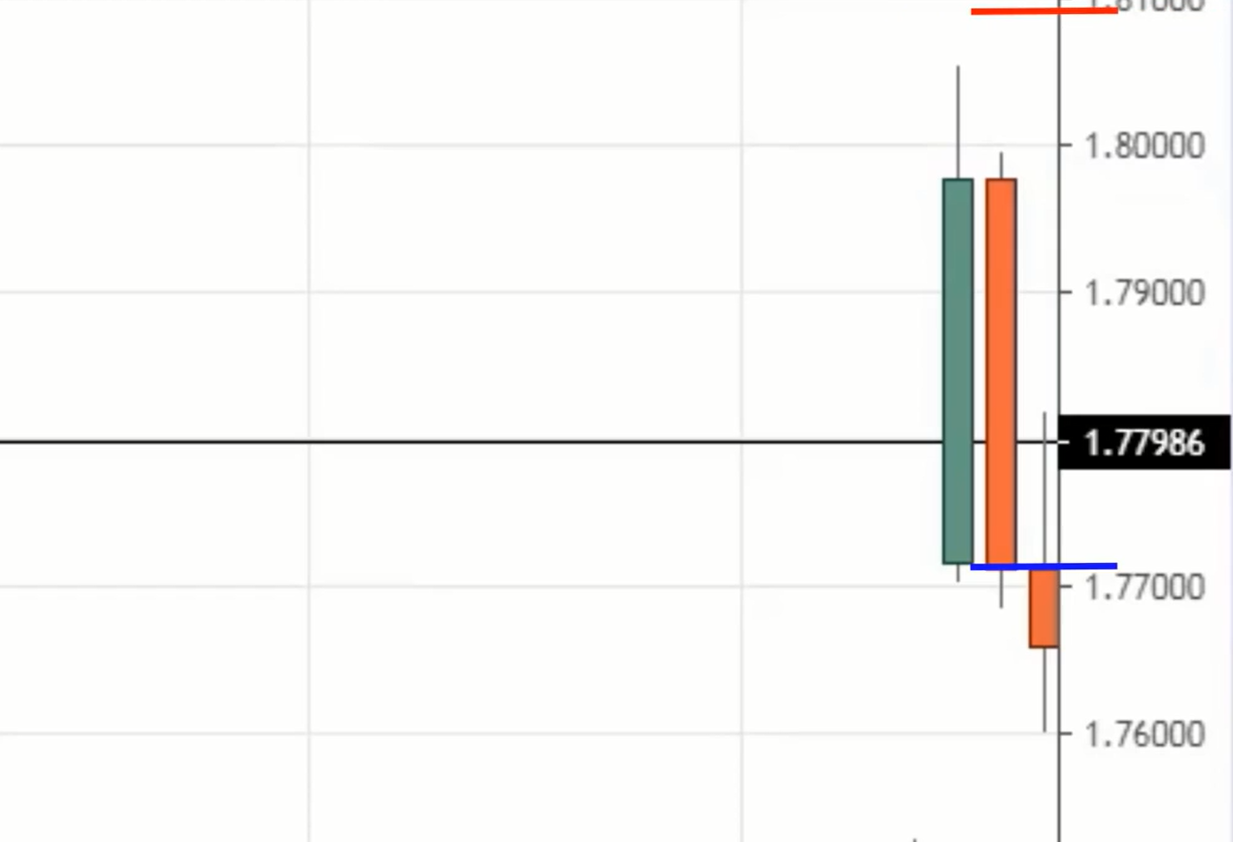
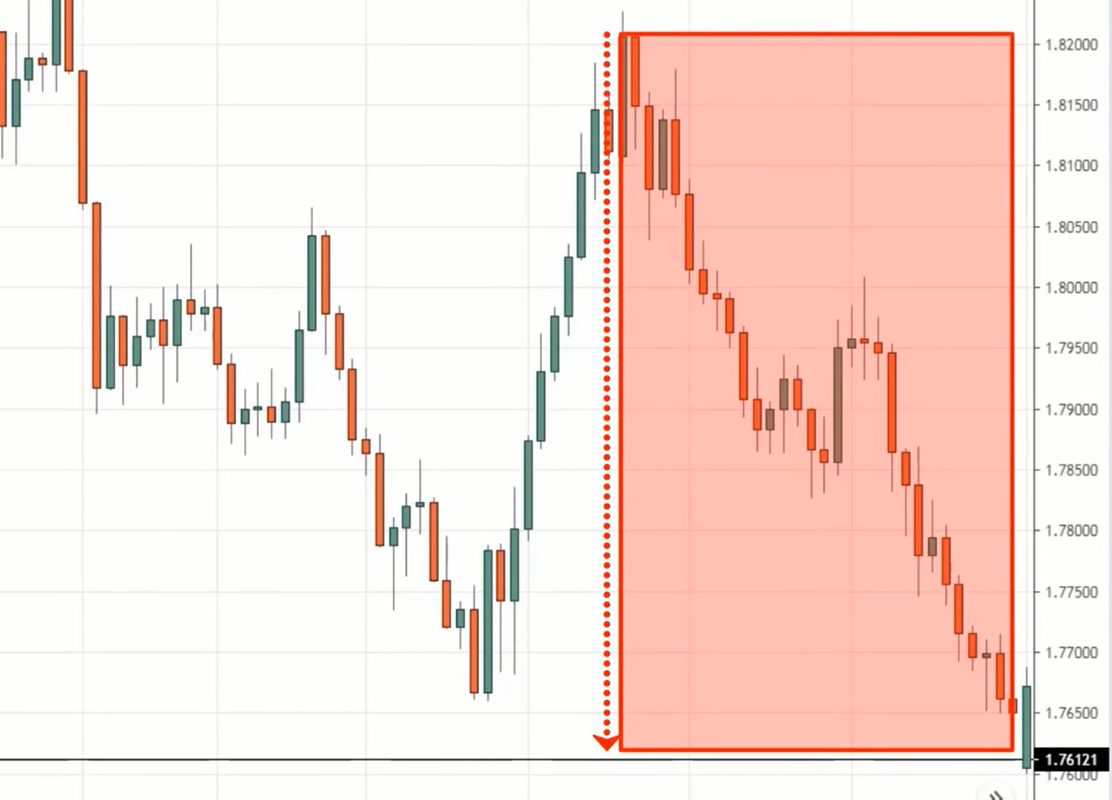
Price made a strong bullish move into resistance and broke out. You can see how bullish the move is.
But on the next candle, we have a sudden reversal:
I mentioned that the false break is a reversal pattern to profit from losing traders. But who were the losing traders?
The losing traders are those traders who bought at the highs of the breakout.
When the price broke above the highs of the resistance, do you want to be buying? Recall earlier, we talked about buying the breakout with a buildup.
But there was no buildup formed here before it broke out. And instead, the price made a strong bullish parabolic move into the area of resistance and then suddenly reversed lower.
Those traders who bought the breakout of the highs are now in the red because the market made a 180-degree reversal against them.
This is why I say don't chase breakout. Don't buy breakout without a buildup. This could happen to you.
Now, how should you trade this? It’s very simple. On the next candle’s open, you can go short with stop loss above the highs.
This is, in essence, a false breakout or a false break.
Example #2 (AUD/NZD):
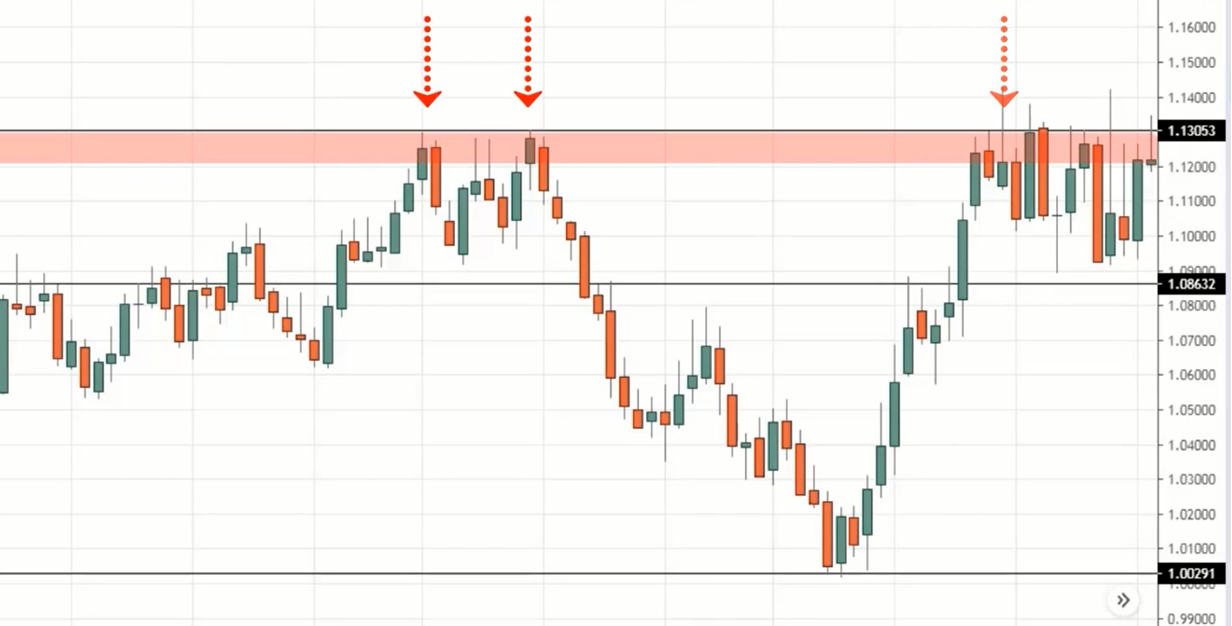
The concept is the same over here, but there’s something interesting I want to share with you.
At the rightmost red arrow, the price got rejected at the highs of resistance.
But as much as this may be a setup that you could trade, I want you to know that trading isn’t that straightforward, you don’t get profits straightaway.
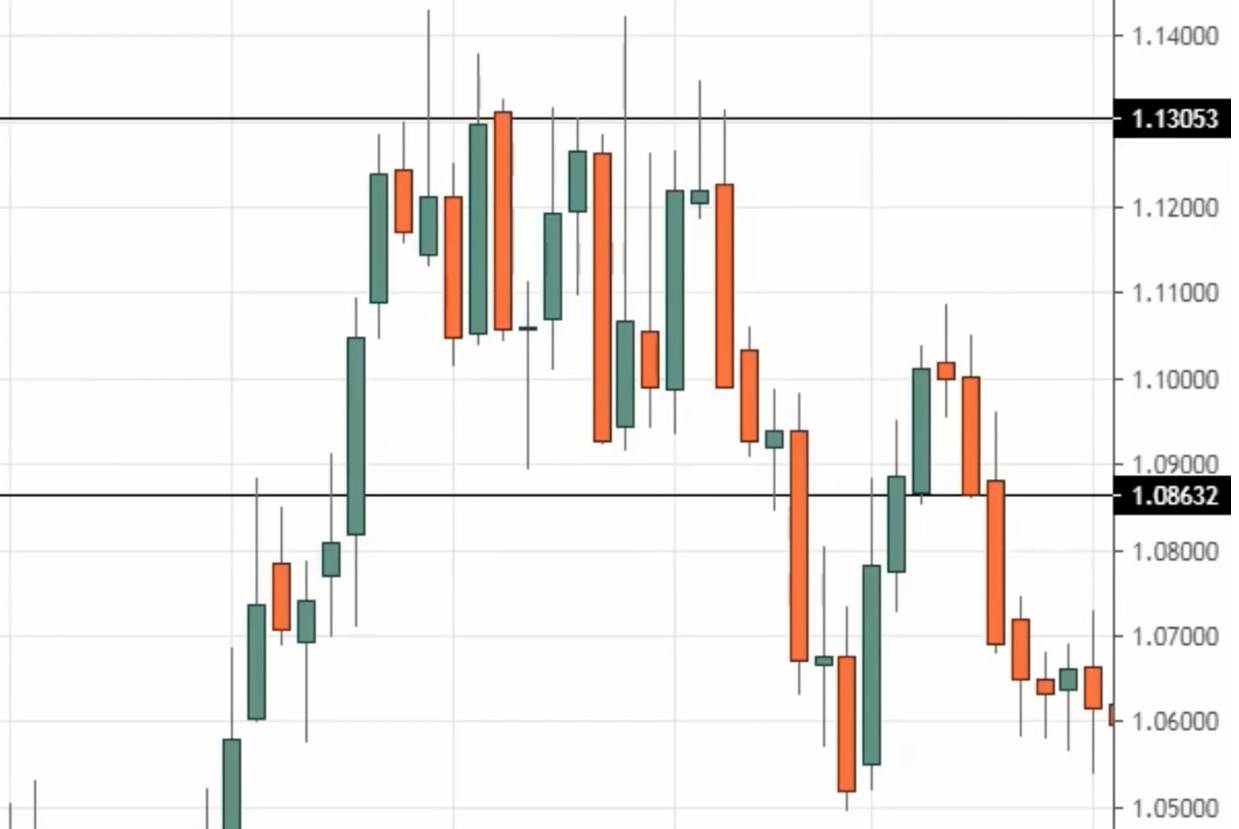
Because if you look at it, the market can consolidate and play with your feelings, making you cut your losses prematurely before finally reaching your target.
You can see that the market didn't just go smoothly in your direction. It played with your feelings by going up and down a little before heading down.
Although today's topic is about trading entries, I want you to know the importance of trade management:
- How are you going to manage your trade if the market moves against you?
- How are you going to manage your trade if the market moves in your favour?
This is a very important topic that I can’t cover in today’s video, but you have to think deeply about this.
And lastly…
Break of structure
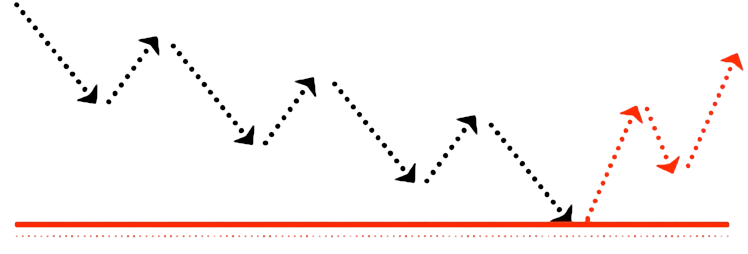
This is a pattern that allows you to catch the turn of a new trend with low risk. I’ll explain why later.
The key things to look for are:
- A downtrend approaching support area
- A higher high and higher low formed against the downtrend
(It’s the opposite for short trades.)
What you're essentially looking for is a new series of higher highs and higher lows.
Also, you must let the market come into key price structure that can be seen on the higher timeframe.
For example, let's say you’re looking for a break or structure on the 4-hour timeframe, then the price has to come into support or resistance on a higher timeframe.
Let me explain what this means, I know it might sound confusing, but this is key because you want to trade off strong levels on your chart to increase the odds the market reversing.
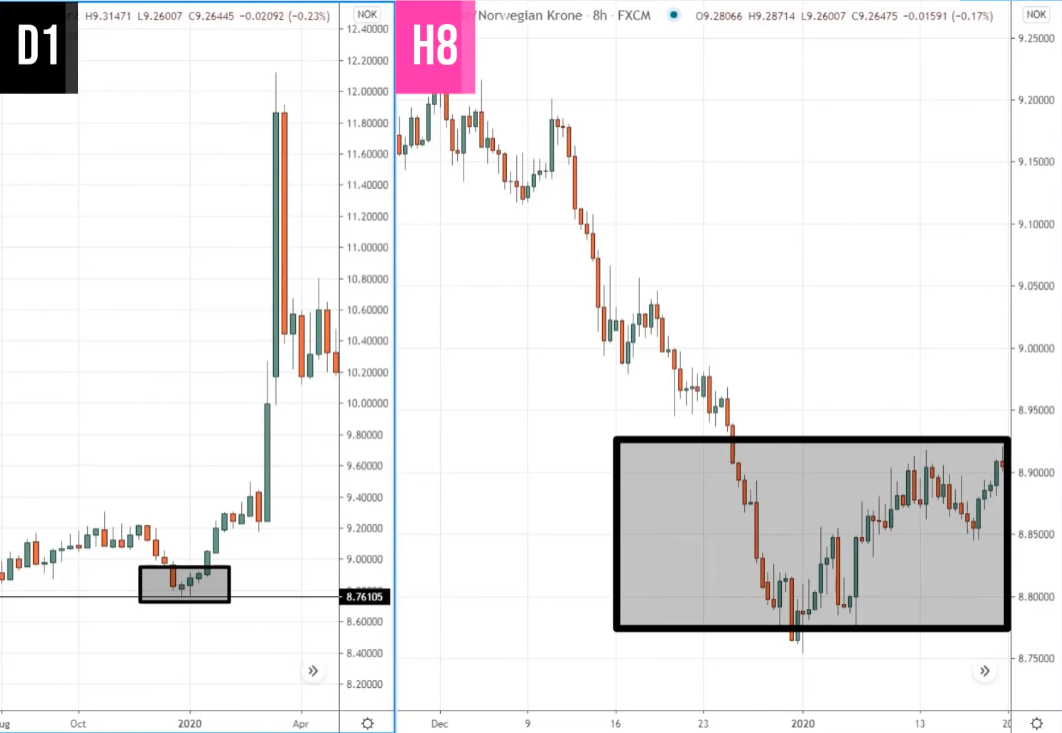
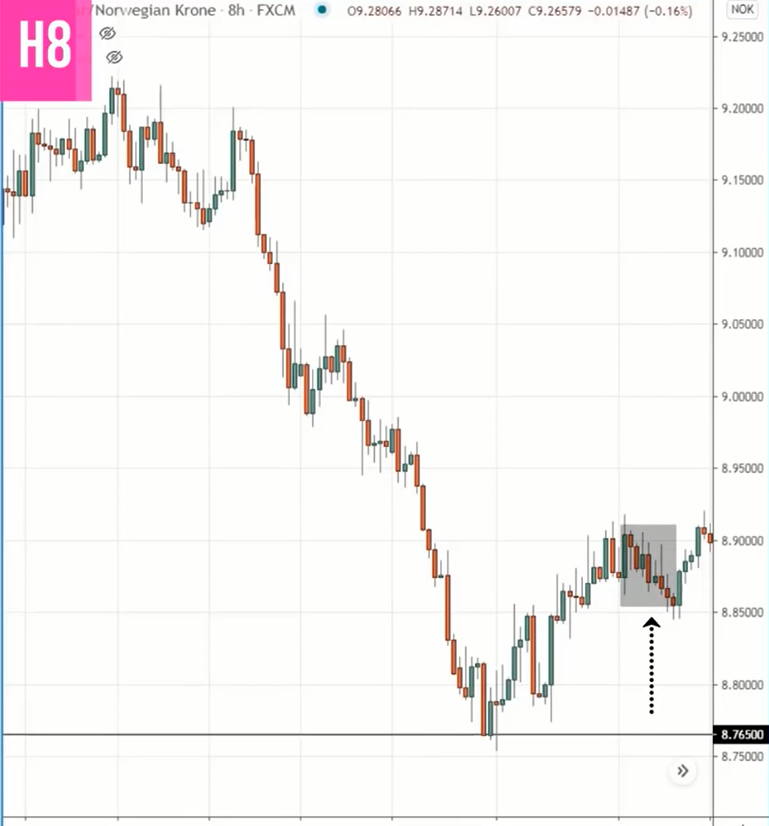
Example #1 (USD/NOK):
On the weekly timeframe, the price has come into this key area of previous resistance turned support.
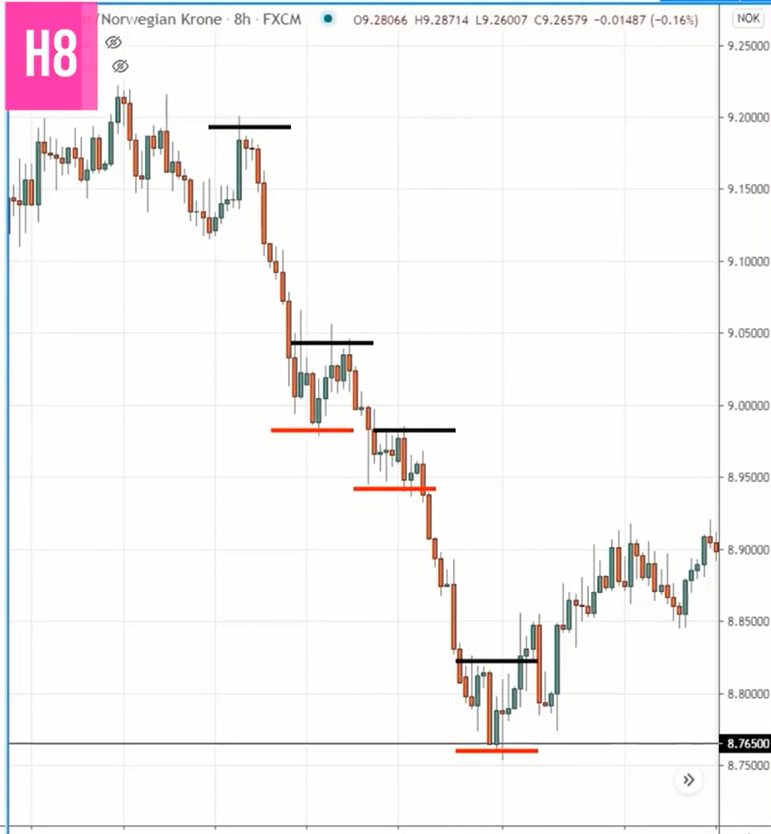
And the break of structure can be seen on the lower timeframe, the 8-hour timeframe where it starts to form a series higher highs and higher lows.
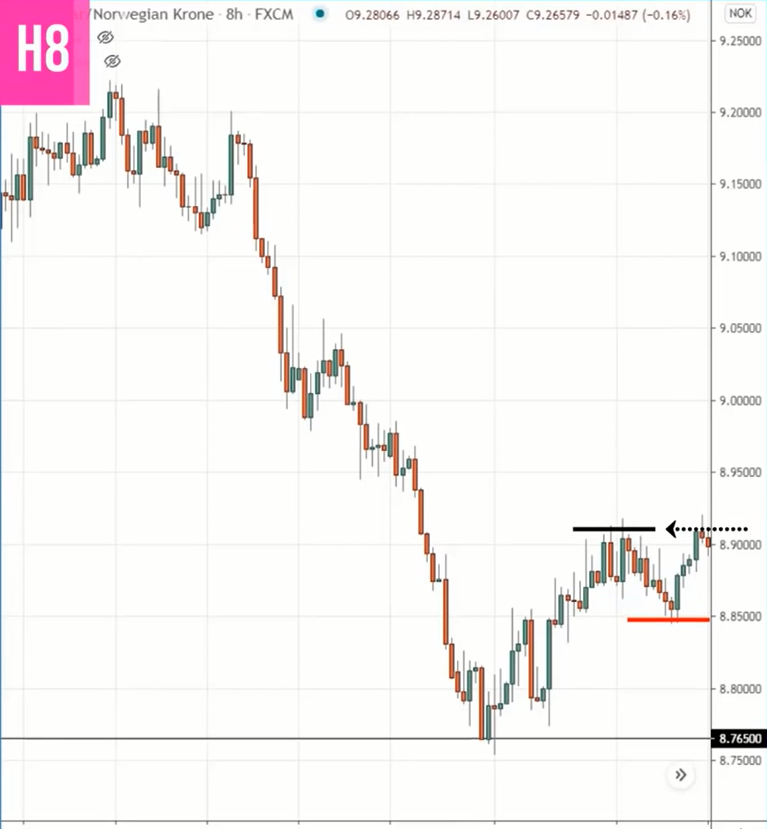
Prior to the price reaching the black line of support, it has been making a series of lower lows and lower highs on the 8-hour timeframe.
You don't want to be buying just yet because the price has not formed a new break of structure.
What you want to see is a series of higher high and higher low. At this point you have here, you have a higher high, followed by a weak pullback into higher low.
This tells you that the sellers are not in control. So when the price breaks above this high, you will go long.
And again, I'm not just blindly trading the break of structure.
But because big picture wise, you have seen that on the weekly timeframe is in an uptrend and the price is coming into this key price structure over here where previous resistance turned into support.
Only then, on this lower timeframe, the 8-hour timeframe, do we trade the break of structure.
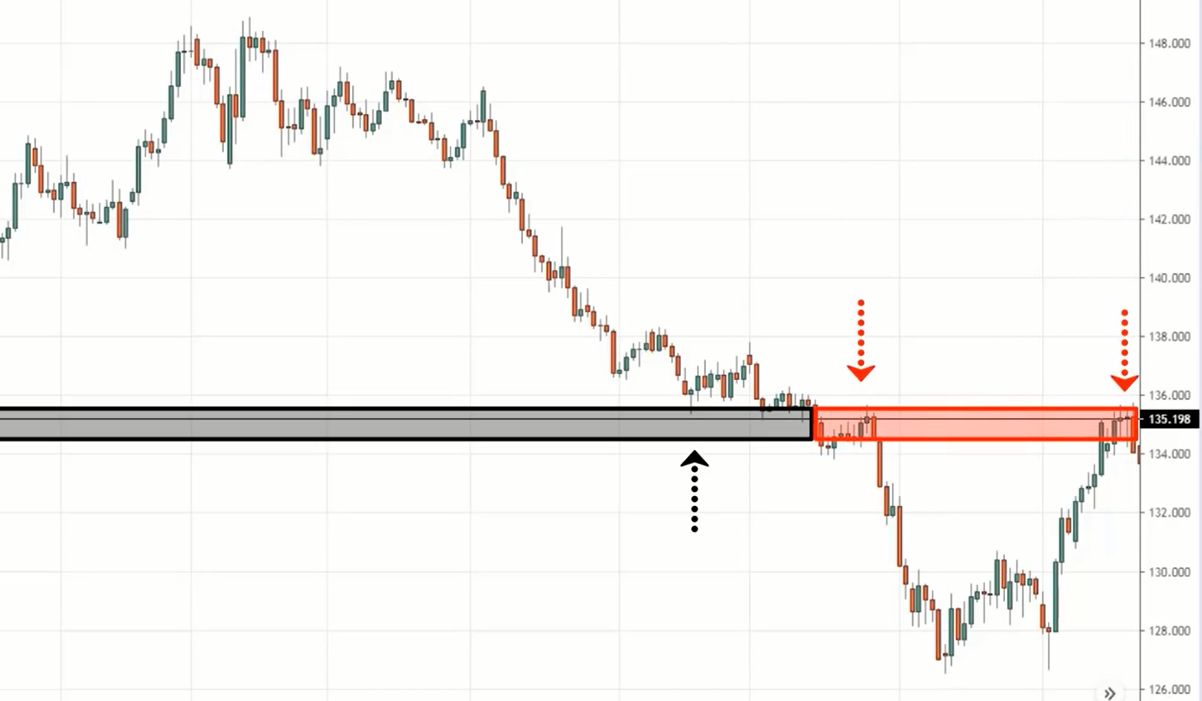
Example #2 (GBP/JPY):
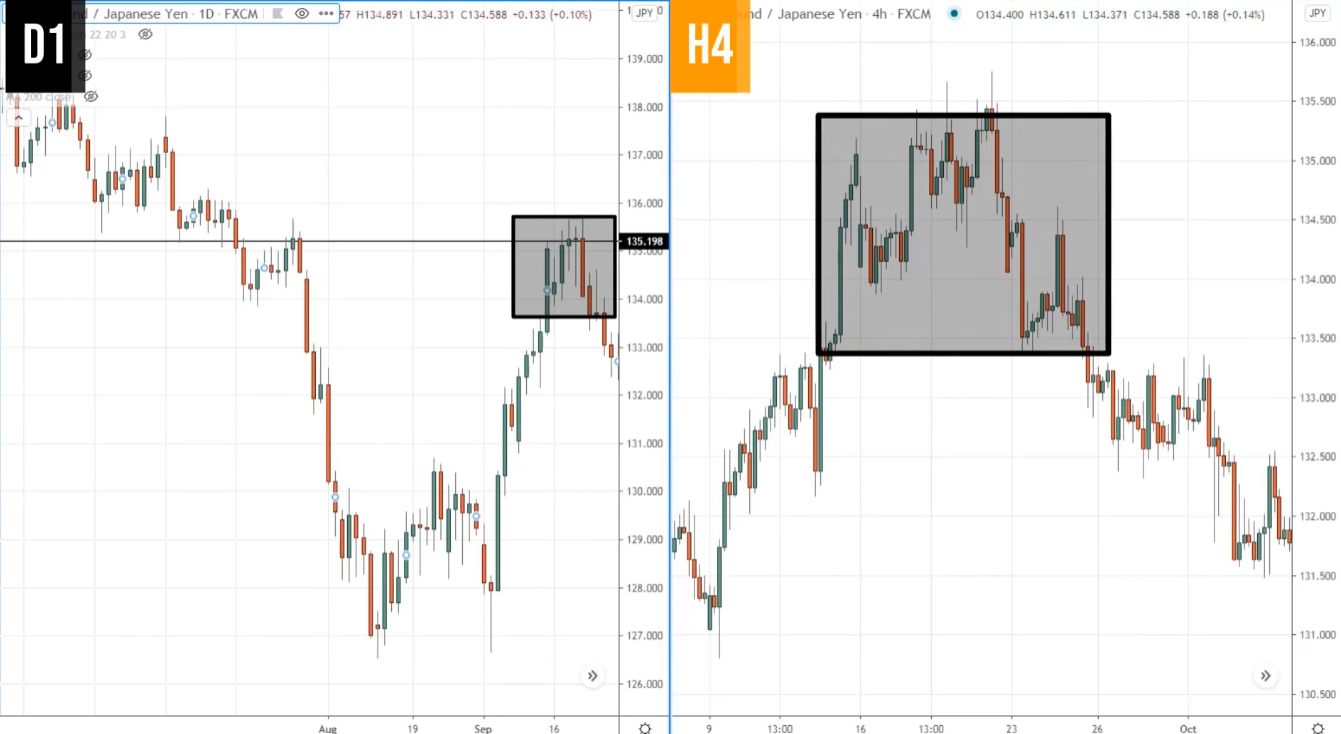
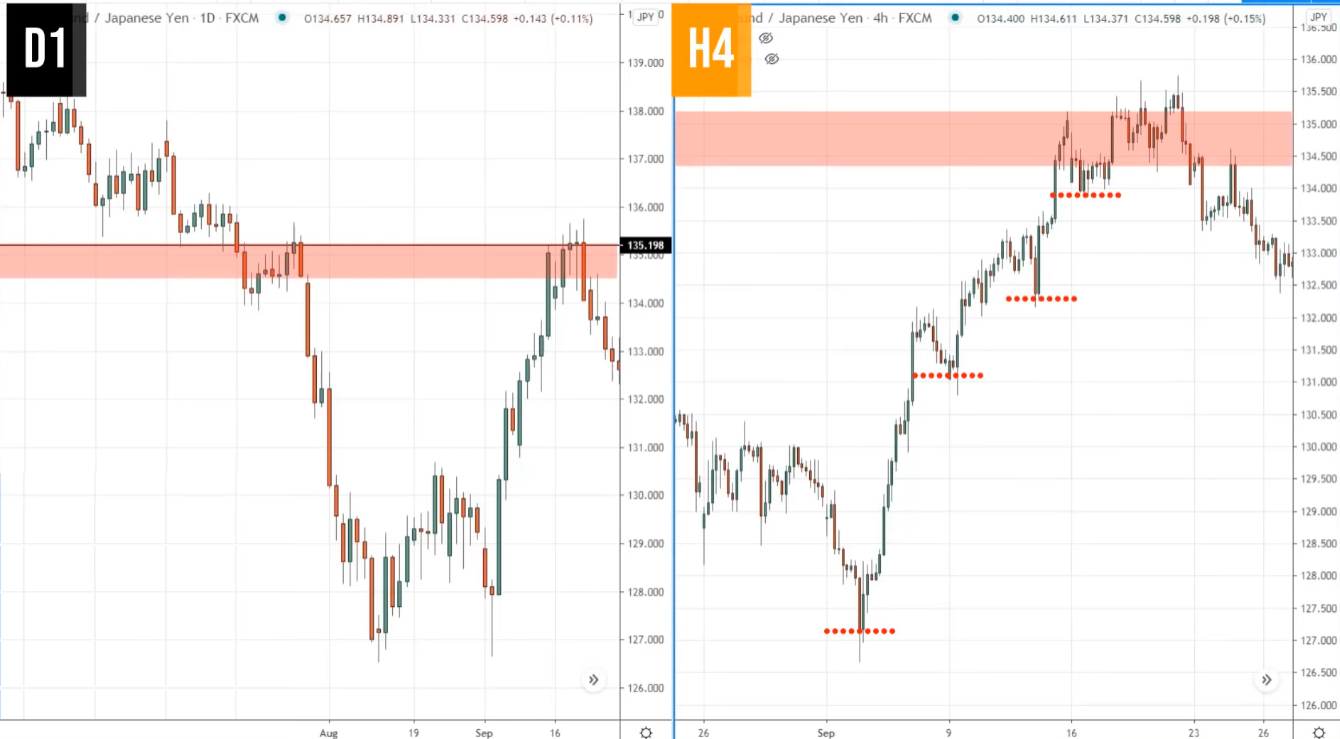
Let’s look at GBP/JPY on the daily timeframe where price comes into previous support that could act as resistance.
If you go down to a lower timeframe, like let's say the 4-hour timeframe, this is what you’ll see:
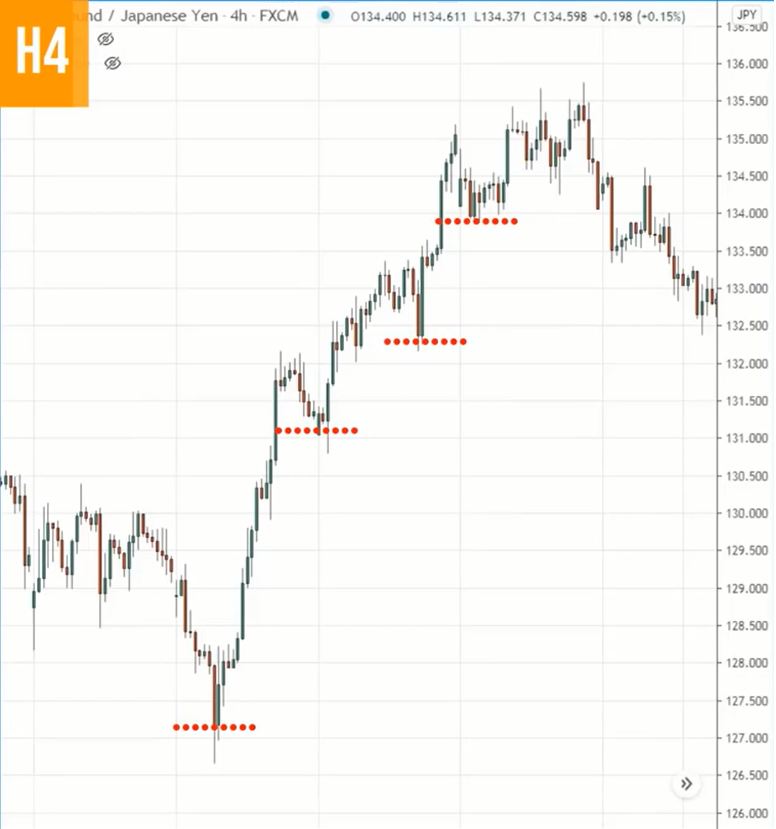
You can see that on the 4-hour timeframe previously, the market was making a series of higher lows.
But you know that from the bigger picture, on the daily timeframe, the market is actually in a downtrend as you've seen earlier, and the price is at this area of value, the area of resistance.
At this point when you look at the price on the 4-hour timeframe, you’re looking for clues that the market, is about to reverse lower. What are some clues to look for again?
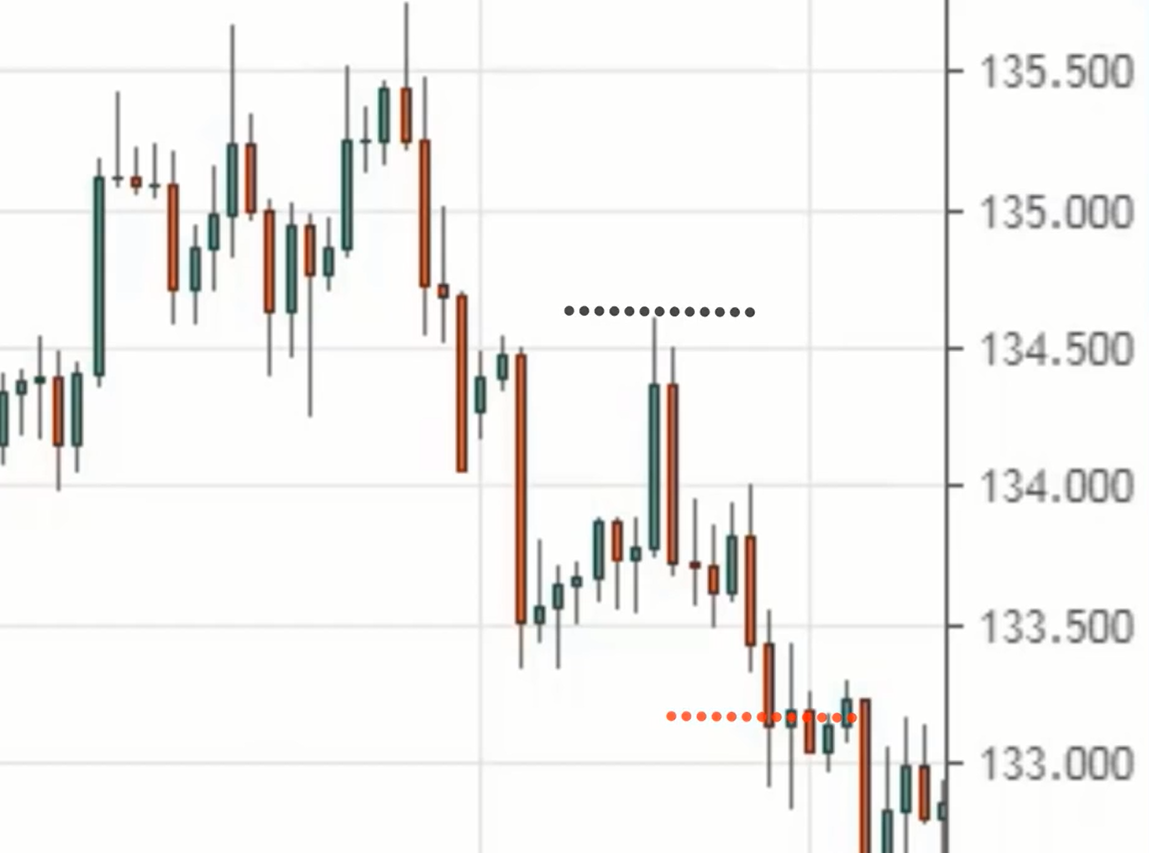
One example is the break of structure, with a series of lower highs and lower lows.
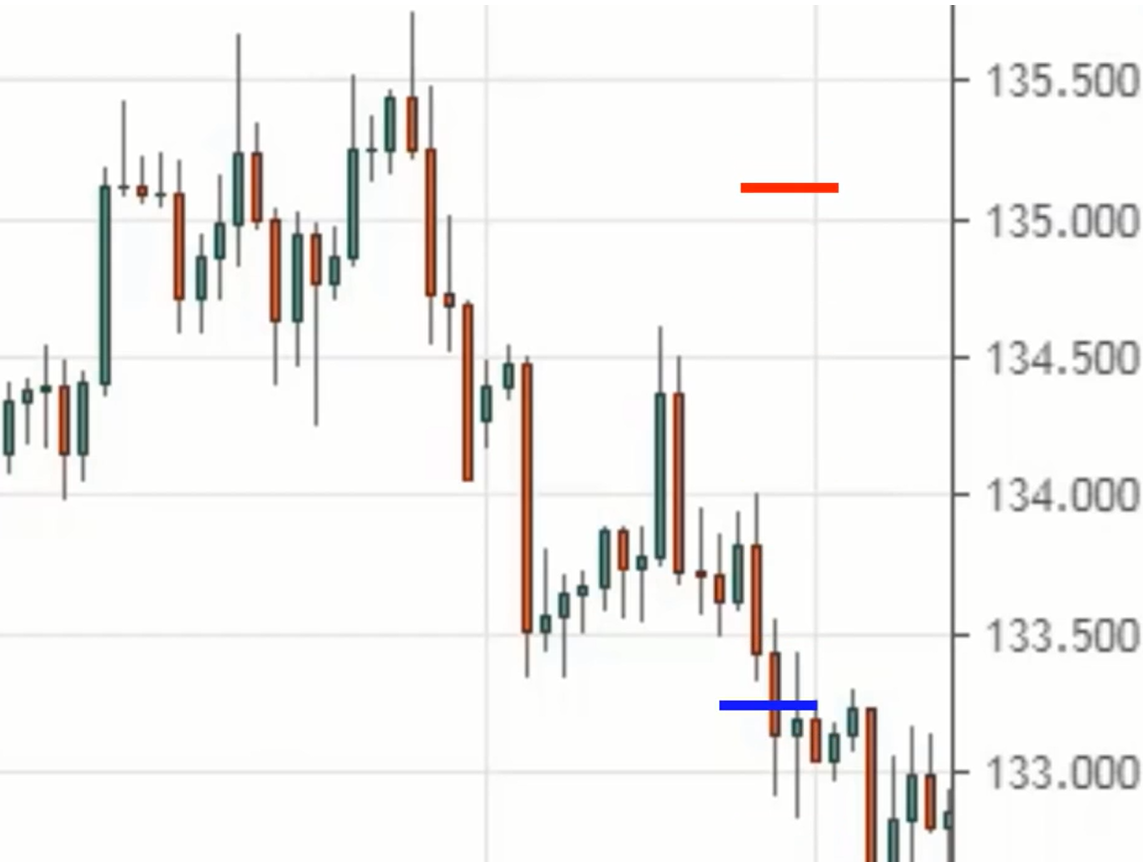
This is what we call a break of structure. We can go short when the price breaks below this low, with stop loss 1 ATR above this high, just a buffer above it.
This is what I call the break of structure.
Let’s move on…
Context matters
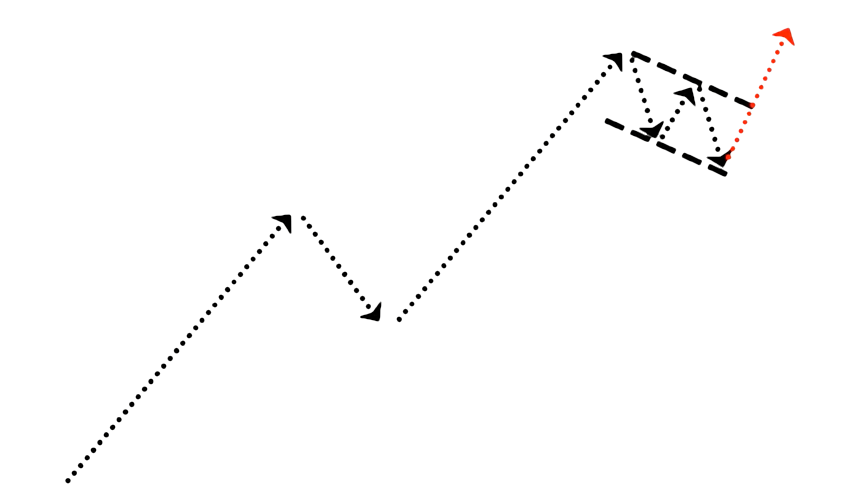
Let's say for a bull flag pattern, I'm which looks something like this:
This is a bullish sign, but let me ask you, do you want to be trading a bull flag in a downtrend or a bull flag in an uptrend?
Although both are bull flag patterns, the one that’s in an uptrend will have a higher probability of it working out. This is what I mean by context matters.
So here are some things to look out for:
- Trade in the direction of the trend
- Don’t trade far from an area of value
- Higher timeframe price structure confluence
Let me explain.
1. Trade in the direction of the trend
Trade with the current or higher timeframe trend, especially for the examples on the break of structure.
It might seem that it’s counter-trend trading, but you're actually trading in the direction of the higher timeframe trend.
I don't trade the break of structure if I'm trading against higher timeframe trend because the odds of it working out is low.
For an advanced trader, if you want to trade counter-trend trades, it's fine. But if you're new to trading and you want to improve your odds, then trade in the direction of the trend.
2. Don’t trade far from an area of value
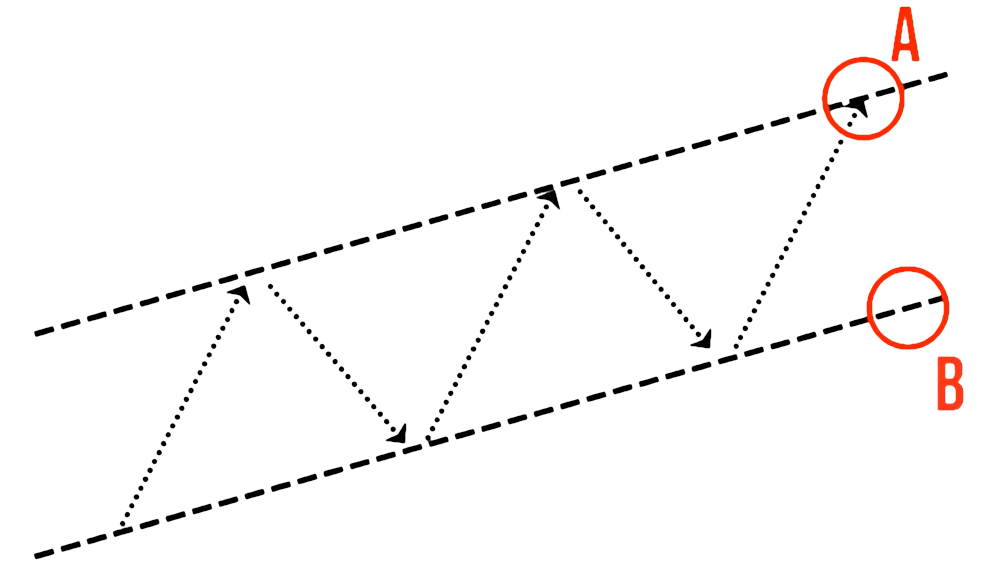
Let's say, that the market is in an uptrend.
But from the looks of things, do you want to be buying at that point A or point B? I hope you said B because B is an area of value for buyers.
If you buy at A, yes you are trading with the trend, but there’s a good chance that this market could retrace and pullback. And if your stop loss is too tight, you will get stopped out on the pullback.
So don't trade far away from an area of value. Point A is far from an area of value. You want to trade near B because it's near an area of value.
Example #1 (EUR/USD):
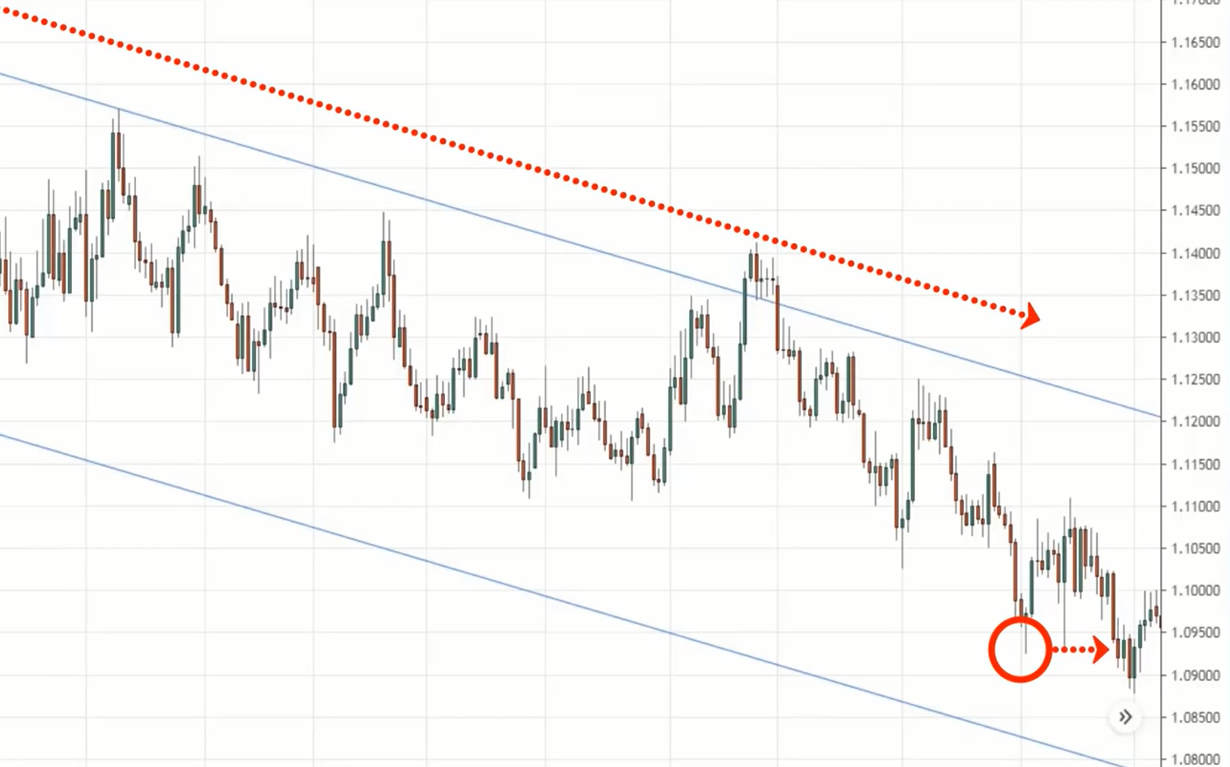
You can see that the price is in an overall downtrend, respecting this trend channel:
But I hope you're not trying to sell over here at the extreme right. Yes, you want to trade with the trend, but at the same time, you also want to pay attention to an area of value.
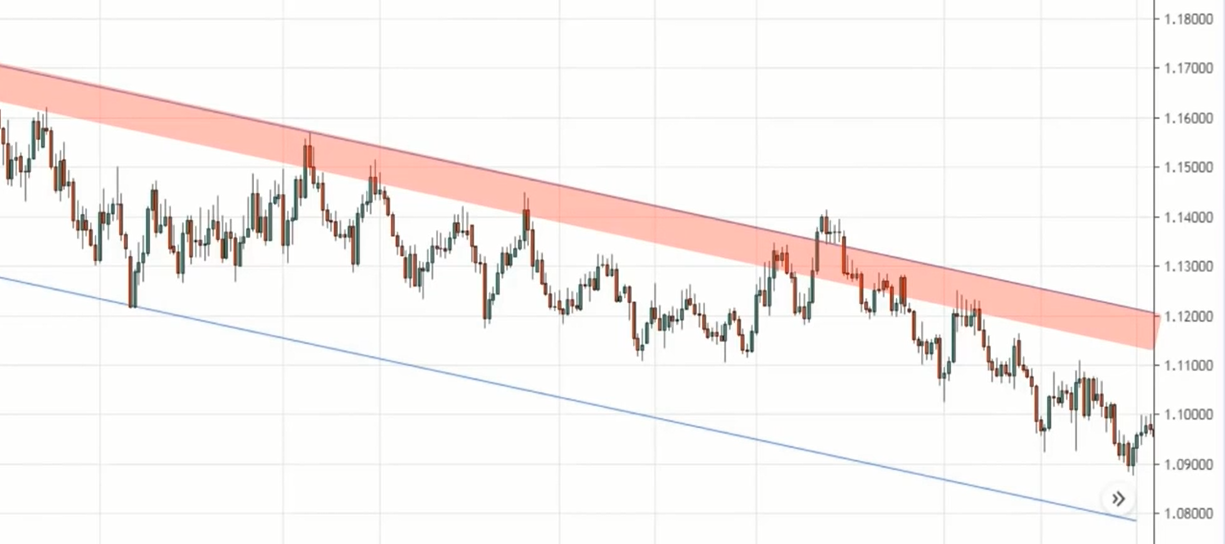
If you're looking to sell there, where’s the area of value?
If you’d just zoom out, you can see that the area of value is at the upper boundary of this trend channel over here, where you’ll look for selling opportunities.
Not the lower boundary, that is far away from an area of value, even though you might be trading with the trend.
If you quit trade from an area of value, then when a pullback occurs, you'll get stopped out.
3. Higher timeframe price structure confluence
If you are trading from an area where there's a confluence with the higher timeframe support resistance, it can really enhance the odds of your trade working out.
Example #1 (EUR/NZD):
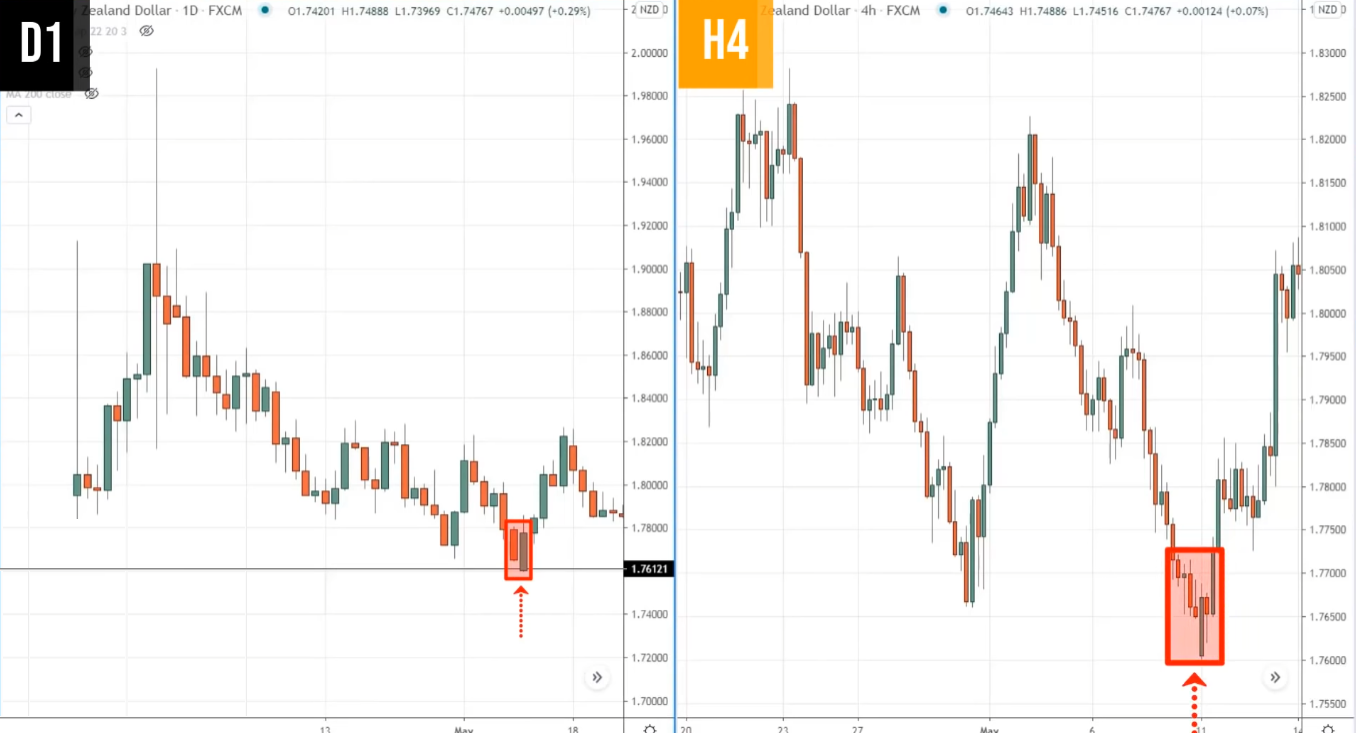
You have a very nice bounce over here at this point but many traders might be hesitant to buy this false break over here because it looks extremely bearish.
“Look at the big bearish candles coming into support, Rayner. Are you sure you’re going to buy it now?”
If you just look at this chart on its own, it can be daunting to buy. But if you understand the higher timeframe price structure, things will look different.
If you look at the big picture on the daily timeframe, you’ll realize that level is a key level. If you zoom out onto the daily timeframe, you can see that this is a previous resistance turned support.
And for that same portion over on the 4-hour timeframe, this false breakout has occurred.
This will increase the odds of your trade, especially when you lean against higher timeframe support resistance.
This is what I mean by higher timeframe price structure confluence as this will really put the odds in your favour.
So as much as sniper trading entries seems like just memorizing a few chart patterns, but that isn't the case. Because context matters.
You have to ask yourself questions like:
- Are you trading with the trend?
- Are you trading from an area of value?
- Do you have the confluence of higher timeframe support resistance?
All these matters, so it’s not just about some magic pattern, that you could just pluck from the thin air and then find them on your chart.
Here’s a quick recap...
Recap
- False break – a reversal trading pattern
- Breakout with a buildup – look for consolidation before buying a breakout
- Break of structure – to enter the start of a new trend with low risk
- The first pullback – enter on a first pullback even if you missed the first wave of the move
- Context matters – don’t just focus on the patterns, spend some time focusing on the context of the markets as well

