#10: What is a Harami
Lesson 10
What is a Harami Candlestick Pattern
In this video, I'll be discussing the Harami.
This is what it looks like:

This candle over here, the second one, is a Harami.
A Harami is simply what I call an inside bar.
This means that the candle is inside the prior candle.
It's actually the opposite of the engulfing pattern actually.
Usually, when you see Harami on your chart, it usually leads to volatility expansion.
It does not expand immediately but it should be like a signal to you that the volatility of the market is contracting.
As you know, volatility in the market is not constant.
It moves from volatility contraction to expansion, and then back to contraction, and then expansion again!
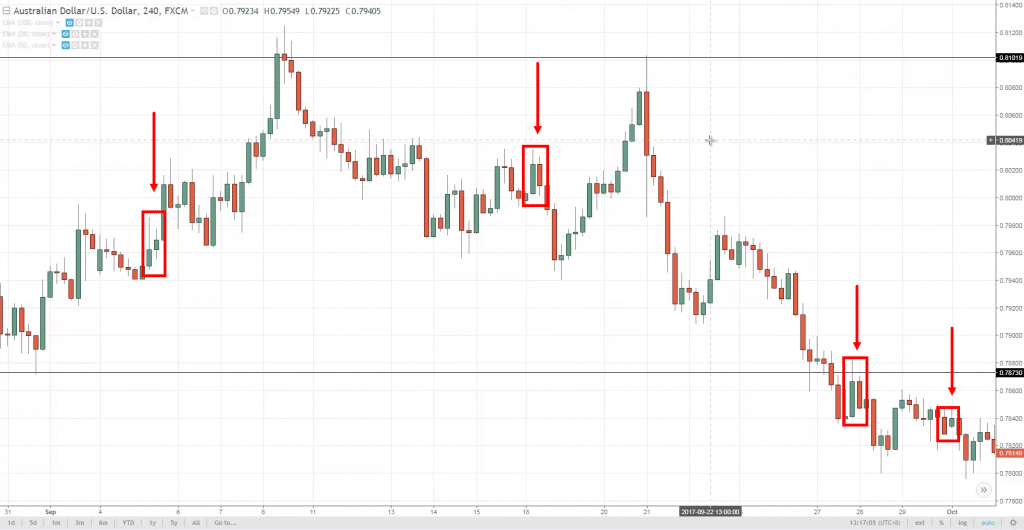
Let's have a look at Harami on this chart:
You can see that volatility is contracting, and then it expanded towards the downside.
By now, I think you should be familiar with what is a Harami and the implication of this is that it is telling you that the market is going through, or possibly going through a volatility contraction.
And you can expect volatility to expand or pick up if the price doesn't break out of any significant level.
Here's a quick recap to the Harami…
Recap
- It's basically an inside bar with a small range, and sometimes it can be large, as you have seen earlier.
- Usually, it's a sign that the market could be going through a volatility contraction, and you would tend to expect volatility to expand in the near future.
- It expands or breakout in the direction of the prevailing trend, or rather the previous momentum that led to the volatility contraction

