#8: Learn How To Trade Stocks (Step By Step Guide)
Lesson 8
So you have learned a lot so far.
We've covered the basics of stock trading, and what is a stock.
We also talked about Fundamental analysis, Technical analysis, and Risk management.
I know there's a lot to swallow at this point in time.
So I just want to piece the puzzles together so that you can see the big picture of what we are trying to accomplish over here.
Let me just do it showing with you a trick example where I simulate a trade.
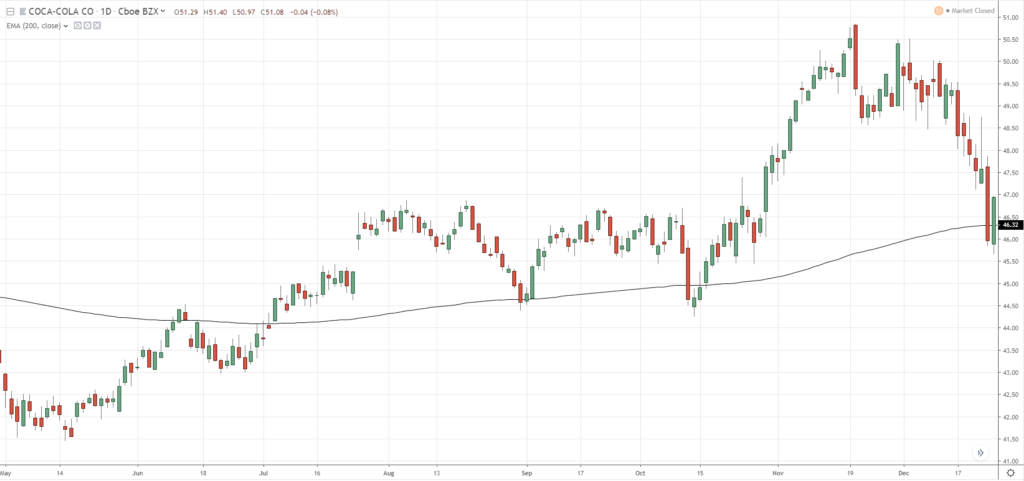
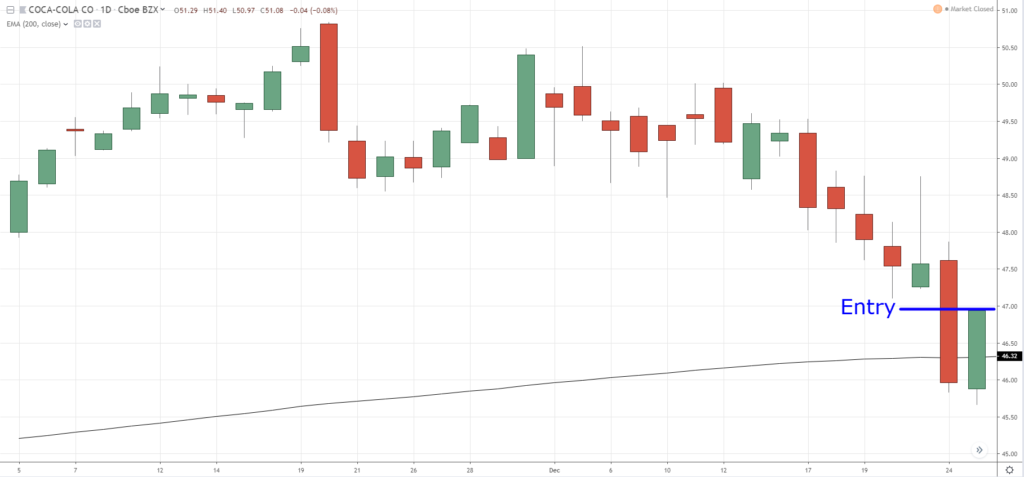
This is the chart of Coca-Cola…
Also, let’s assume that Coca-Cola is a fundamentally strong company.
Earnings are improving, revenue is beating analysts’ estimate year-on-year.
That’s all the good stuff coming out of Coca-Cola!
So that is a stock we want to focus on.
Next thing we look at is the Technical aspect of the stock.
What is the trend?
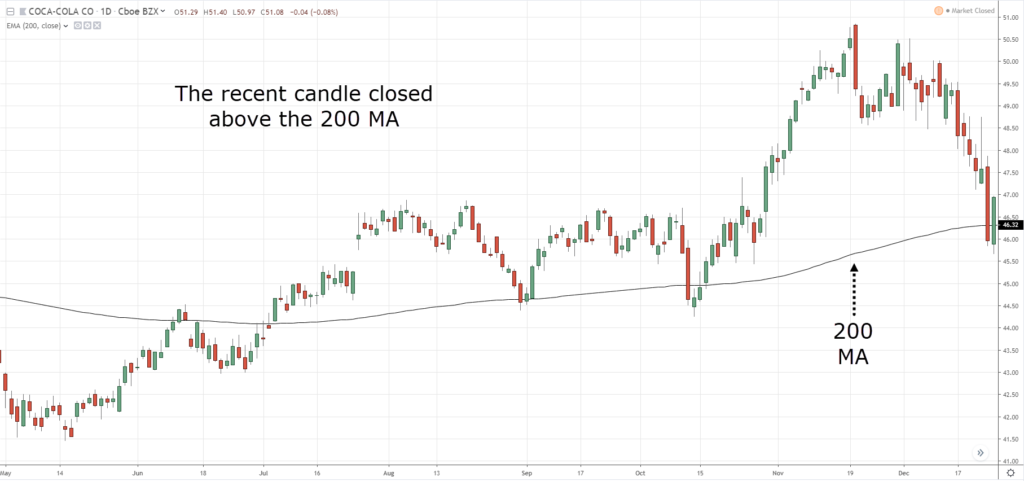
We notice that this market is in an uptrend as the price is above the 200 MA…
Recall, if the price is above the 200 MA, it’s a long-term uptrend and we want to say long.
If the price is below the 200 MA, it’s a long-term downtrend and we want to stay short or in cash.
Just because the price is in an uptrend, it doesn't mean that we buy immediately.
Why is that?
Because the second thing that we look for is the area of value...
What is the area of value?
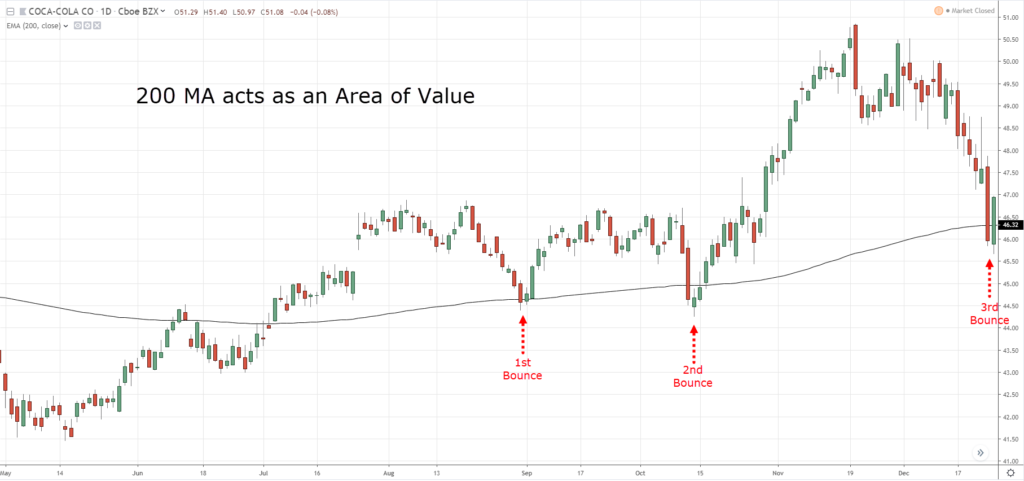
We want to buy when the price is at an area of value.
And in this case, the price bounced off the 200 MA twice and recently rejected for the 3rd time…
Not only that!
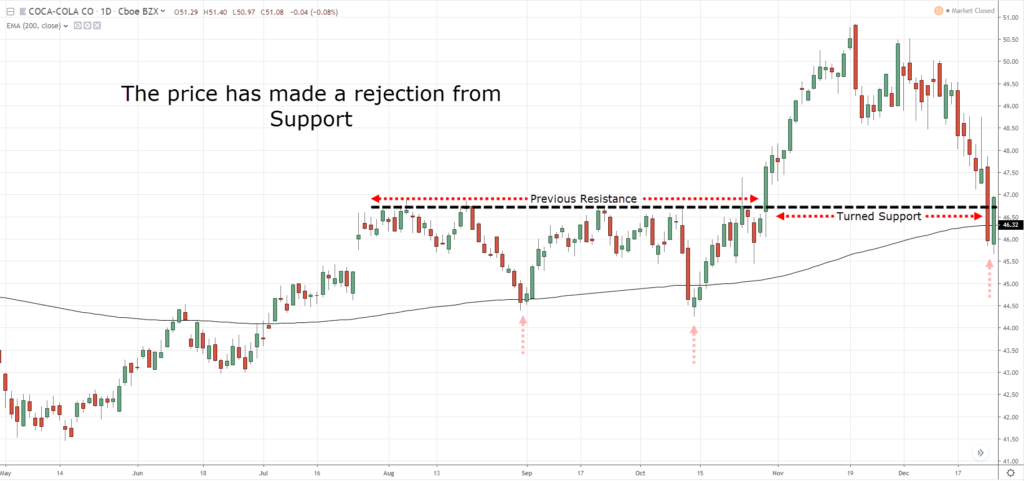
If you notice from a market structure perspective, it recently rejected from an area of Support as well…
Whenever price breaks above resistance, it tends to retest previous resistance which will turn into new support.
And if price breaks below Support, that area of support will become resistance.
Clearly…
Coca-Cola is also at an area of value.
The third thing we need to look for is the entry trigger…
What is the Entry trigger?
Do we have an entry trigger that tells us that the buyers are stepping in and about to push price higher?
If you look carefully, we have a bullish reversal piercing candlestick pattern…
This is a sign of strength from the buyers.
So we have four things in-line with this stock:
- Good fundamentals
- Trend is up
- The price is at an area of value
- A strong bullish reversal pattern as an entry trigger
What’s missing?
If you recall earlier, risk management is important.
Because you can have a profitable trading system or strategy, but without proper risk management…
You could still lose in the long run.
Now the question is…
How many shares do you buy?
How many shares of Coca-Cola do you buy in such a way you only lose 1% of your trading capital?
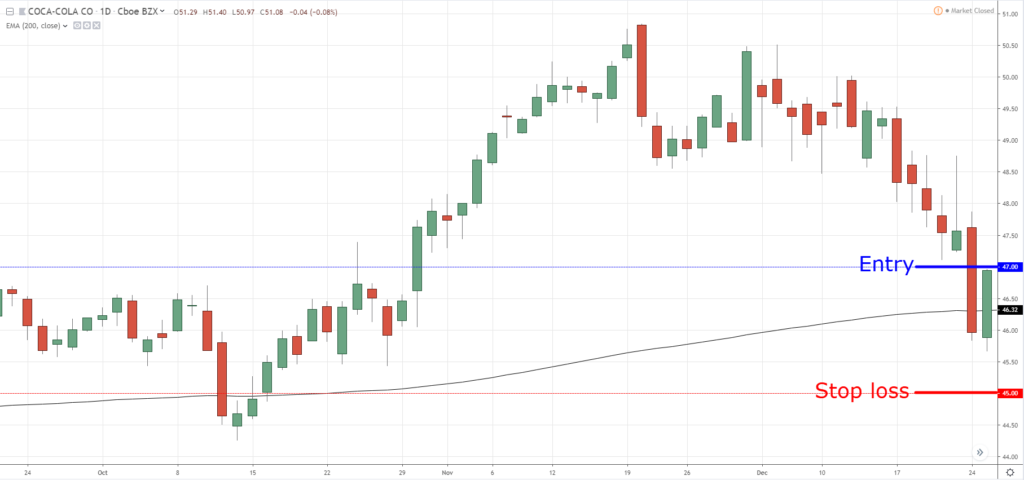
Before we can answer that question, we have to ask ourselves where is our entry point and stop loss price…
Entry: $47
Stop loss: $45
With that in mind, just pull out your position sizing calculator…

Let's say you have a capital of $100,000.
Just fill in the blanks as demonstrated in the previous lesson and in this case…
You can buy 500 shares of Coca-Cola.
If the price hits your $45 stop loss, you will lose not more than $1000 which is 1% of your trading account.
So this is how you kind of piece the puzzles together.
One aspect that I've not really covered is your exits.
Where do you exit your trade?
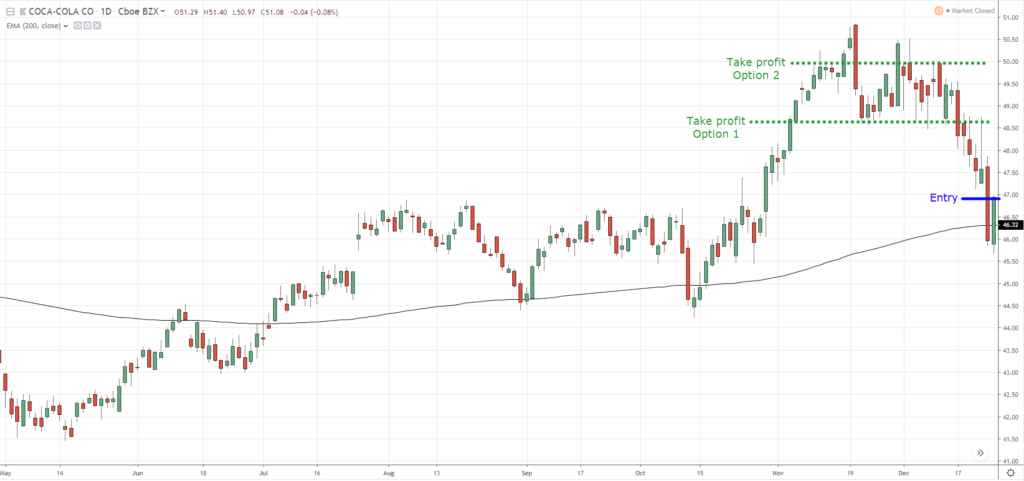
This is a very broad topic, but generally, if you're a swing trader and you just want to capture one swing in the market…
What you want to do is to exit your trade where there is a potential selling pressure or where sellers could come in and push the price lower.
And if you look at the Coca-Cola chart, there could be a potential selling pressure at this level…
This is how you can go about exiting your trades.
Of course, this is just one approach from a swing trading perspective.
You can adopt a trend following approach as well where you try to ride trends in the market.
But again, it's not within the scope of this lesson to cover it.
With that said let's move on to the next lesson…

