#12: The Best Forex Trading Strategy For Beginners
Lesson 12
Hey, hey, what's up my friend?
In today's training, you'll discover the best forex trading strategy for beginners.
Here's the thing…
This trading strategy doesn't only work for forex. It can be applied to the stock or futures markets as well.
This trading strategy is what I call – the BWAB trading strategy.
The BWAB trading strategy
Before I explain to you what this is about, I want to share with you the criteria that went through my mind before I decided to share the strategy with you.
Easy to spot
Because new traders are not familiar with the price action analysis, chart patterns and stuff like that.
I made sure that this pattern is relatively easy to spot so that new traders are able to catch this pattern.
Sound logic behind why this trading strategy works
In fact, there must be a logic behind all strategies. If not you, you won't have the conviction to trade it.
It must take time to happen
Meaning it takes time for the pattern to form. If it forms too quickly, beginning beginners won't be able to catch it in time. They'll be too slow to react.
So I made sure that this trading strategy takes time to form, for new traders to catch it as well.
The BWAB trading strategy (long setup)
It goes something like this:
- The market is in a range (ideally 80 candles or more)
- The price approaches the highs of resistance and forms a tight consolidation (the buildup)
- The 20-period moving average to touch the lows of the buildup
- Place a buy stop order above the highs with a 3 ATR trailing stop loss
I’ll explain…
1. The market is in a range (ideally 80 candles or more)
You don't have to be anal about this. If you get 77 or 75 candles, it's fine as well.
But generally I just 80 candles or more, because the more candles there are, the longer the range, the better.
2. The price approaches the highs of resistance and forms a tight consolidation (the buildup)
I’m looking for a tight buildup at the highs of resistance.
3. The 20-period moving average to touch the lows of the buildup
This signals to me that the market is about to make a move higher.
4. Place a buy stop order above the highs with a 3 ATR trailing stop loss
If you don't understand all these technical terms, don’t worry.
I'll share with you a ton of charts and cherry-picked examples because it's much easier to illustrate those examples for you to understand what they mean.
Just for you to have a rough idea, let me just sketch to show you how it looks like.
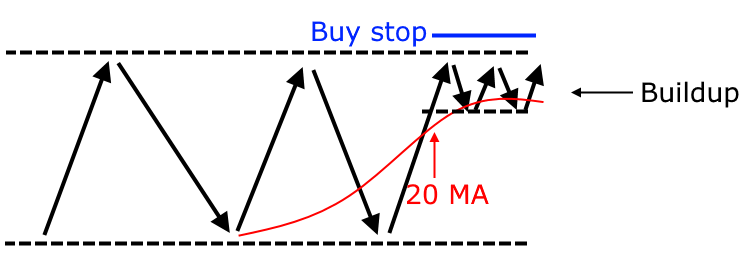
So the market is in a range, ideally about 80 candles wide. Then it comes up to the highs of resistance and forms a tight consolidation, which is what I call a buildup.
Then you want to let the 20-period moving average, touch the lows of the buildup. This signals to you that the market is now getting ready to breakout.
When that happens, you’ll place a buy stop order above the highs, just above the highs of resistance.
And if the market breaks out, you’ll go long with a stop loss of 3 ATR as your trailing stop loss.
(I'll explain how that works with a few chart examples later.)
The BWAB trading strategy (short setup)
The short setup is just the opposite:
- The market is in a range (80 candles or more)
- The price approaches the lows of support and forms a tight consolidation (a buildup)
- The 20-period moving average touches the highs of the buildup
- Place a sell stop order below the lows with a 3 ATR trailing stop loss
Moving on…
Why it works
Now, why does this trading strategy works?

Sign of strength
When the market consolidates at the high of resistance, this is a sign of strength. It's telling you that buyers are willing to buy at higher prices.
At the same time, it's telling you that the sellers have difficulty pushing the price lower.
This is a, a bullish factor in your favour.
The volatility cycle is in your favour
Here's the thing…
The volatility in the market is always changing, it’s not static.
It's always, moving from a period of high volatility to low volatility and then back to high volatility again.
Imagine this, during the buildup, the market is in a low volatility environment. But when the price breaks out and volatility expands, that means that your risk to reward on the trade could be pretty darn favourable.
This is what I mean by the volatility cycle is in your favour because you're entering in a period of low volatility.
A logical place to set stop loss
You can just set your stop loss below the lows of the buildup.
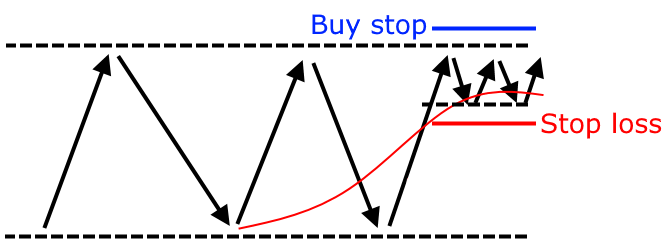
Compare this to a trader who buys a breakout without a buildup. Where’s a logical place to set a stop loss?
If you ask me, a logical place is below the area of support and it's pretty darn far away.

This is why this trading strategy works.
BWAB stands for breakout with a buildup. It’s a breakout with a trading strategy.
Moving on…
The BWAB trading strategy walkthrough
Let me share with you a few examples.
Example #1:
Firstly, we are looking for a range, with a minimum of 80 candles.
On TradingView, just hit Shift + Click and drag, and you’ll see that there’s about 83 bars or candles over here.
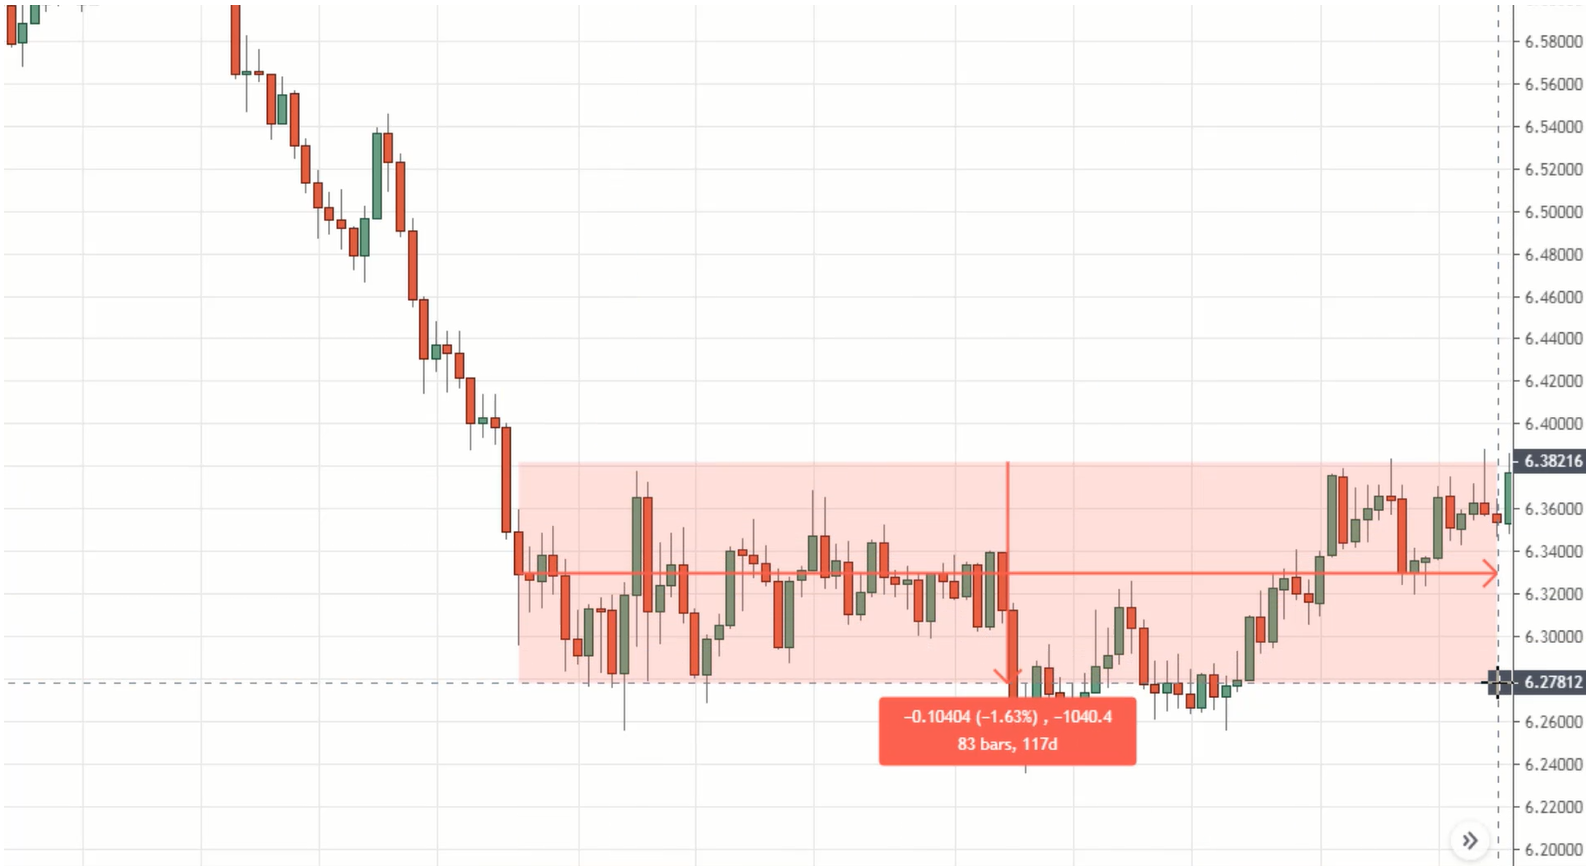
Now that kind of meets our criteria.
Next, where is the high of resistance?
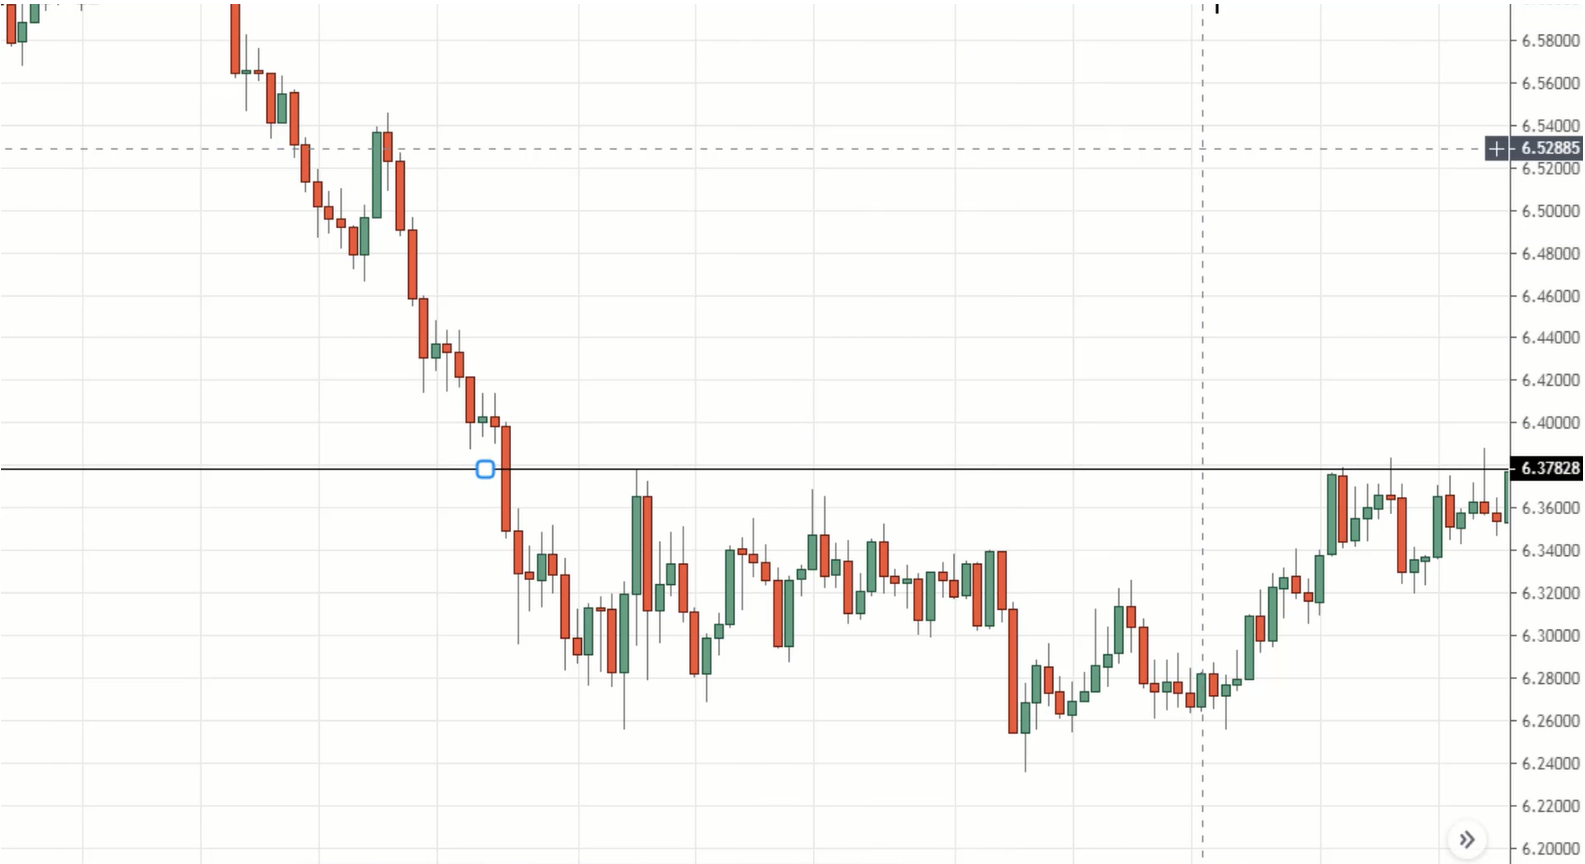
So once the price forms a buildup, what's next?
You are looking for the 20 MA to touch the lows of the buildup.
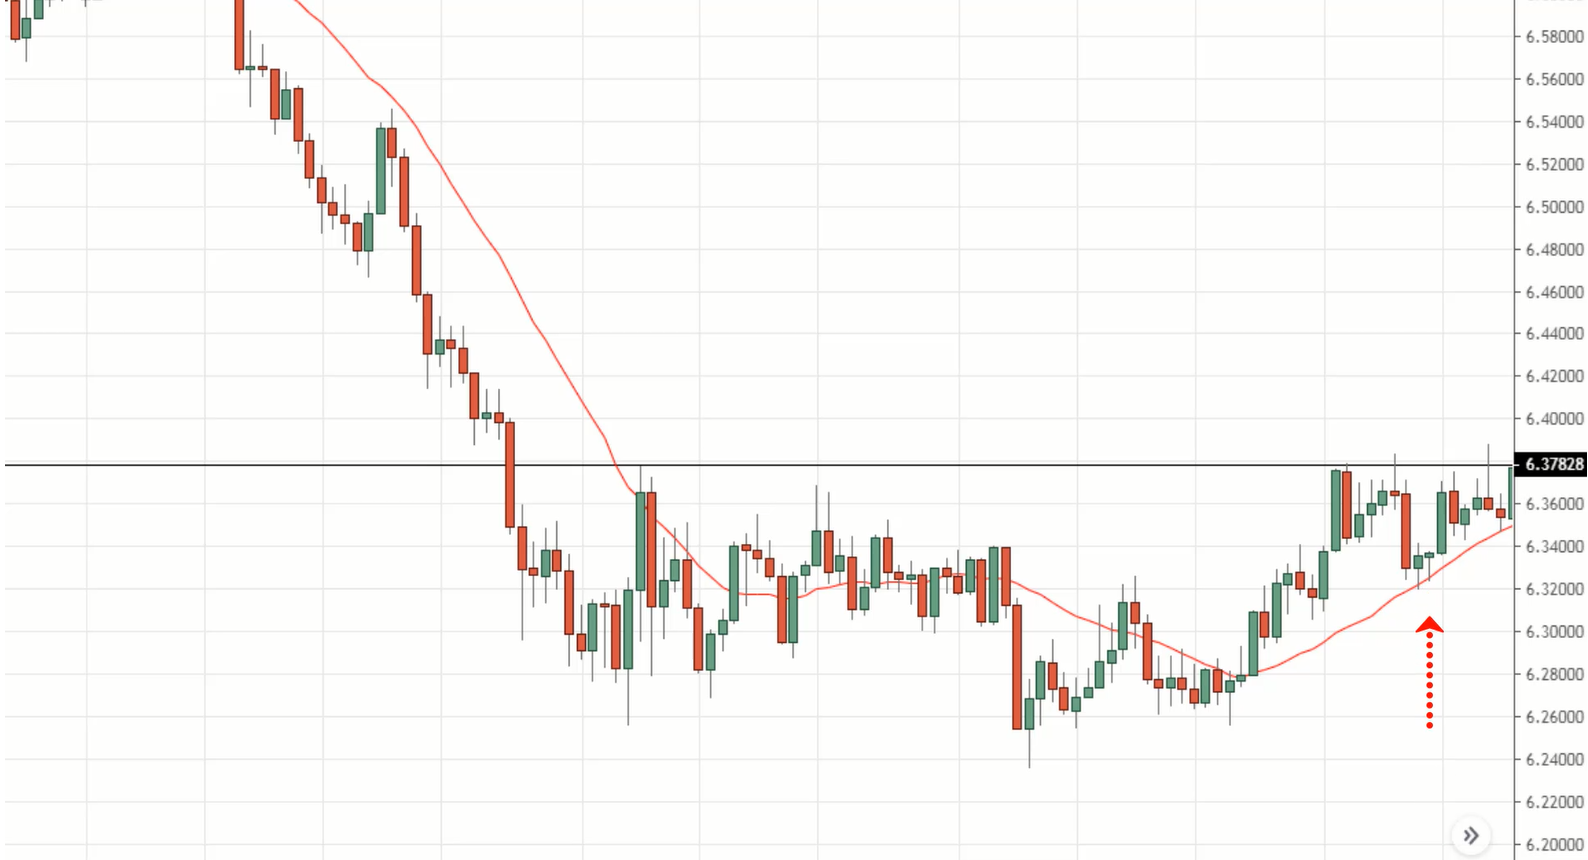
You can see that the 20 MA has touched the lows of this buildup, and it seems to be, supporting these higher prices.
Great, now our criteria are met.
The fourth thing to do is to place a buy stop order above the highs of resistance.
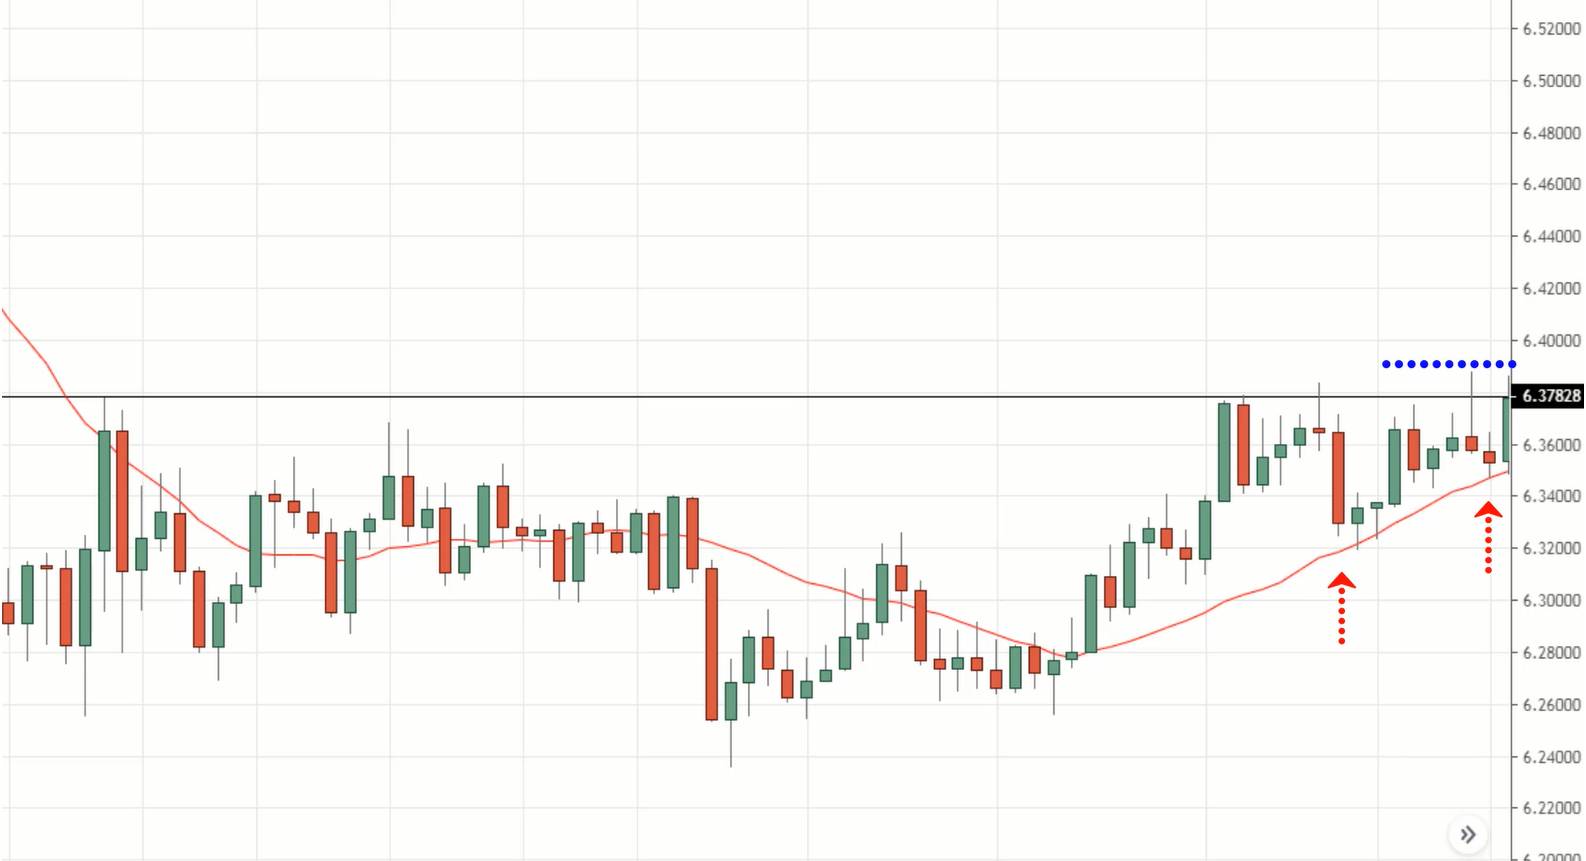
And finally, you’ll have a 3 ATR trailing stop loss. You can use this indicator called the chandelier stop over here.
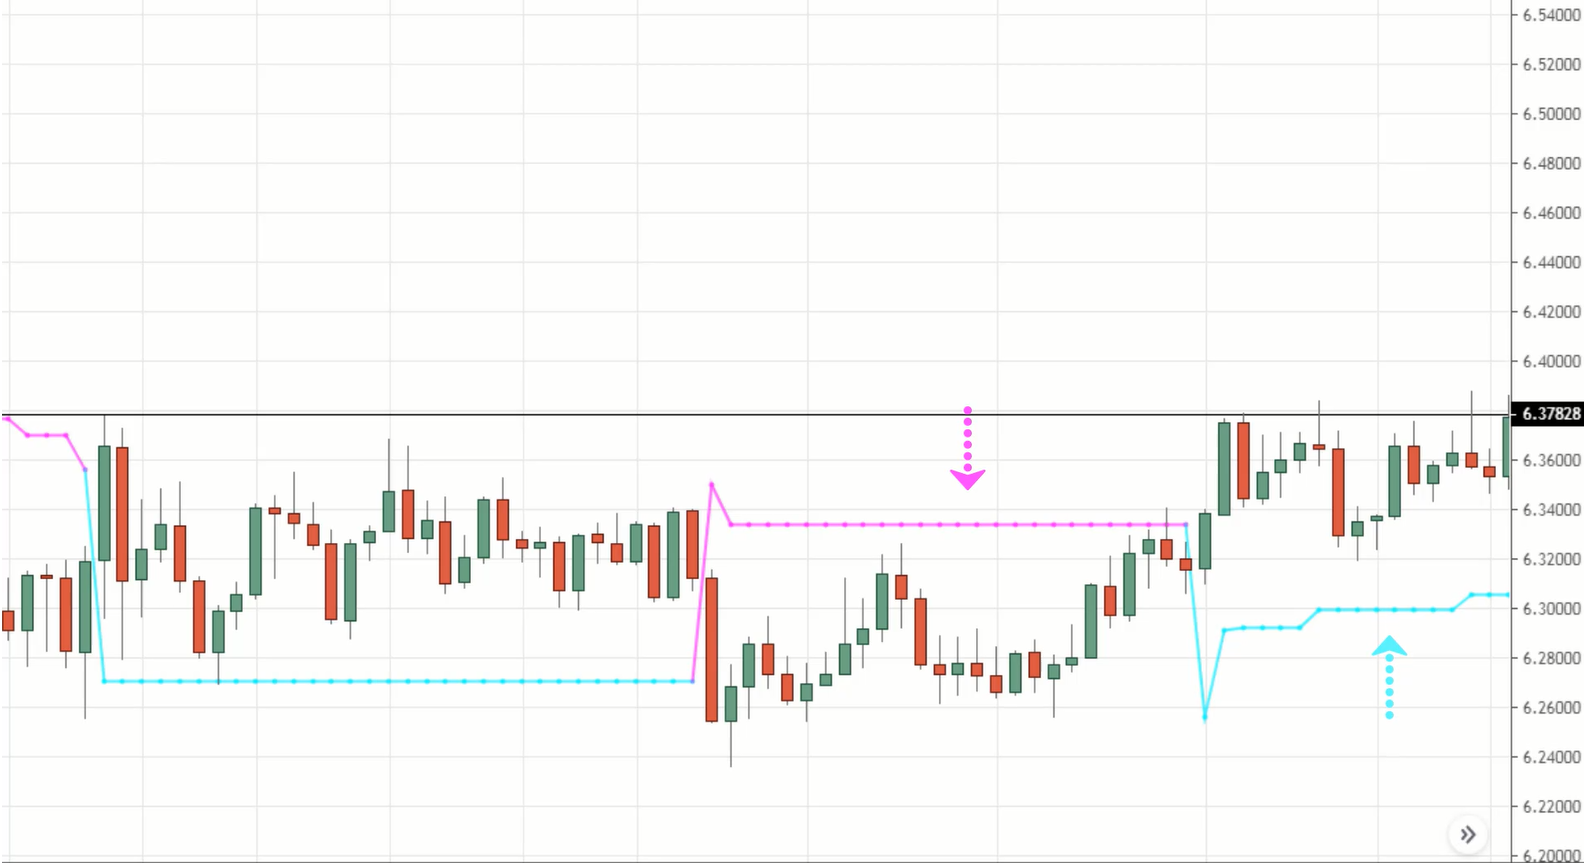
How this works is that this is actually a variation of the ATR indicator. Let me explain.
So once you’ve entered a buy trade, you can use this blue line for your trailing stop loss. When the price closes below this blue line, you’ll exit the trade.
The settings for this indicator is:
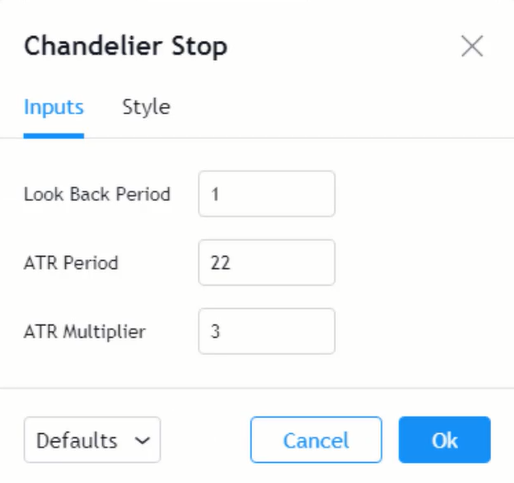
The important one over here is the ATR multiplier. I shared with you 3 ATR because this would allow you to capture a medium-term trend.
If you want to capture a longer-term trend, you can just increase the ATR multiplier to 4 or 5, whatever you wish.
How this blue line move is very simple.
If you pull out the ATR indicator, which stands for average true range, it measures the historical volatility of the market.
Let’s say we have a current price level Y, with an ATR value of X, and we have a multiplier of 3.
By taking:
Y – 3X = Z
We will get Z, which will be the blue line that we see above.
You can imagine that as Y, the current market price goes up, your blue line, which is your chandelier stop, will go up as well.
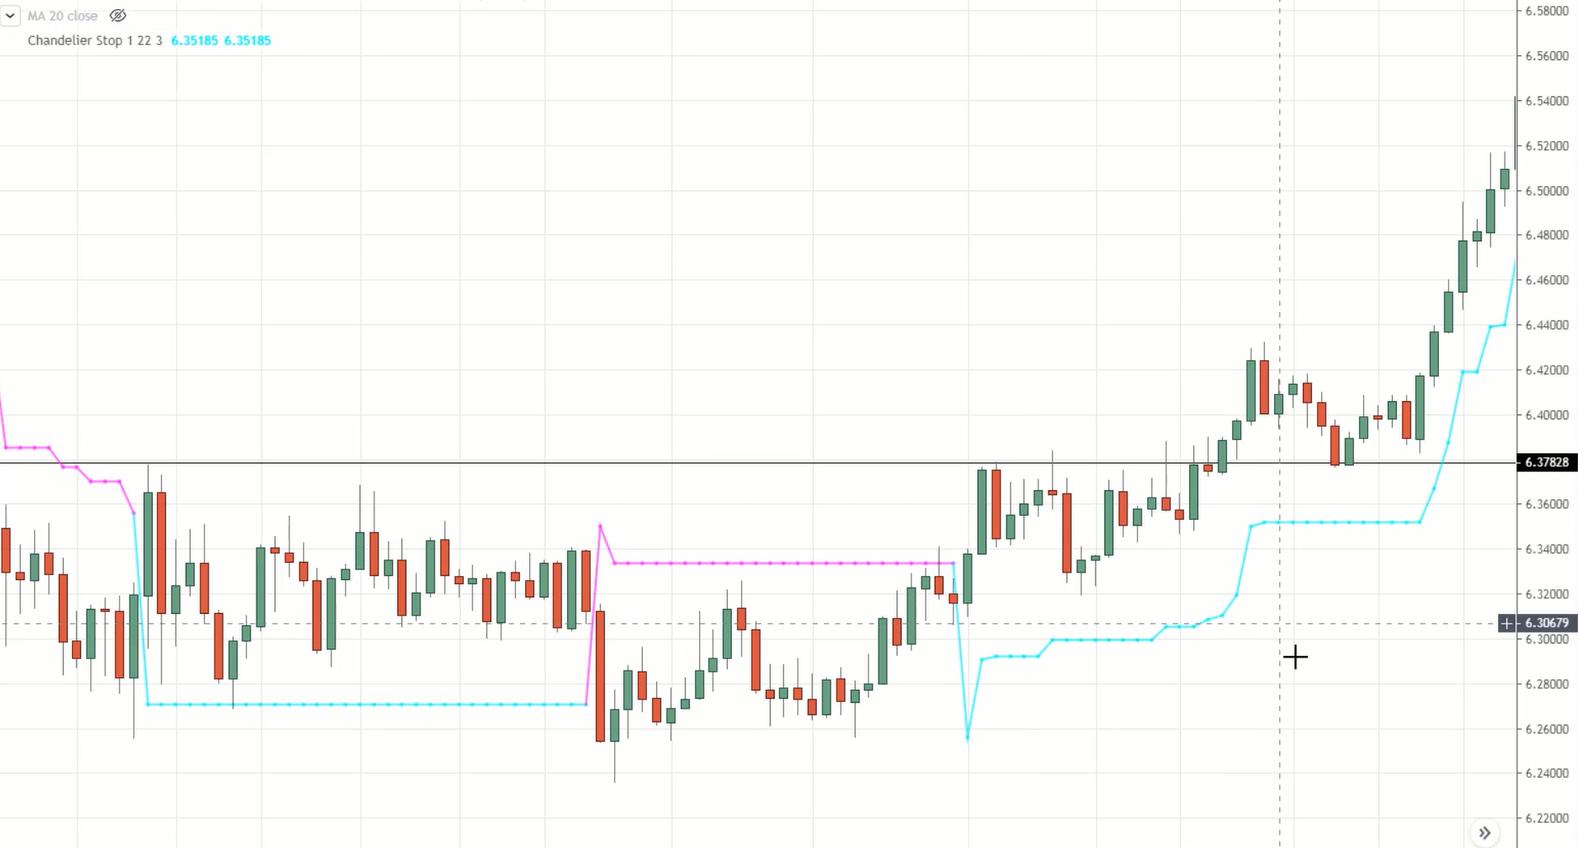
And you’ll only exit the trade when the price closes below the chandelier stop, which happened over here.
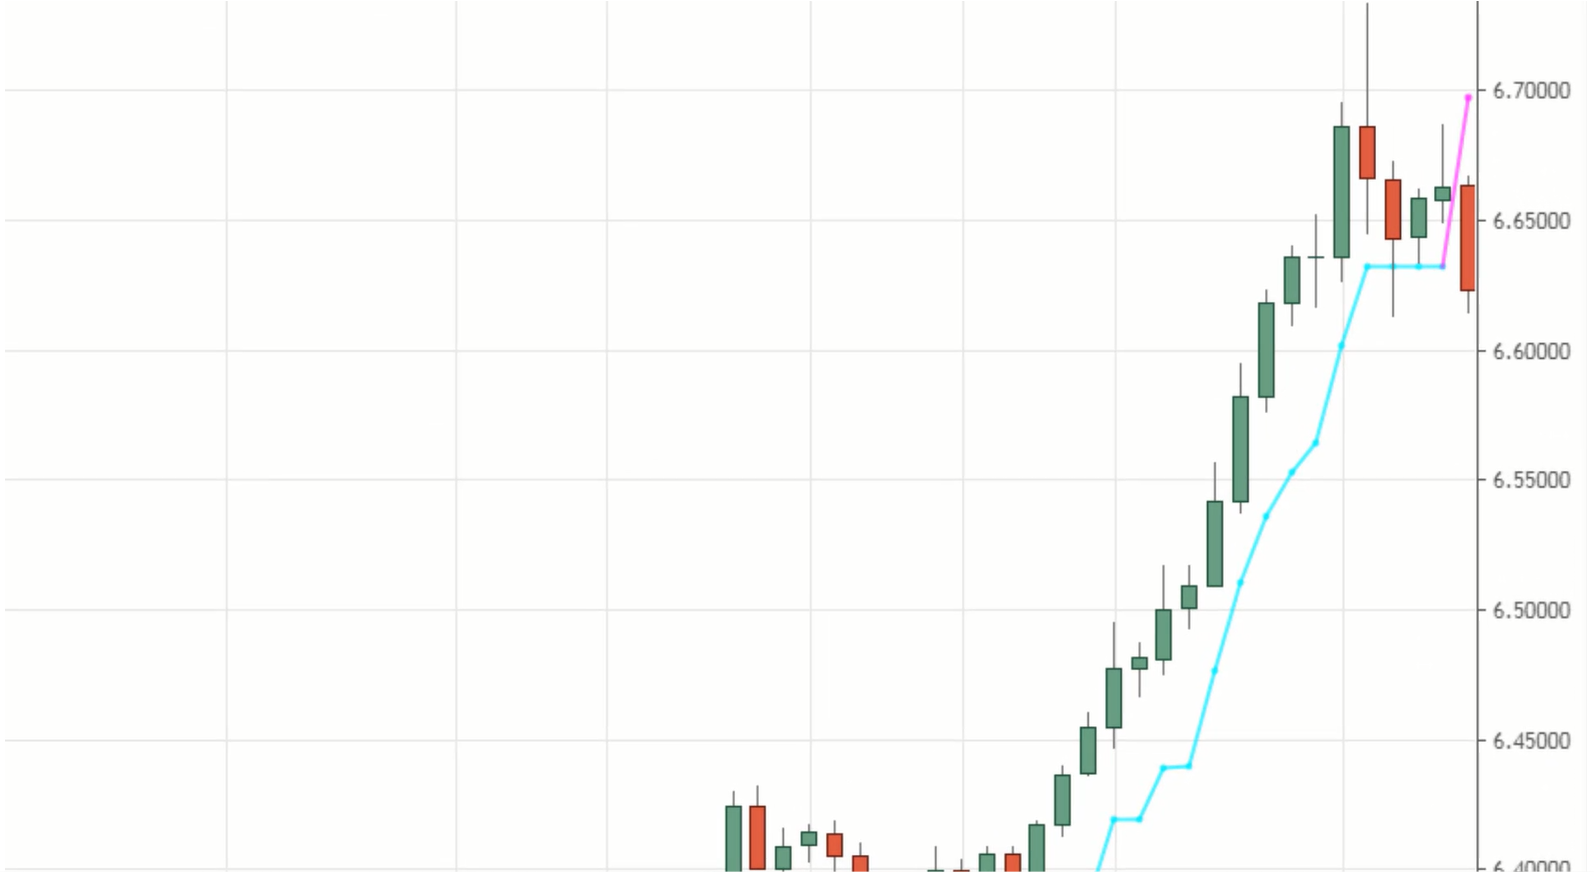
Yes, this is a winning trade and yes, I cherry-picked this example because it's much easier to illustrate the concept.
But this is how the trading strategy works.
Example #2 (NZD/JPY):
Firstly, we ‘re looking to identify a range of at least 80 candles.
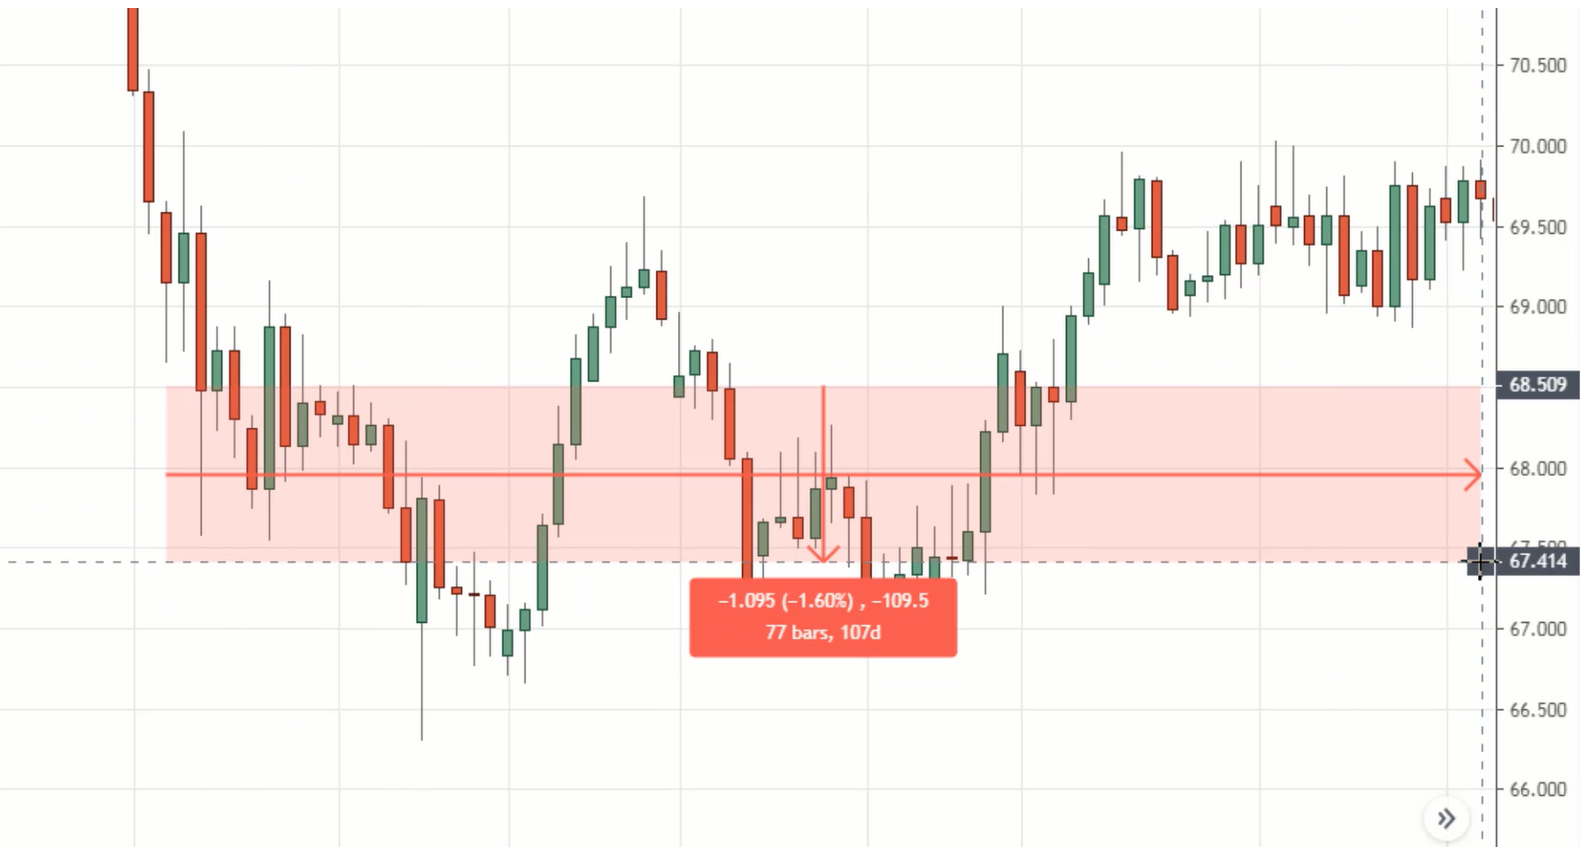
You can see that it's about 77 bar.
You might be thinking, “Oh no Rayner, this is not yet 80 bars. Can we still take this setup which has only 77 bar?”
Come on, don’t be anal. If it's just one, two bars or five bars of difference, just go with it.
The concept is what matters, not the exact setup or whatsoever.
The next thing is to identify the highs of resistance.
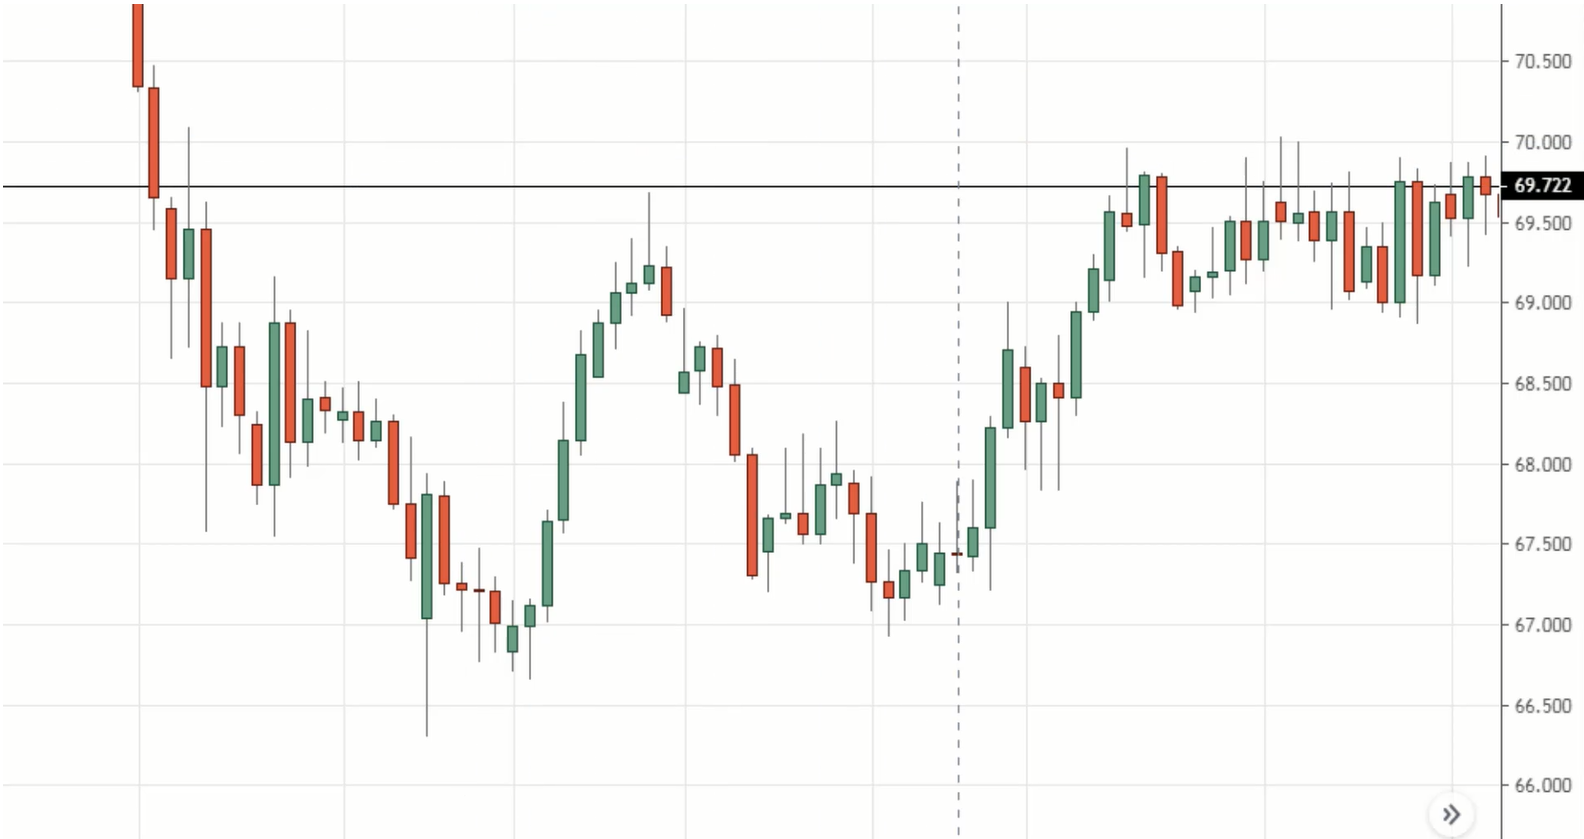
Thirdly, look for a buildup.
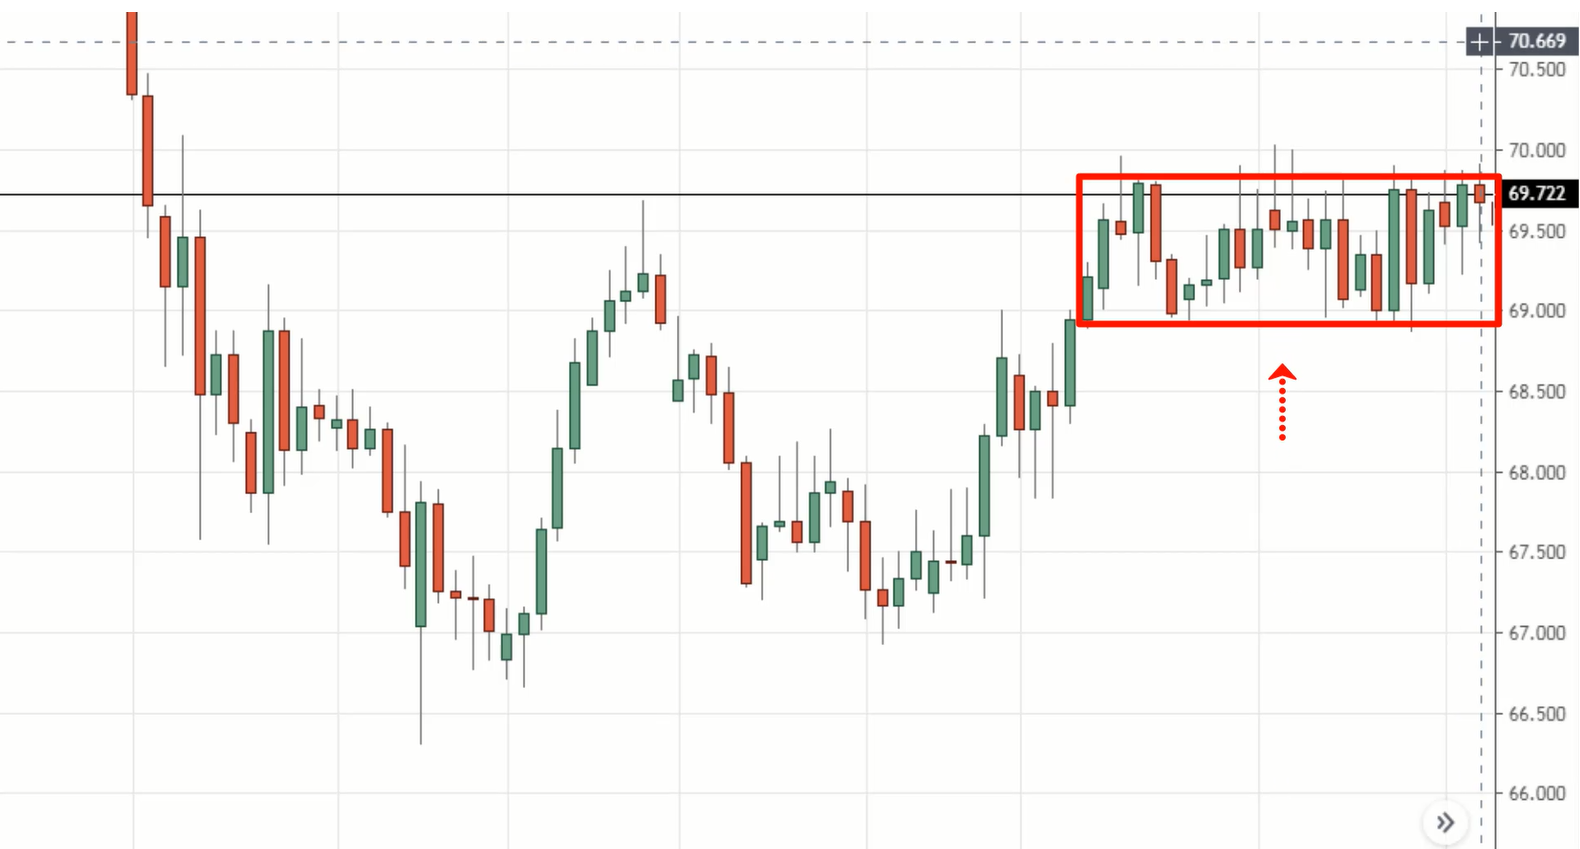
On hindsight, of course, it's going to be damn easy to look for a buildup. But in real-time, this is where things get tricky.
Let me just bring you back in time and imagine this.
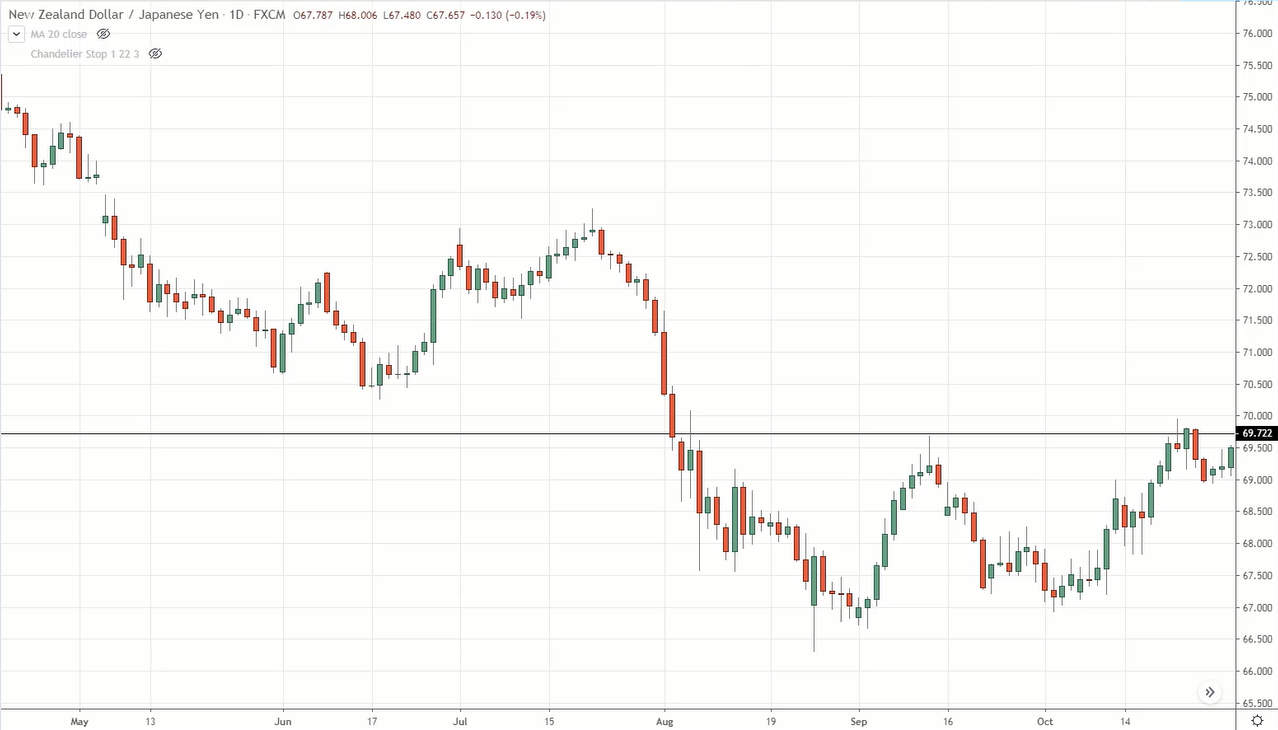
You might think that a potential buildup is forming already, and you might be anxious to simply buy the breakout of the highs.
But remember, you only want to enter the trade when the market is getting ready to breakout. And how do we know that the market is getting ready?
That's where the 20 MA comes into play – when the 20 MA touches the lows of the price.
And for that to happen, the market has to consolidate for a period of time. That means that the buildup has to last for a while.
So if you pull out the 20 MA, you can see that the lows of this pullback are still quite a distance away from the 20 MA.
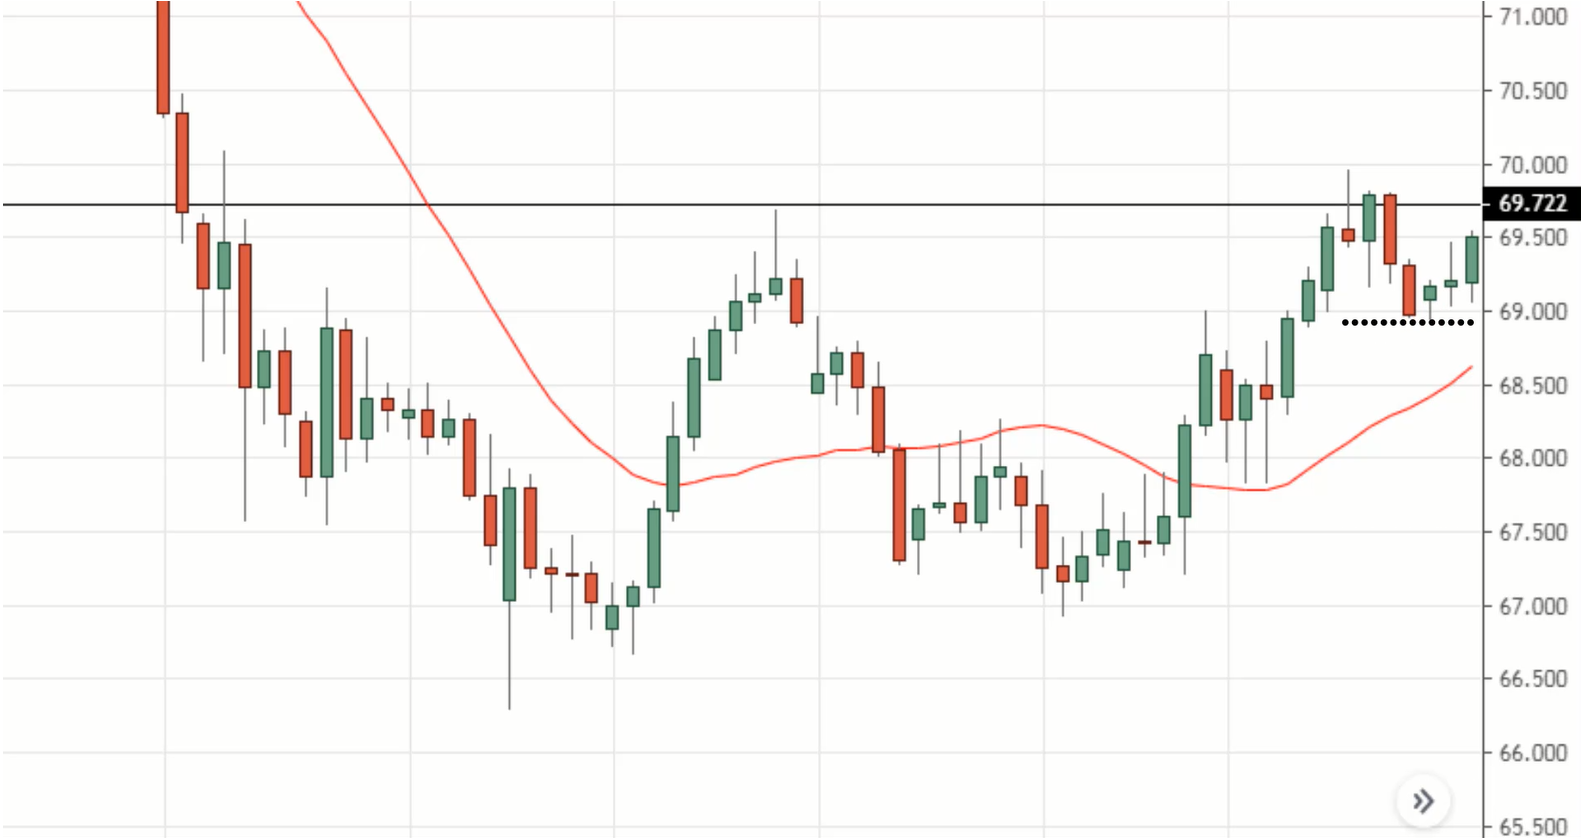
So this tells you that, nope it’s not time to enter your trade yet. You want the 20 MA to touch the lows of the buildup.
And if you go forward in time, over here, the 20 MA has touched the lows of the buildup.
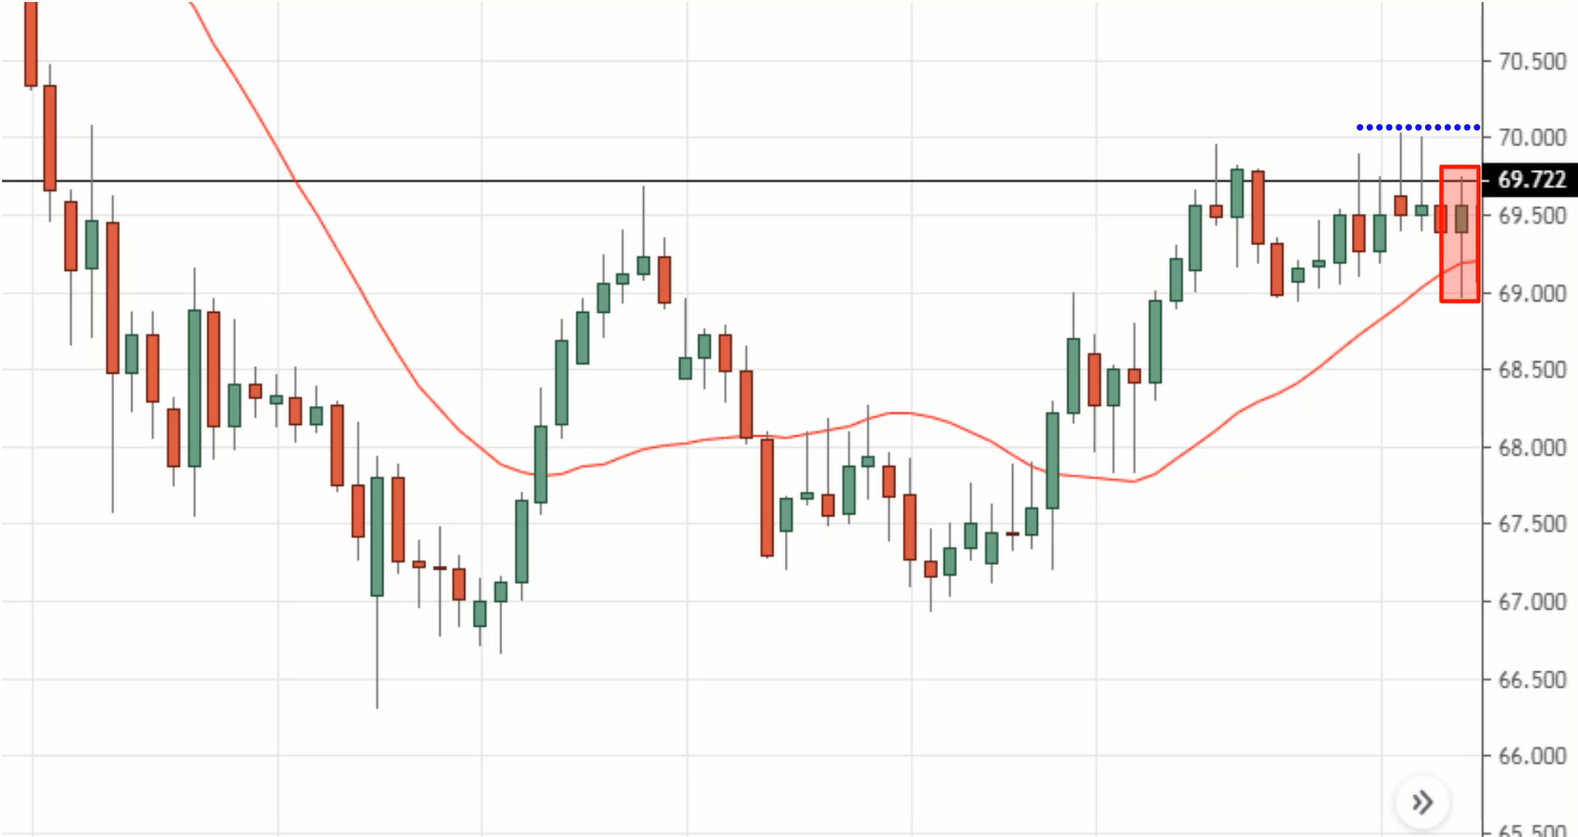
Now we can conclude that this market is getting ready to make a breakout and that's when you’ll place your buy stop order above the highs with 3 ATR trailing stop loss.
Yes, the market did chop the 20 MA for a while before the breakout, but it doesn't really matter.
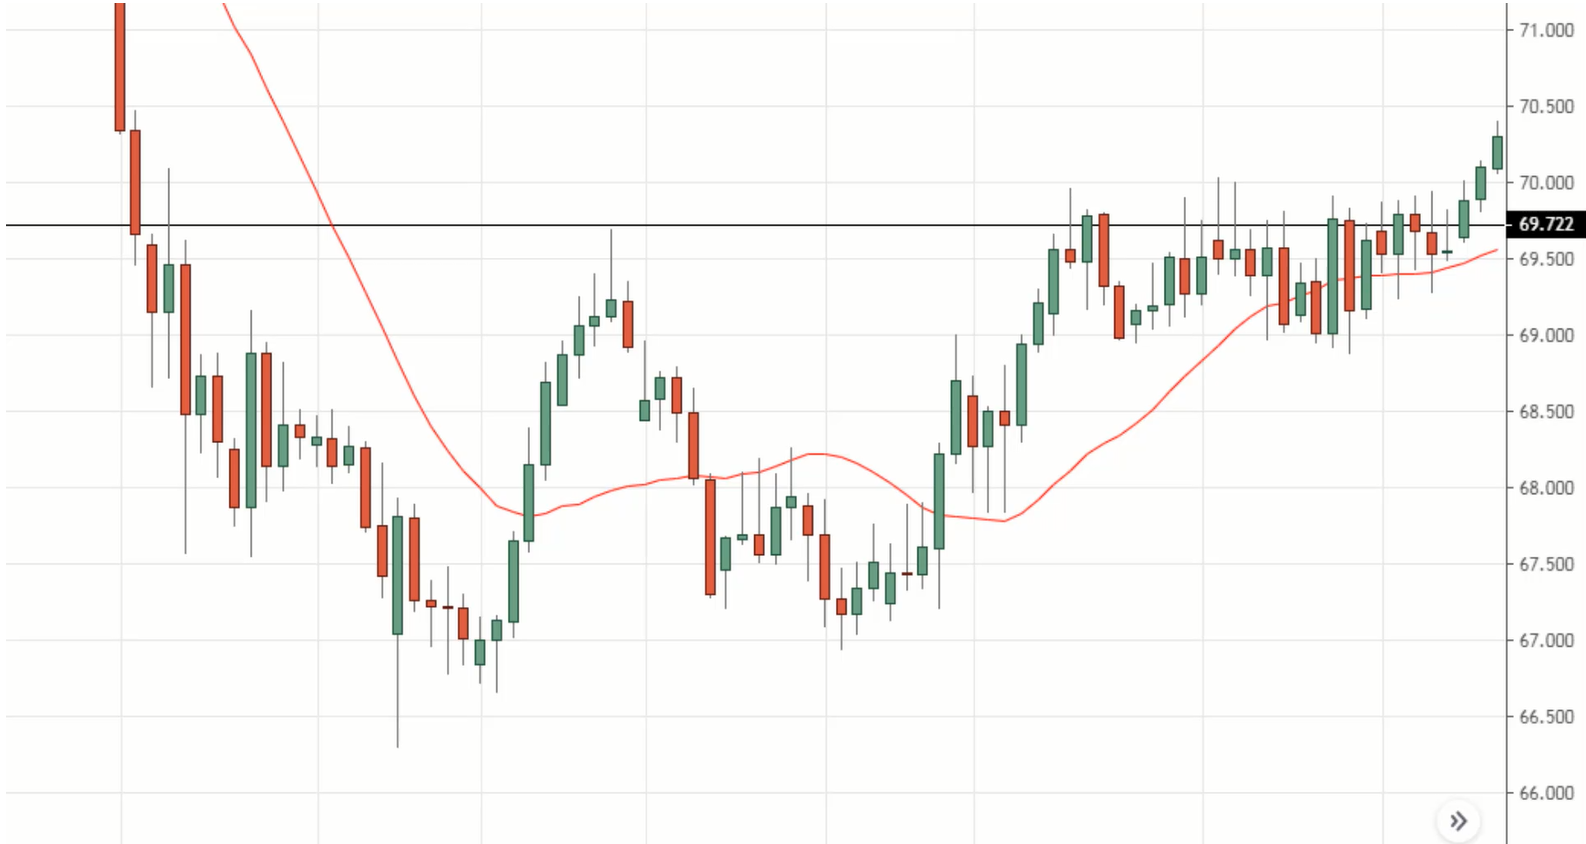
The main thing that you’re looking for, is a nice and tight buildup. The tighter it is the better.
And when the market breaks out, you’ll use the chandelier stop to trail your stop loss.
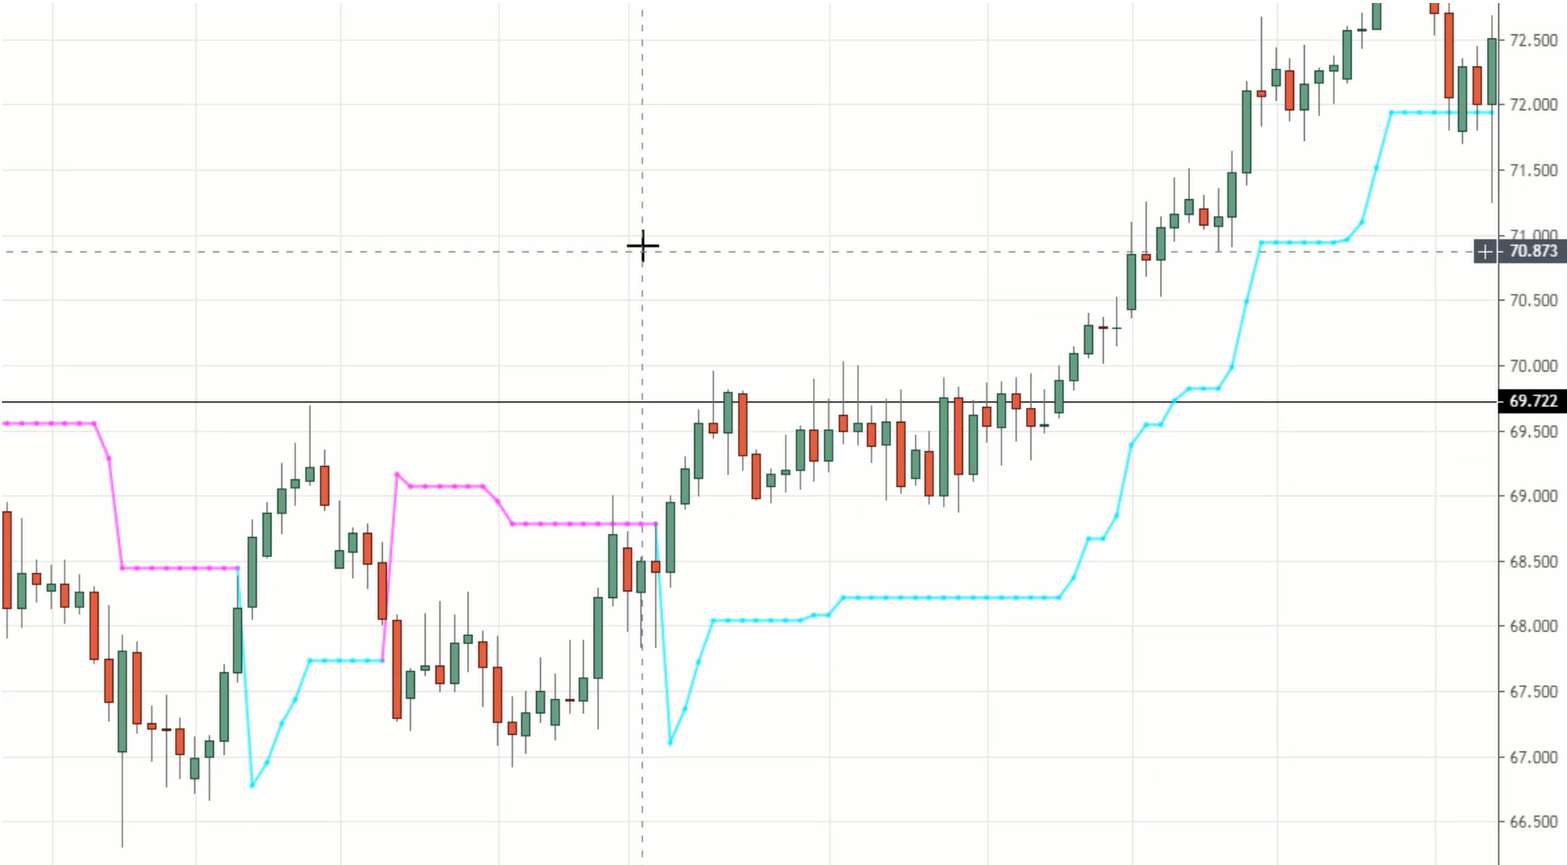
This blue line will move higher as the price moves higher. And you'll only exit the trade when the price breaks and closes below it.
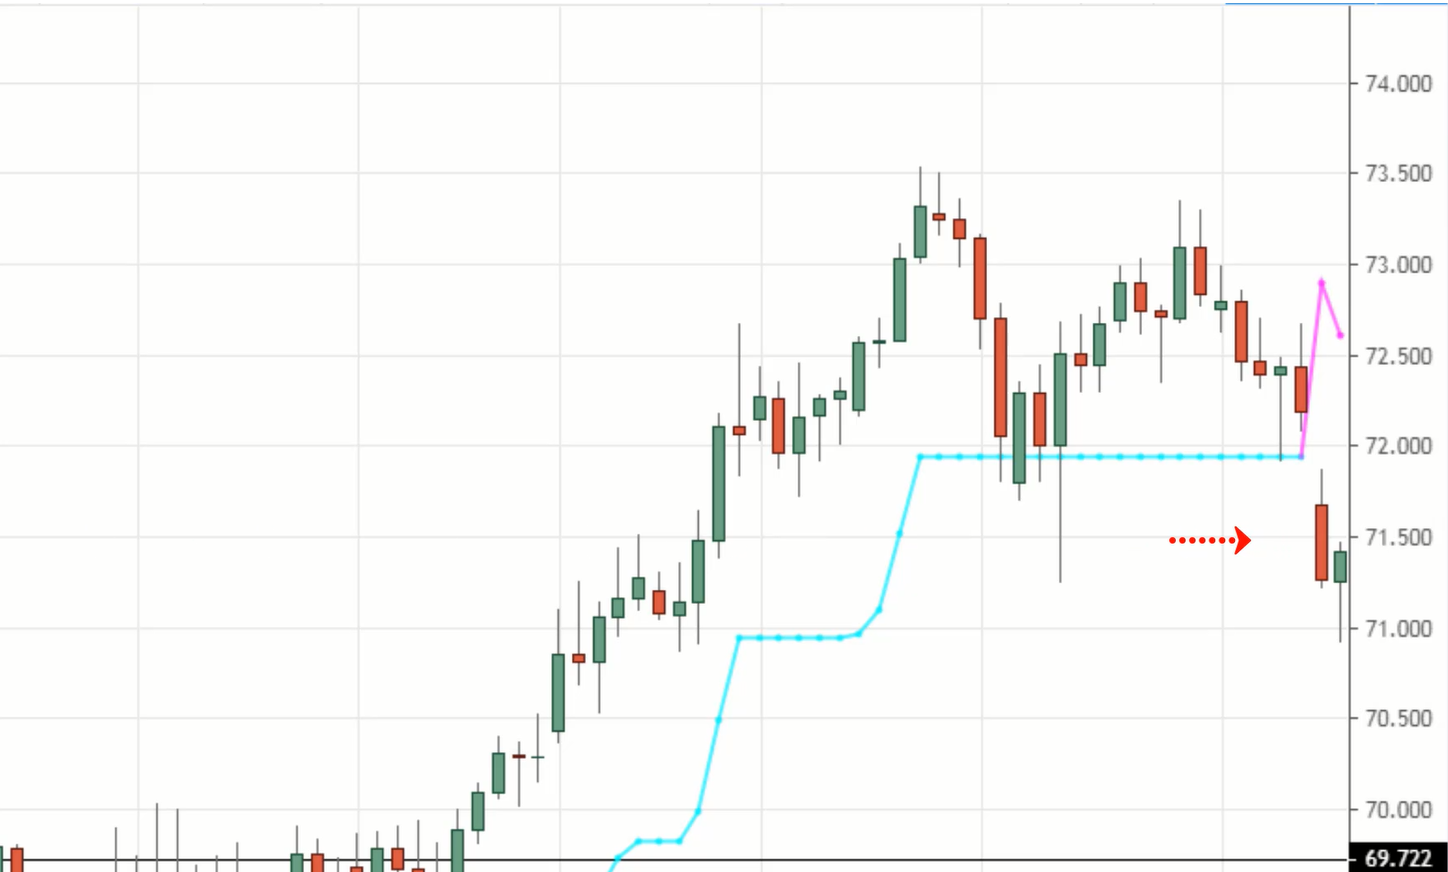
The whole chandelier stop would kind of look distorted and you’ll know it's time to exit your trade.
Example #3 (EUR/USD):
So firstly, look for a range market which is at least 80 candles wide.
Then identify the highs of resistance.
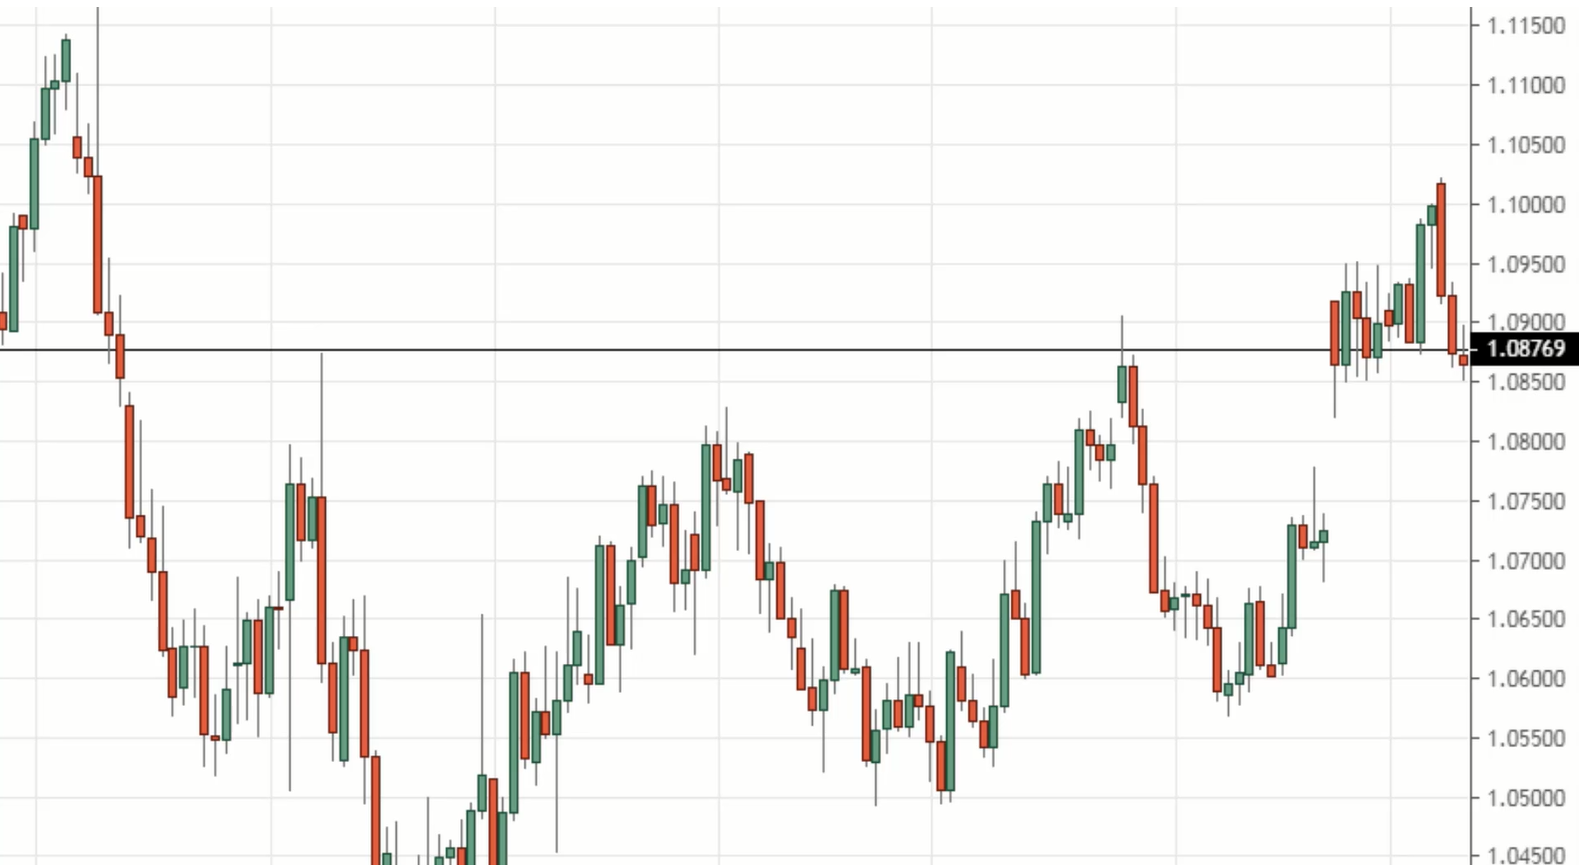
This example is a little bit different because you’ll notice that the buildup is actually formed outside of resistance.
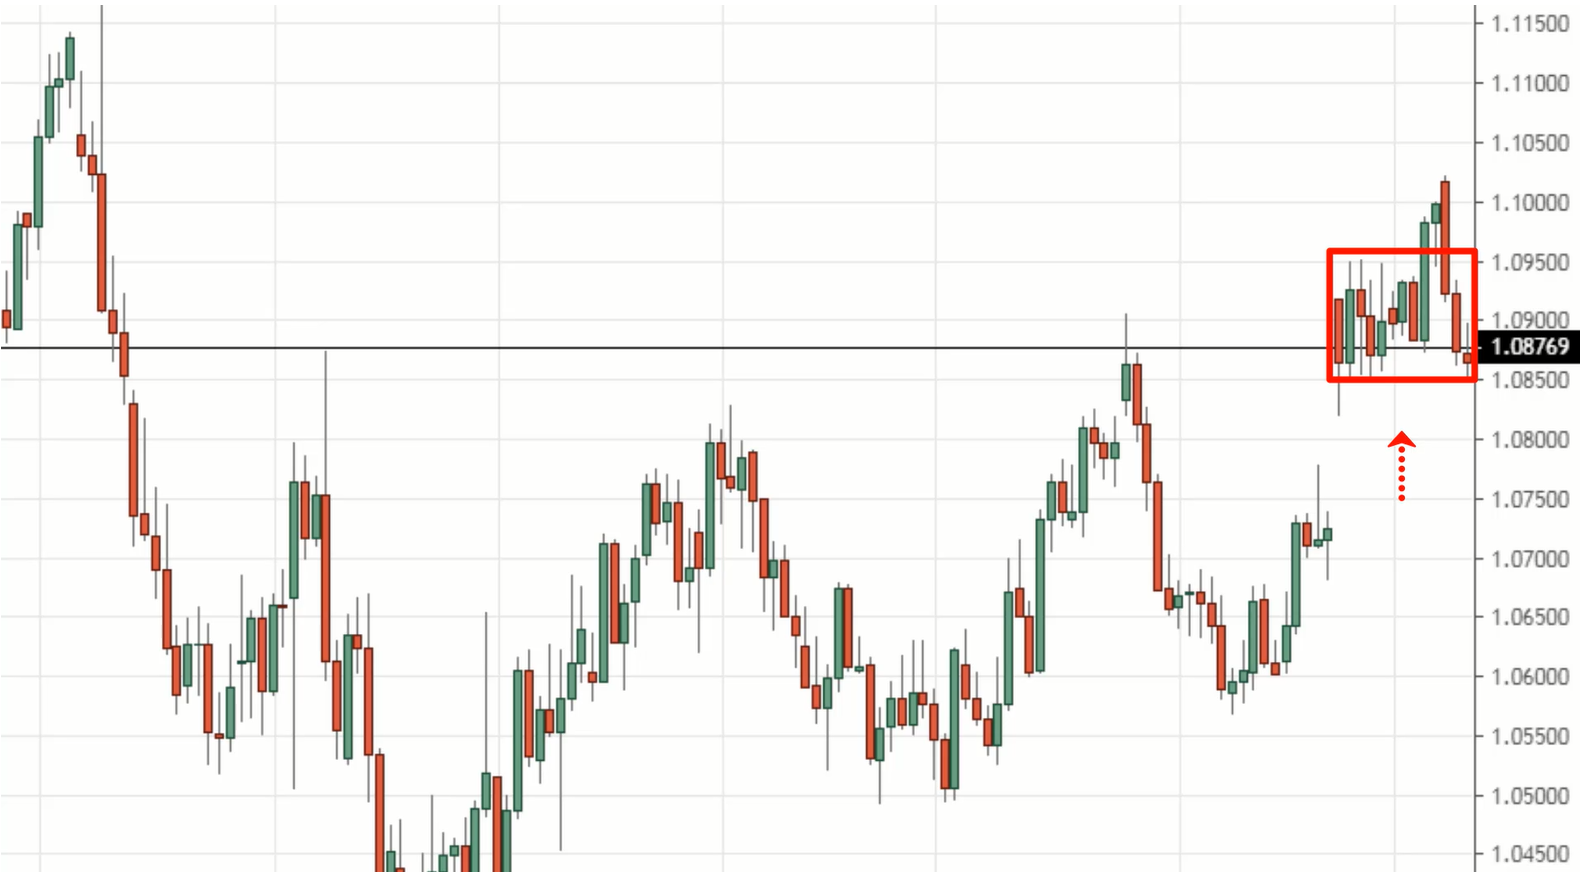
For the earlier examples, the buildup we formed before resistance, before the breakout.
But this one seems to hit resistance, breaks out of resistance, and then it forms a buildup. And this is fine as well.
The next thing you're looking for is to wait for the 20 MA to touch the lows of the buildup.
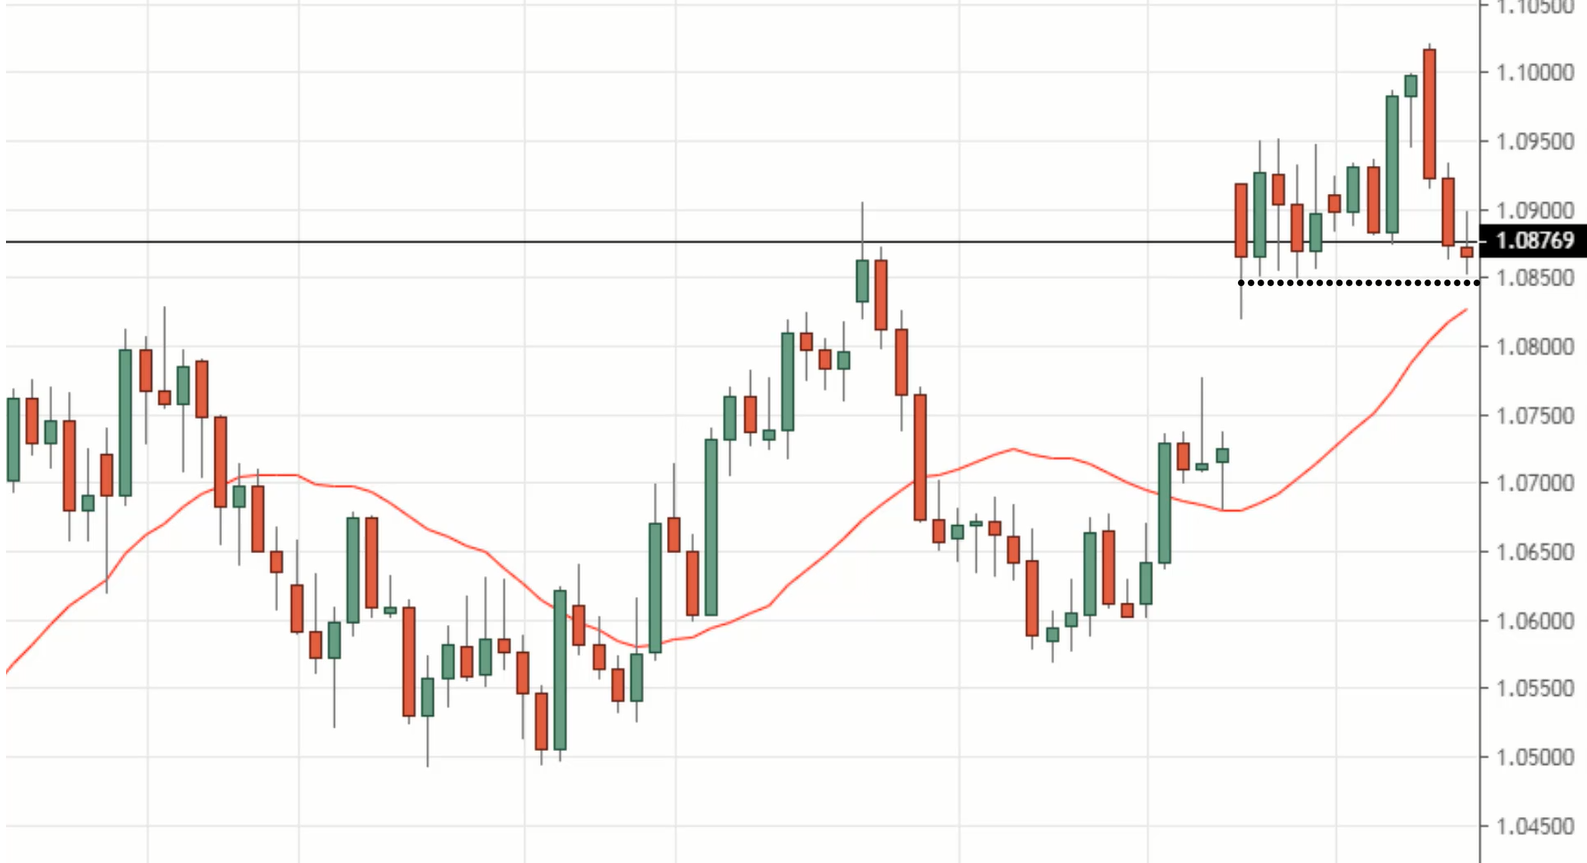
At this point, the 20 MA has not touched the lows of the buildup so it's not ready to breakout yet.
It did finally touch the lows of the buildup over here and you can place a buy stop order above the highs.
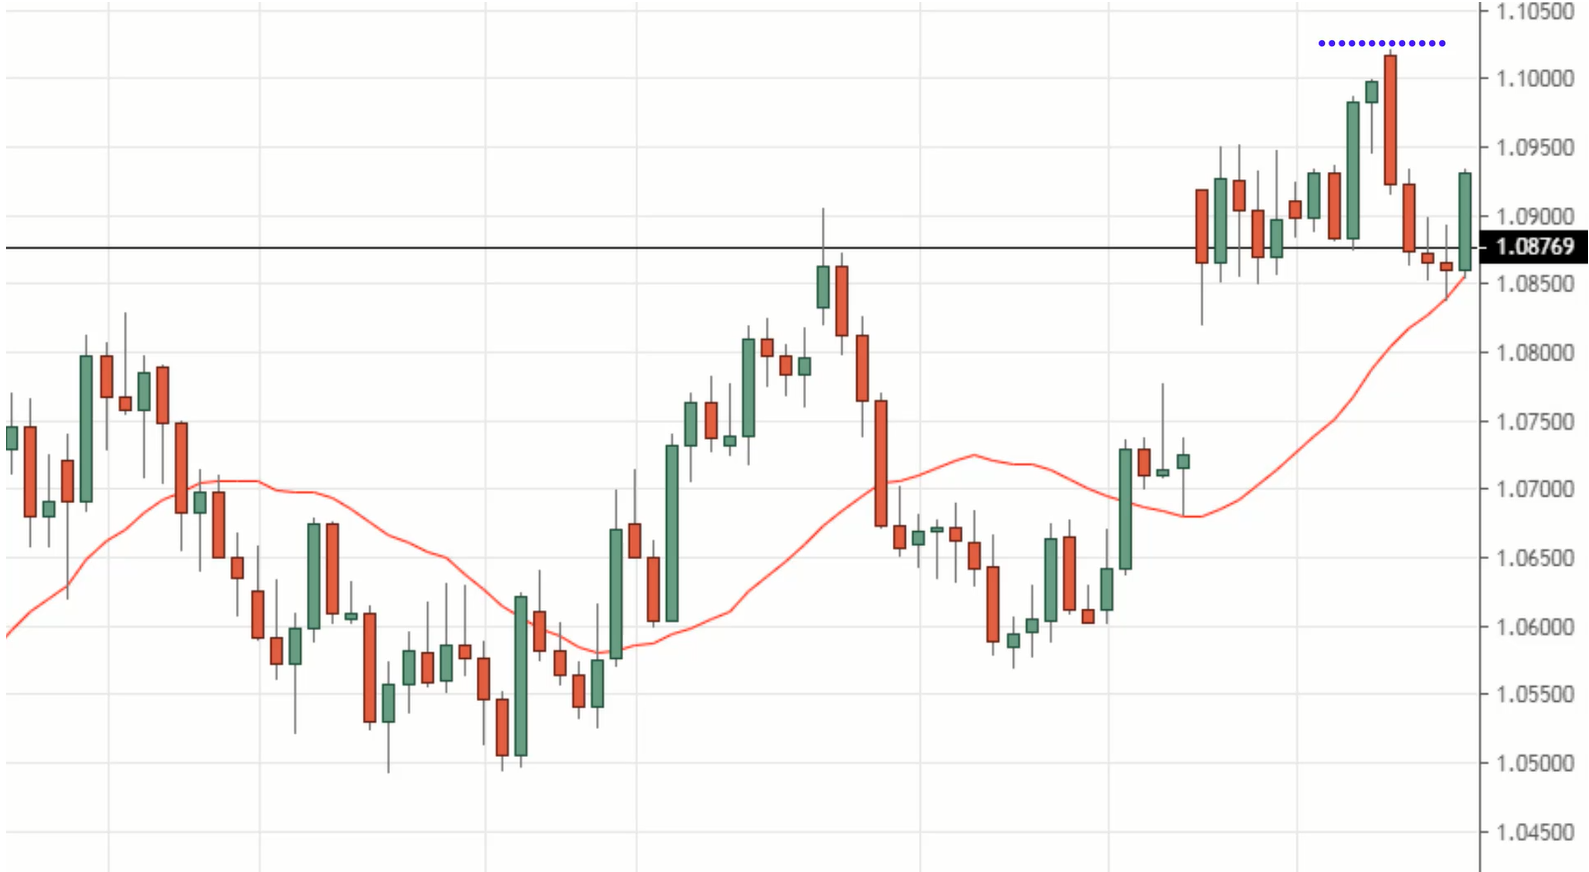
And then use 3 ATR as your trailing stop loss to ride the trend.
Moving on…
Tweaks and modifications
This BWAB trading strategy is not cast in stone.
It doesn't mean that you have to follow the exact rules that I've shared with you. No, that's not how it works.
And I don't want your trading strategy to just be replicated exactly according to what I teach. I want you to think on your own.
There are a couple of things that you can consider modifying.
1. Adjust the trailing stop loss
If you're going to capture a longer-term trend, then you can use 4 or 5 ATR as your trailing stop loss.
But bear in mind that with a wide trailing stop loss, your position size on a trade must be reduced accordingly if you still want to maintain your 1% risk on this trade.
2. You can go with an early exit
This technique allows you to reduce the size of your losses.
Let me explain how this works.
Have a look at the USD/TRY.
Let’s say your buy stop order is the above the previous highs (at the blue dotted line) and your stop loss is below the buildup (at the red dotted line).
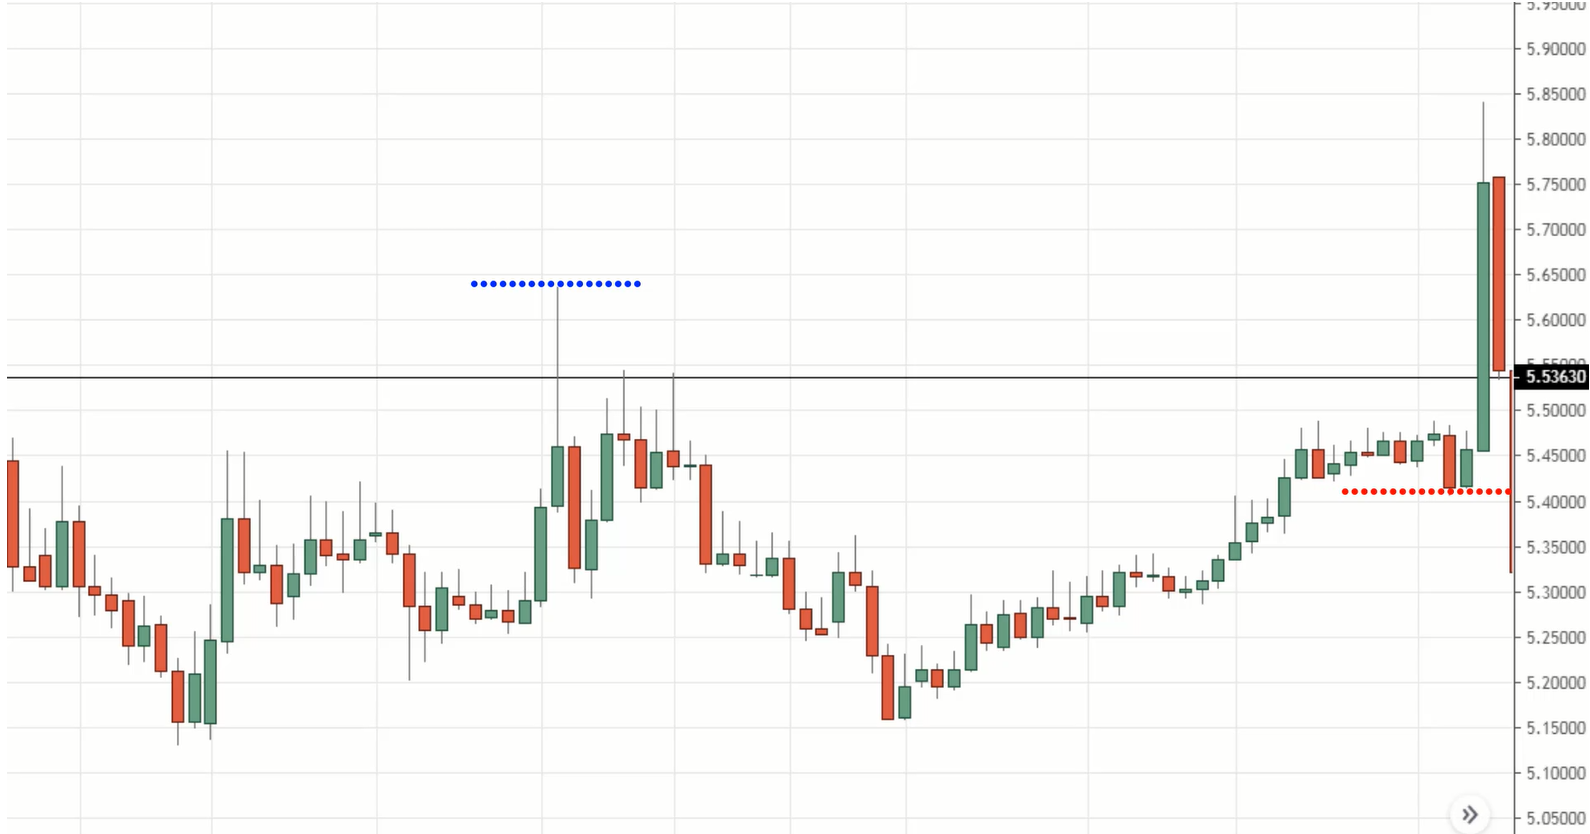
It actually did a false breakout before the market reverses back against you.
At this point, it might not have hit your trailing stop loss yet, but you could exit this trade earlier to reduce the size of your losses.
So instead of letting the market hit your stop loss fully, you can exit ahead of time and reduce you reduce the size of your stop loss to be near 0.5 or 0.6 R of loss or 0.6.
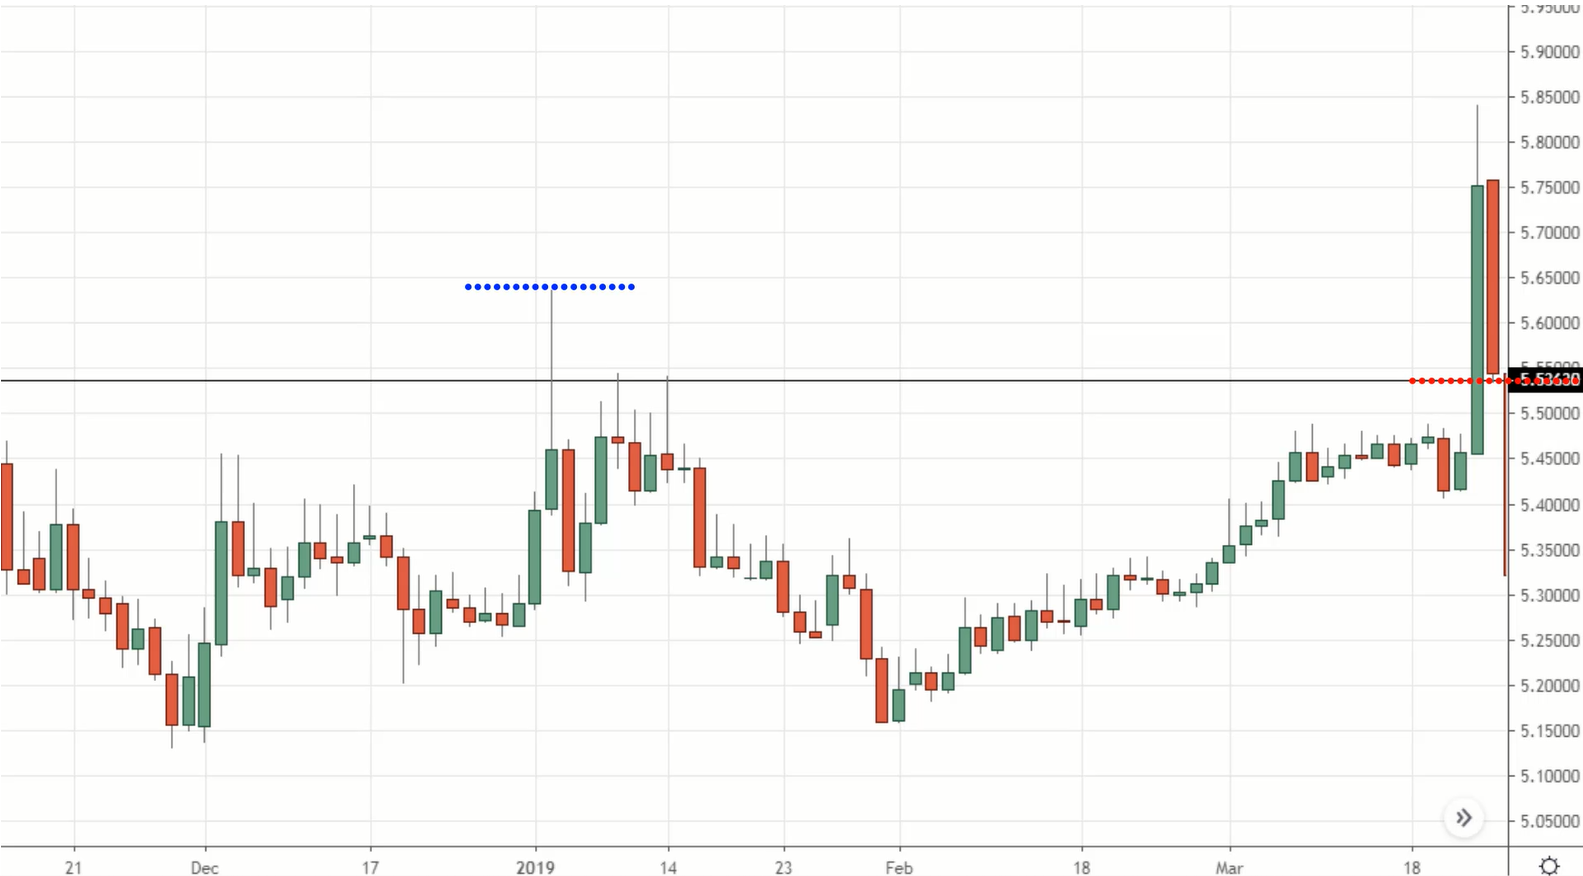
However, the downside to this technique is that if the market does reverse up higher, you would have exited the trade prematurely. That's the downside to it.
My suggestion is that if you want to use this early exit technique, then you can also be prepared to re-enter the trade. Because it could be just a shakeout to catch the weak holders.
So if the market does break back above the new swing high (blue dotted line), you’ll re-enter back into the trade and you have your trailing stop loss (red dotted line) set again.
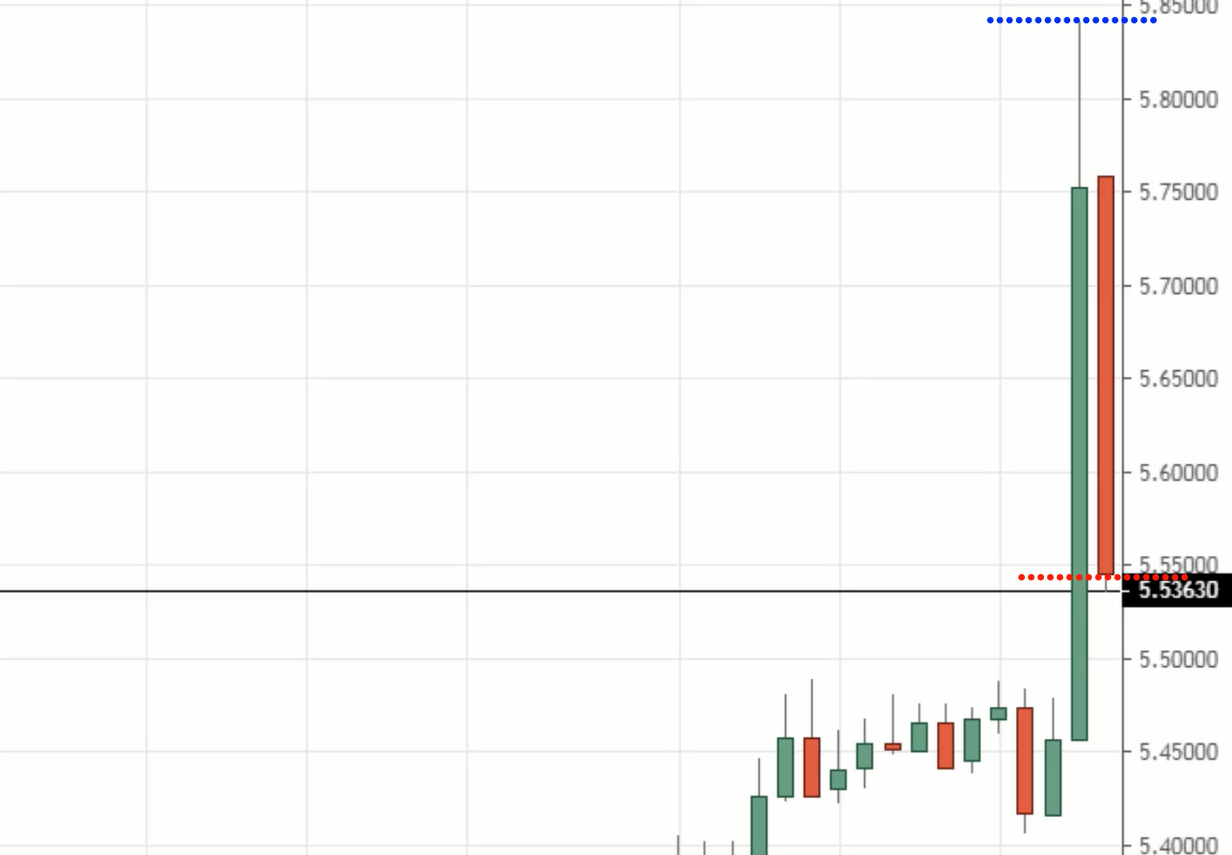
This is kind of like an insurance just in case the trend becomes a full-blown trend, then at least you can hop on board the trade.
For me personally, I just do this a maximum of one time. I don't like to exit too many times.
If there's an early exit, I'll try to get back into the trade one more time if the market does breakout above this swing high.
Next…
3. Pre-breakout technique
Imagine this, wouldn't it be great if you could enter the trade before the breakout occurs?
Is it possible? Yes, actually.
And I want to share this technique with you called the pre-breakout technique.
To execute this technique, you need to use multiple frames.
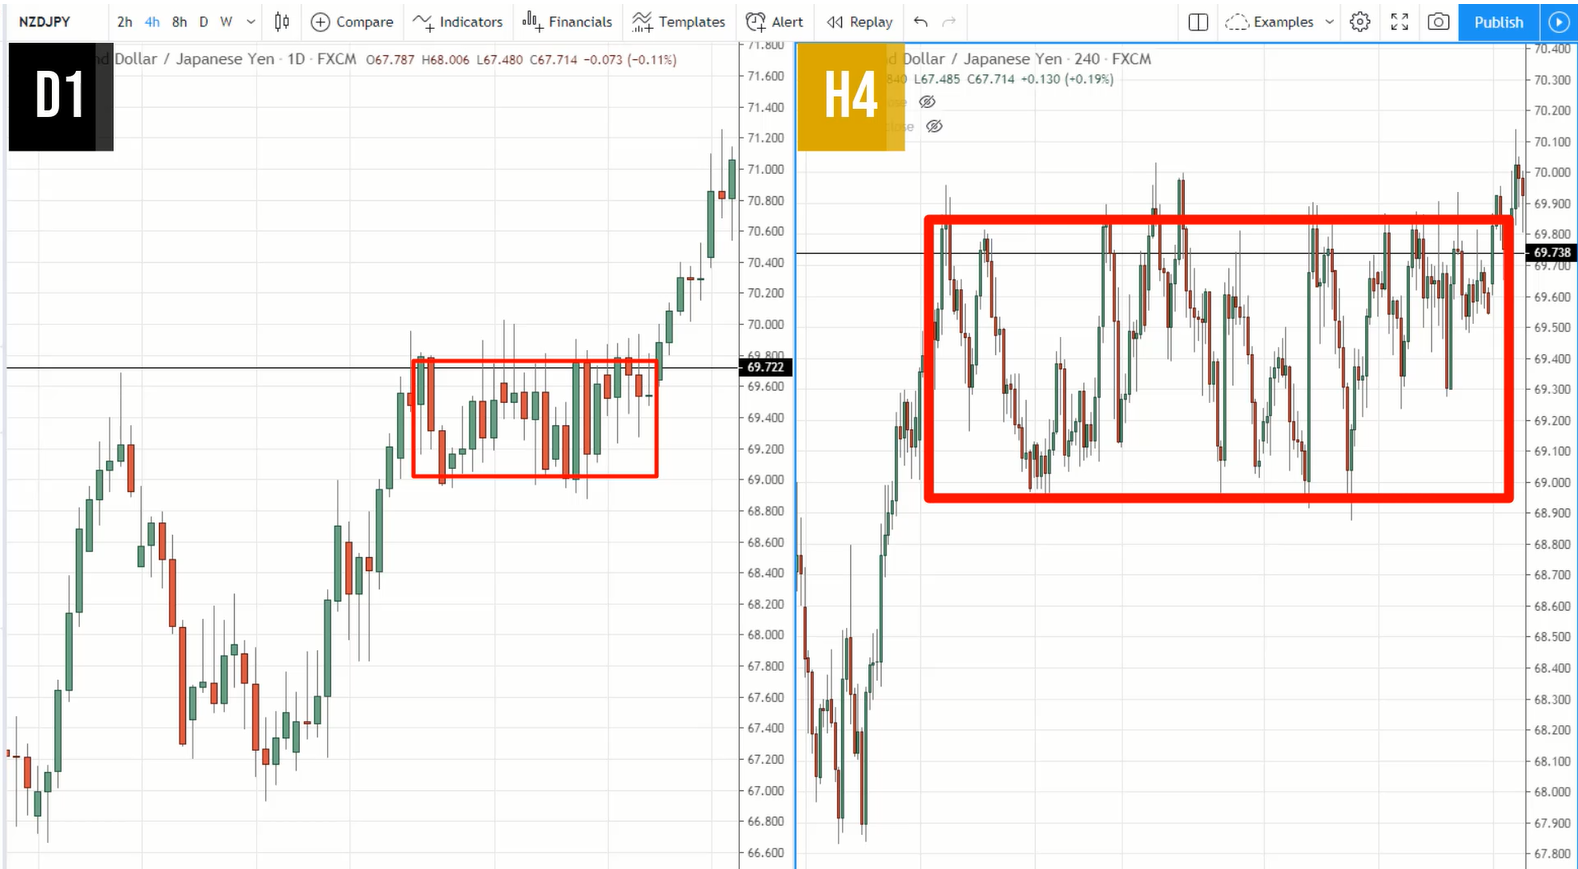
What you're looking for is a false break setup on the lower timeframe, the false break setup at the lows of support.
In other words, you're looking for a rejection of lower prices at support, which is over here.
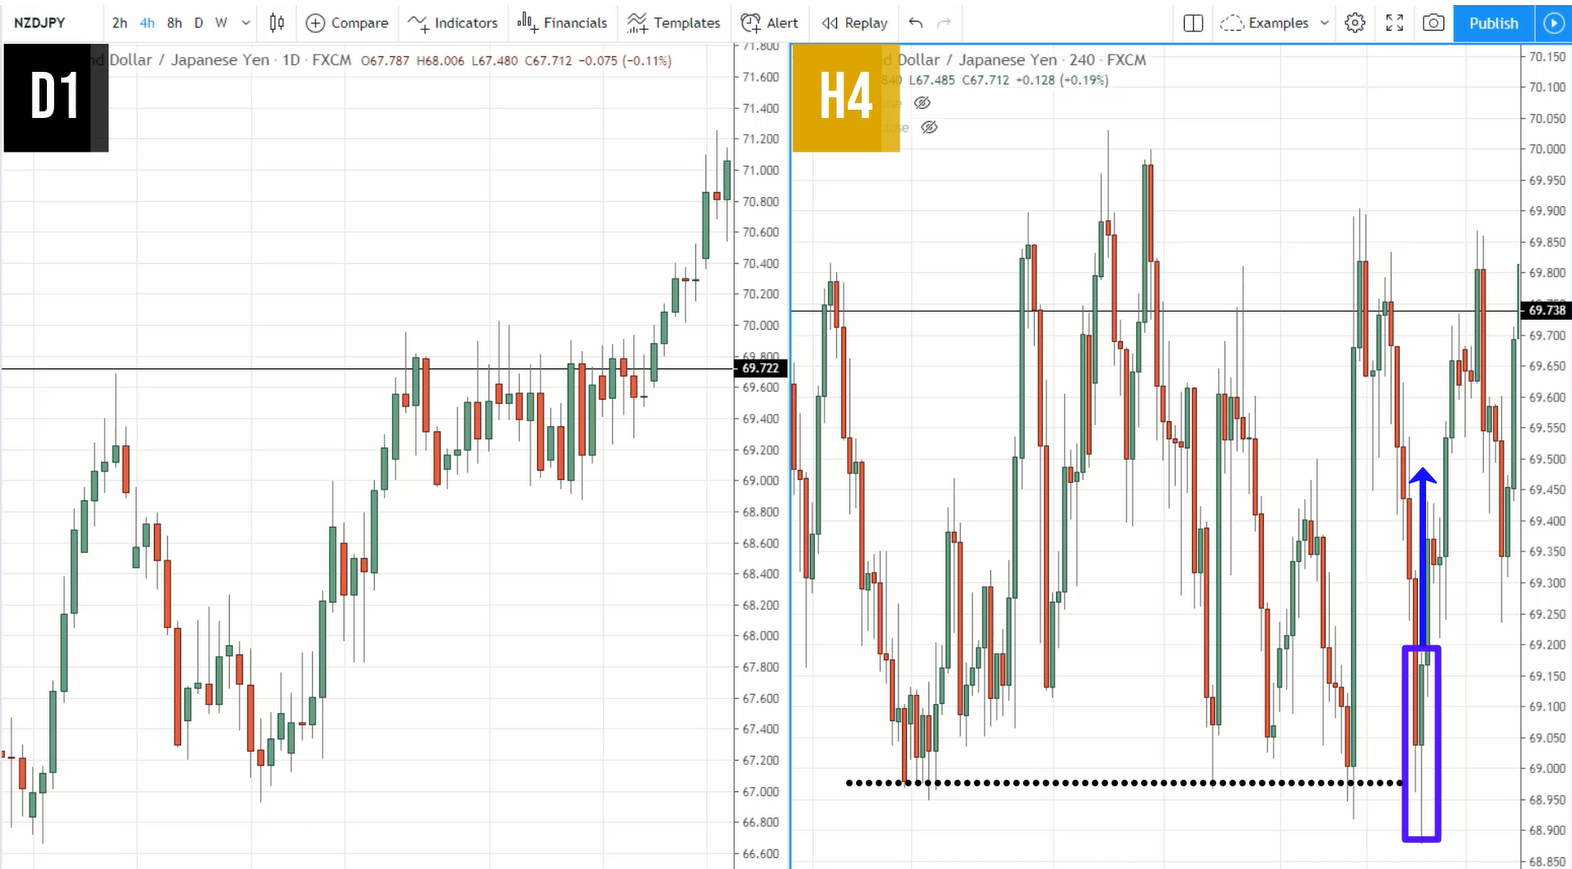
We have this price rejection where the price heads down lower into support but closes bullishly back into the range. This is what I call a false break setup.
And you can enter on the next candle’s open, with stop loss, 1 ATR below the lows.
If you look at it from the grand scheme of things, you're actually buying at the lows of the buildup over here. You're entering the breakout before the breakout.
The risk to reward is really favourable for you. This is an advanced technique, but do spend some time to understand this concept, how it works and it will pay off in the long run.
Pros & cons
Pros:
You have low risk and pretty high reward because if it becomes a full-blown trend, you can ride the trend, and the risk to reward is favourable at 1:3 or even more.
Cons:
For the BWAB trading strategy, there are very few trading opportunities.
Let's say you only trade the forex markets on a daily timeframe. You won't have many trading opportunities in a year.
So it's important that if you want to trade this strategy, it’s best to diversify and look into the stock and futures markets as well so you’ll have more trading opportunities.
And again, the concept is the same.
Here’s a quick recap…
Recap
- The BWAB trading strategy
- Tweaks to the BWAB trading strategy: trailing stop loss, early bailout, pre-breakout
That’s all, and with that said, I will talk to you soon.
