#11: Professional Price Action Trading Strategies
Lesson 11
Hey, hey, what’s up my friend?
Here's the thing…
When it comes to price action trading, most traders will buy at support and sell at resistance, or wait for bullish candlestick patterns to form as confirmation, etc.
Now there's nothing wrong with that.
But if you want to level up your price action trading knowledge, you’ve got to be more versatile because price action trading is not just about buying support or selling resistance.
It's about trading reversals, buying breakouts, buying pullbacks, knowing when to stay in the markets and when to stay out of the markets.
And if those few concepts are something that you are not very familiar with, don't worry because in today's training, you'll discover:
- The false break technique and how to profit from trapped traders
- The buildup technique and how to identify high probability breakout trades that are likely to follow through
- How do you enter a breakout before the breakout
- The rubber band snap – how to avoid low-quality trades that have masked themselves as a high probability trading setup
Sounds good? Then let's get started.
The false break
This occurs when the price breaks above a significant high or low, only to reverse back in the opposite direction.
Let me illustrate to you what the false break looks like.
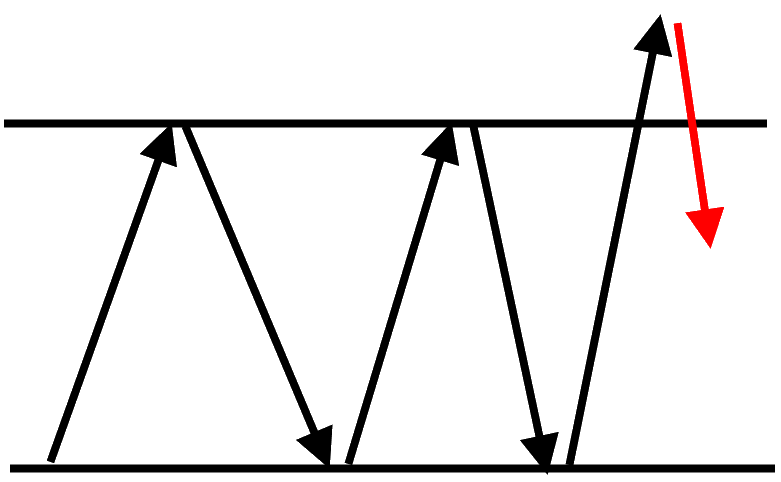
Let's say the market is in a range and forms a few highs. Now if the price takes out those highs of the range and then reverses down lower back into the range, that’s what I call a false break.
Why is it a false break? Because imagine this, when the price breaks above these highs or resistance, it will be breakout traders buying. They love to buy the breakout of the highs or short the lows.
And what happens when the price breaks out only to reverse back into the range? This becomes a false breakout, and those breakout traders who bought at the highs are now trapped.
They are in the reds because the price reversed and goes back into the range and they might get stopped out of their trade.
Some breakout traders might have their stop loss near resistance, middle of the range, or some conservative ones, would place their stop loss near the lows of the range.
Imagine if the price were to continue lower, these clusters of stop loss will get triggered and that will induce further selling pressure.
Because if you are a breakout trader who went long, your stop loss is a sell order. And if those sell order gets triggered, it will fuel more selling pressure. And this is what the false break technique is all about.
Let me share with you a few examples.
Example #1 (AUD/CAD):
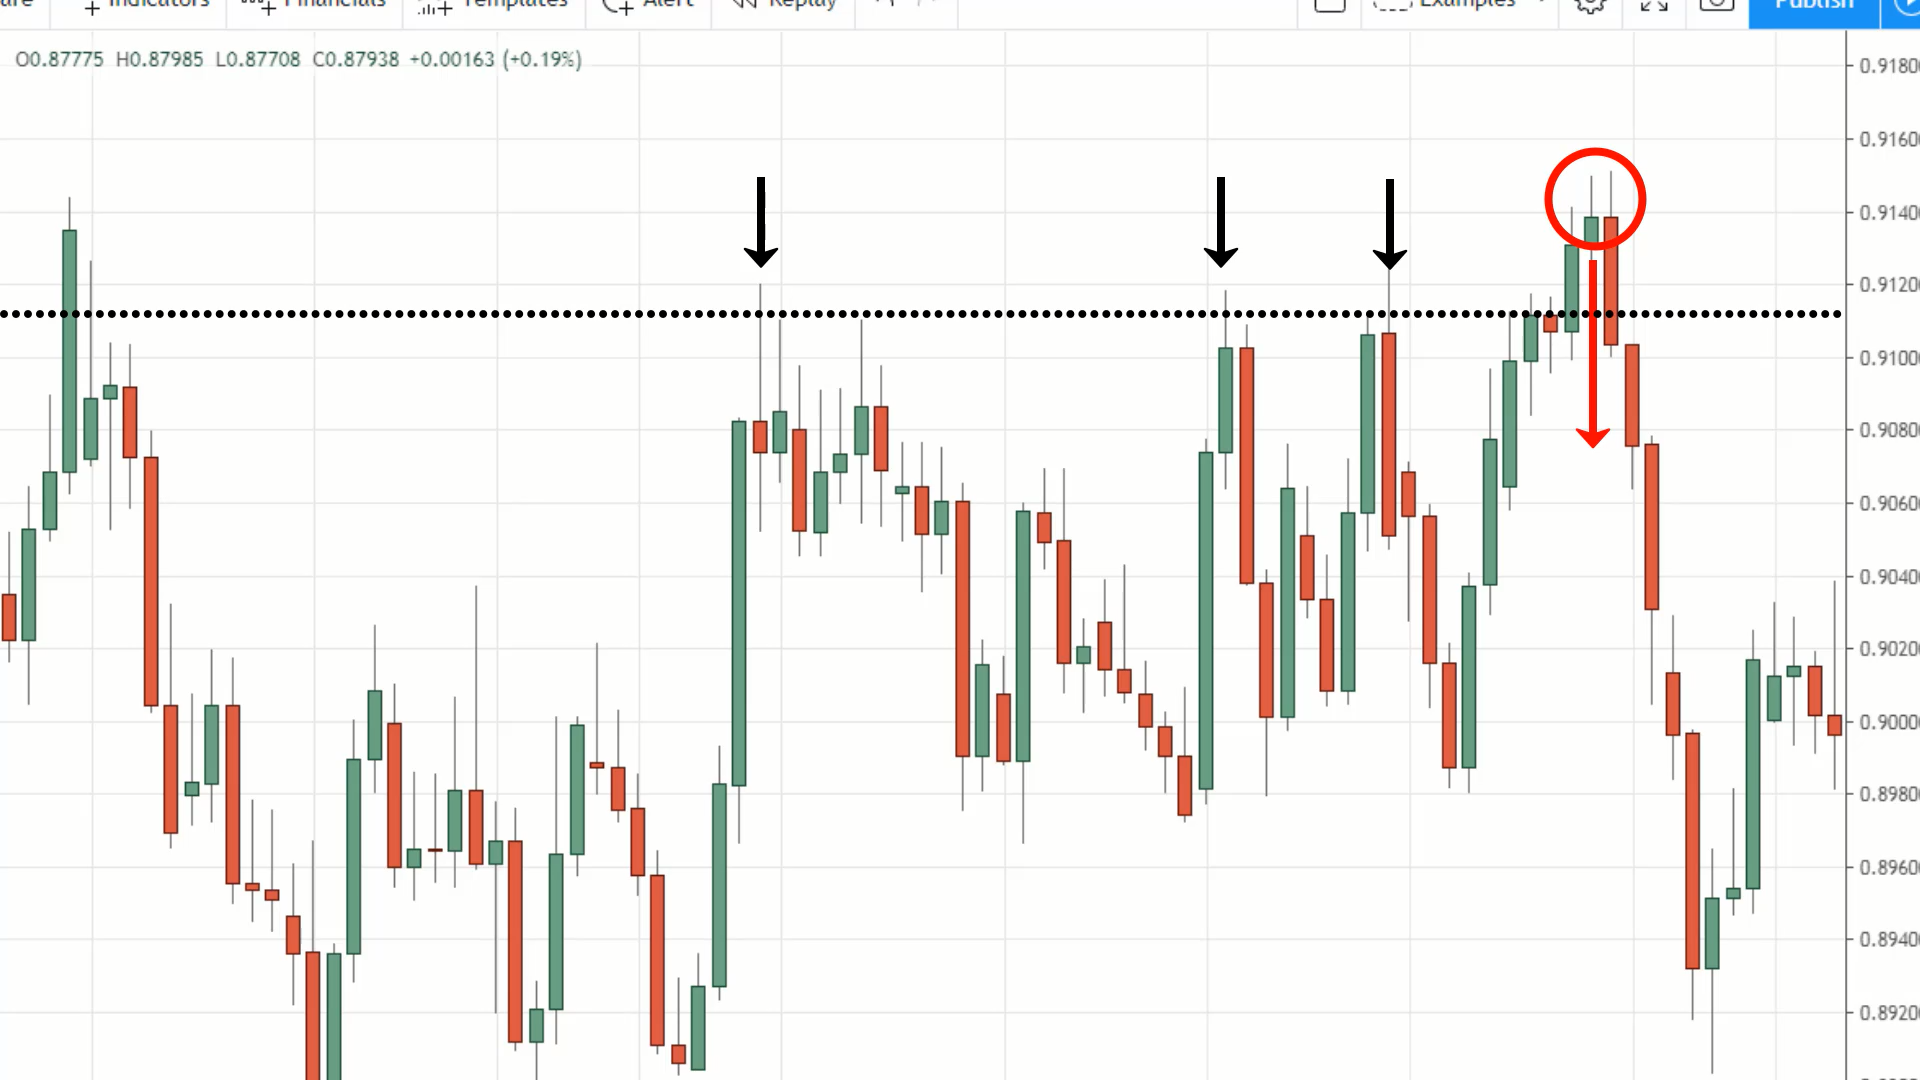
Notice how the price took out the previous highs only to make a huge sudden reversal lower enclose back within the range. This is what I call a false break. Traders who bought at the highs are now trapped and in the reds.
And imagine if you are the breakout trader, where will you set your stop loss? Well, I'm guessing they'll put them in these places:
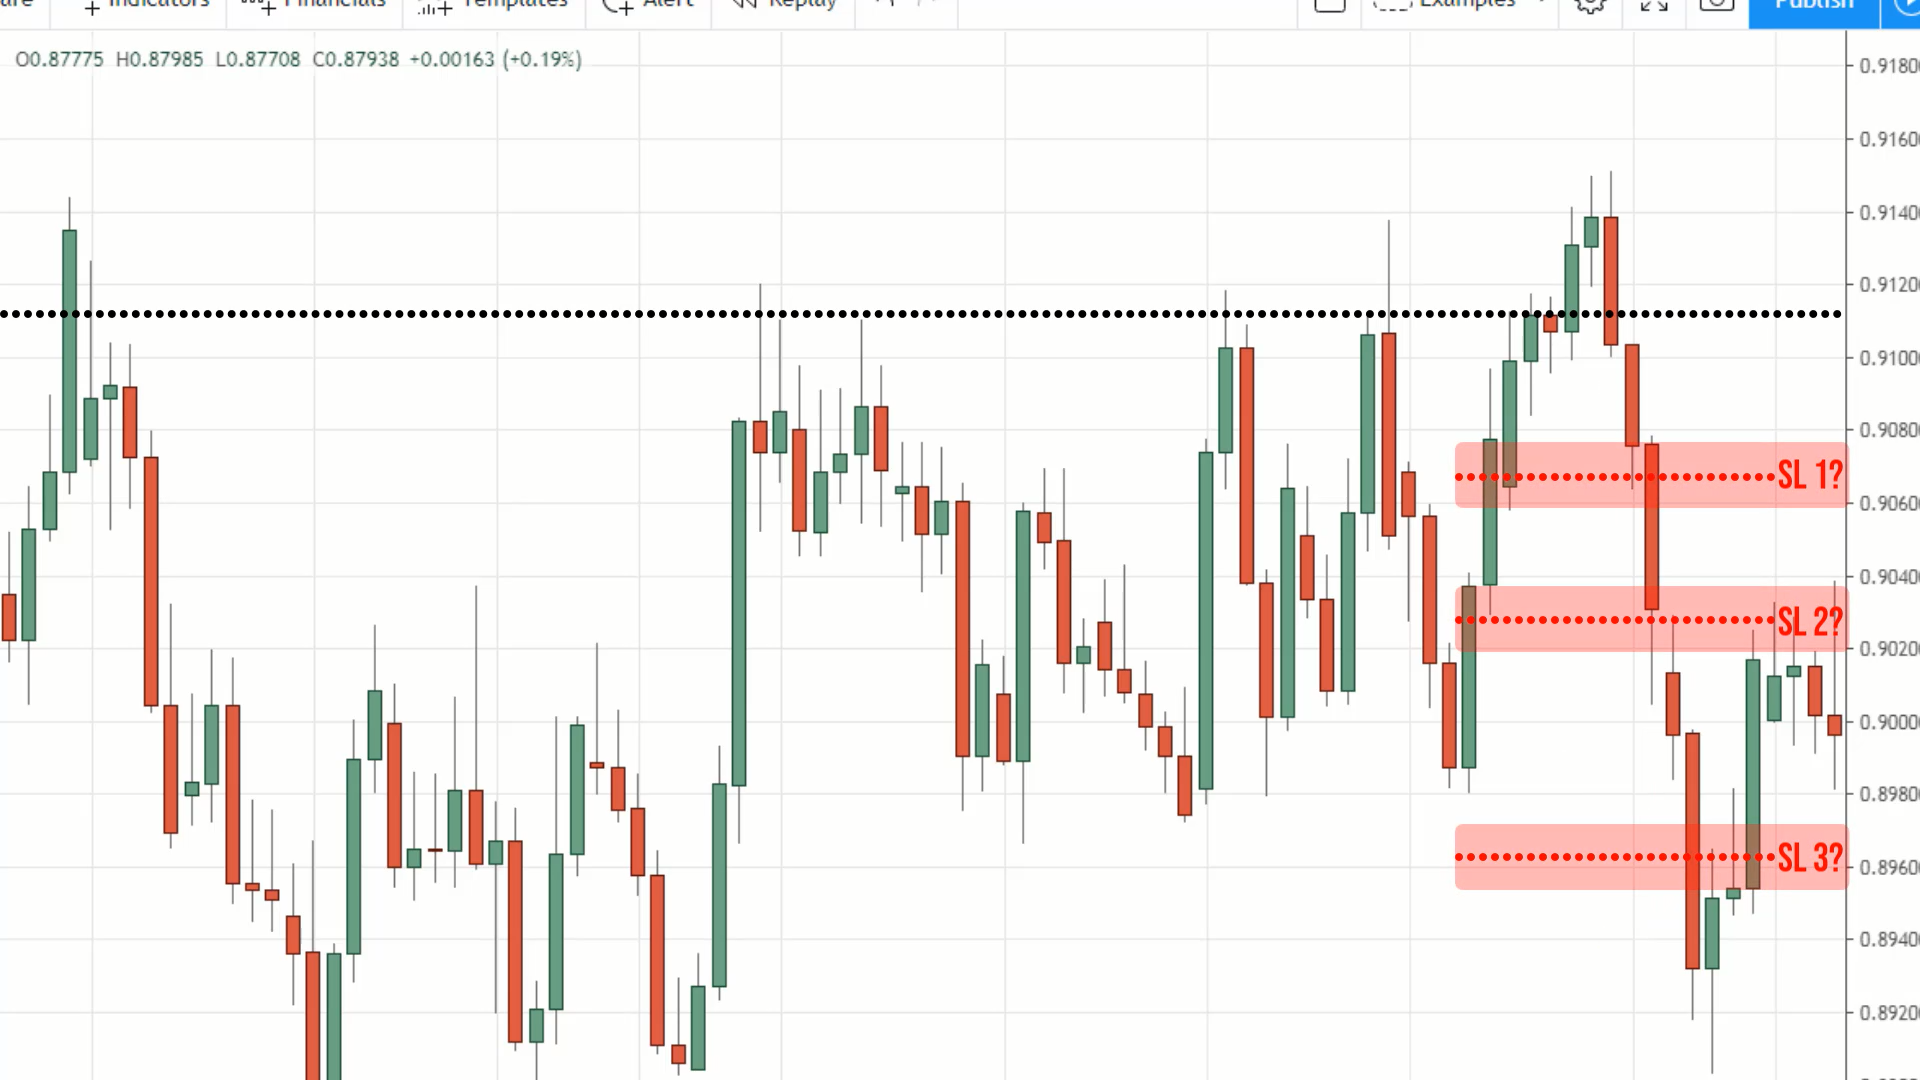
And if the price continues lower, this cluster of stop loss will get triggered which will induce further selling pressure.
That's what the false break technique is all about. You’ll be profiting from this group of trapped traders.
Example #2 (USD/INR):
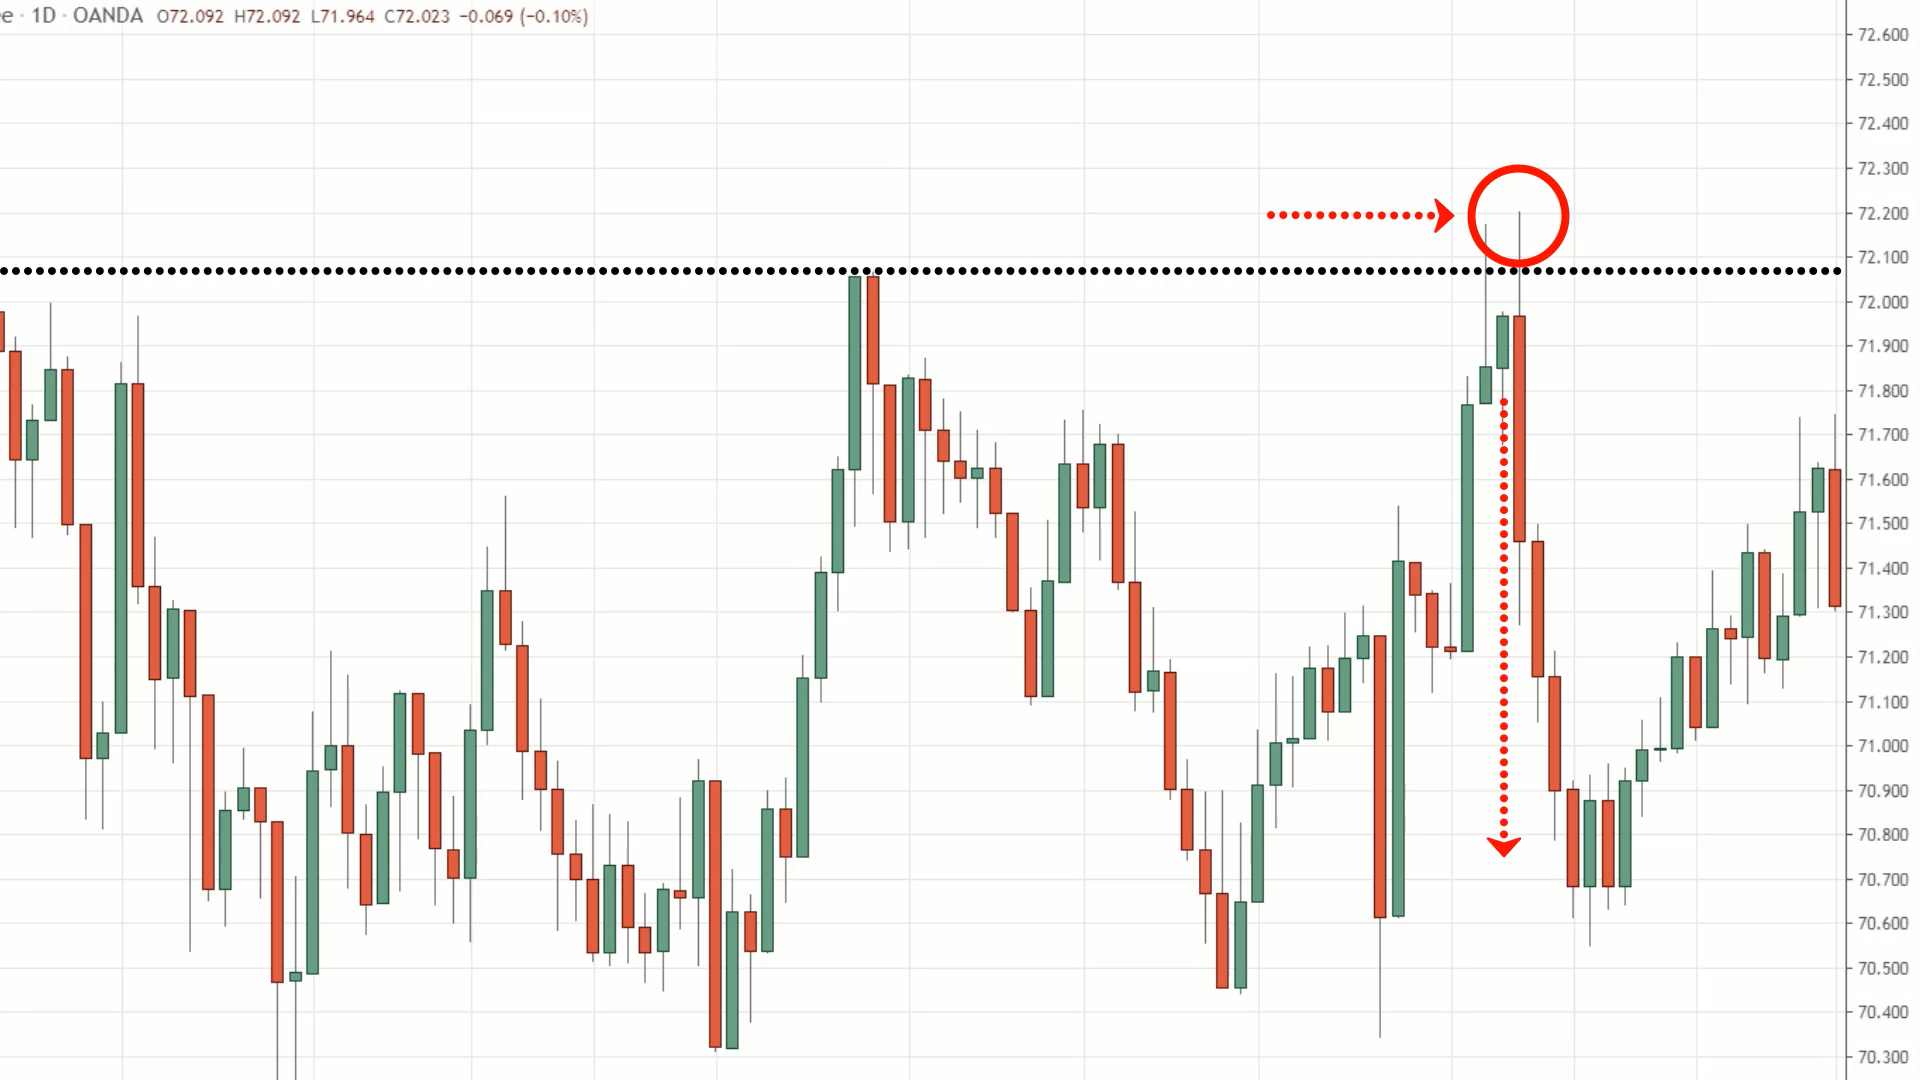
Price took out these highs only to reverse down lower. Does it make sense?
Example #3 (China A50):
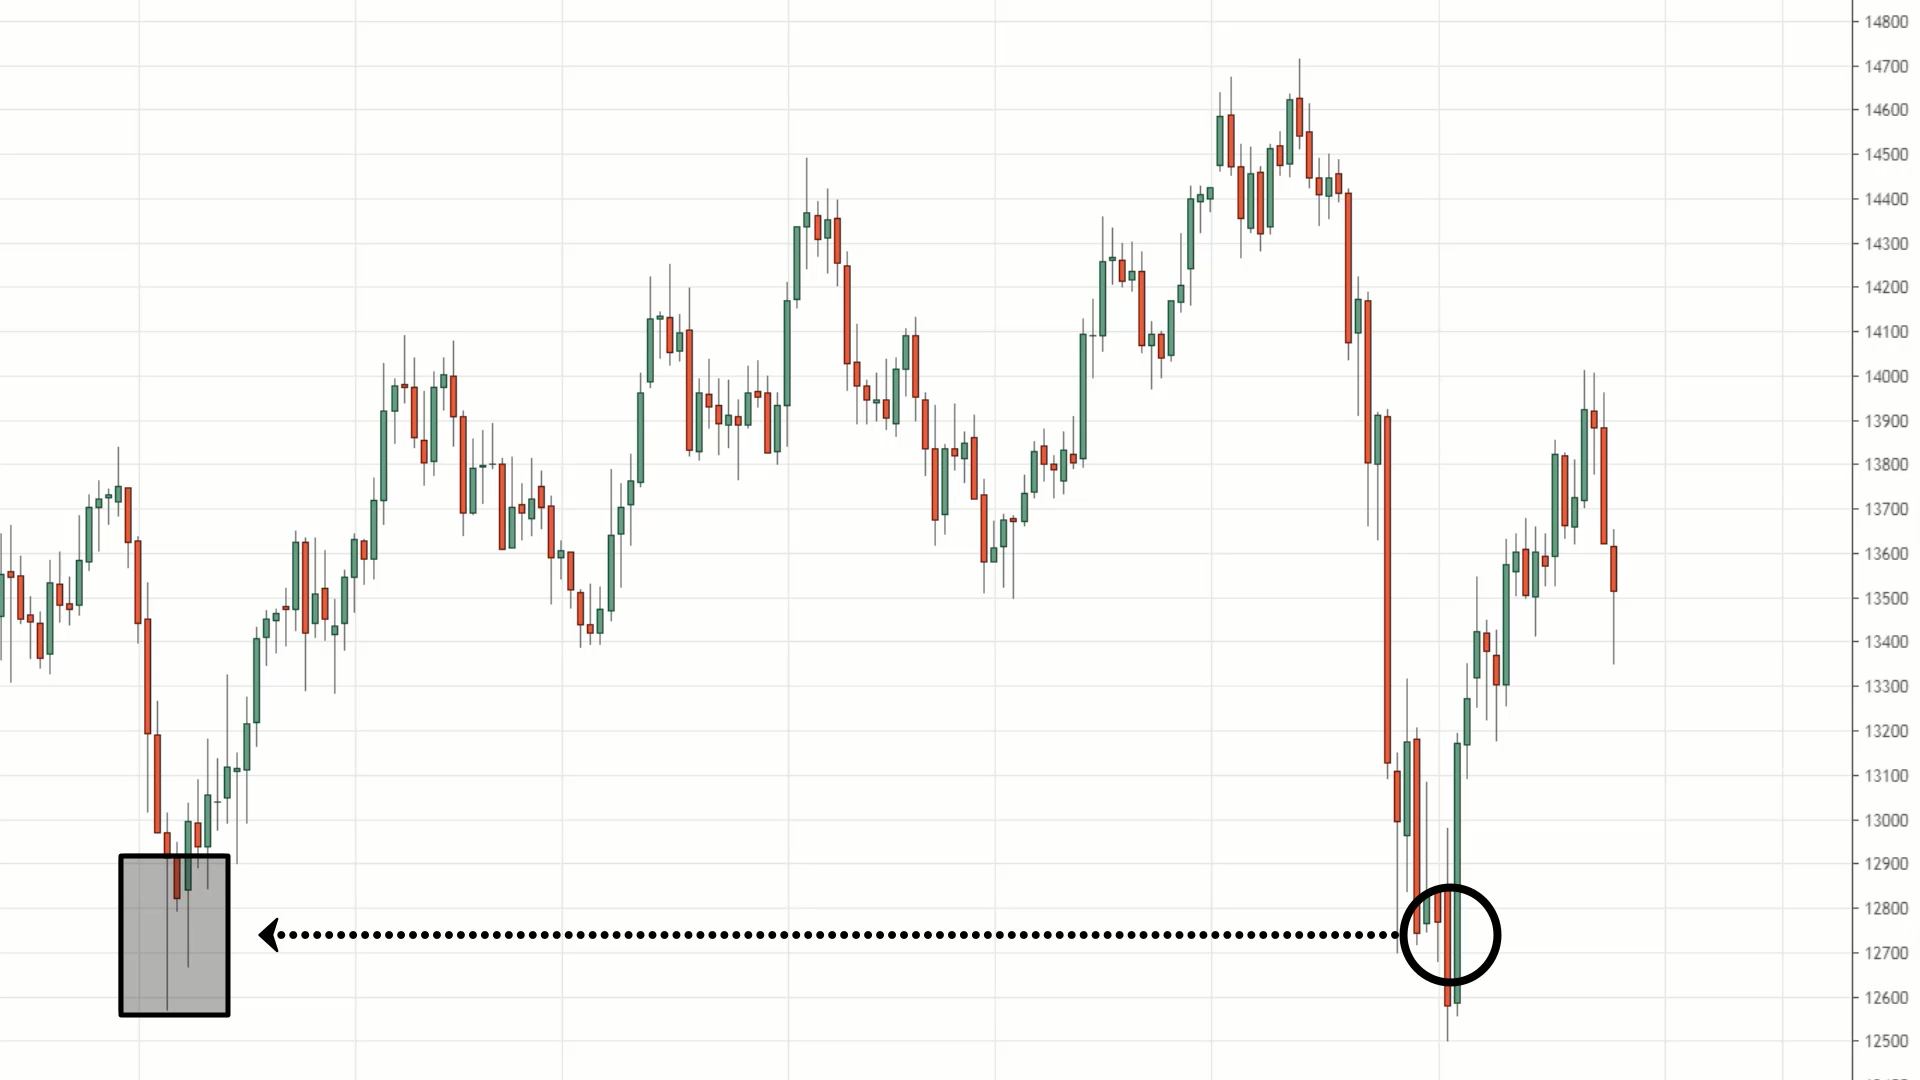
You can see that there’s a strong bearish momentum coming down into this significant lows. When the price trades below the lows, short traders think all hell is going to break loose and they go short.
But the market made a strong bullish reversal instead, closing back into the range and then it continues to have a follow-through higher. This is what the false break technique is all about.
Pro tips:
1. The stronger the momentum, the better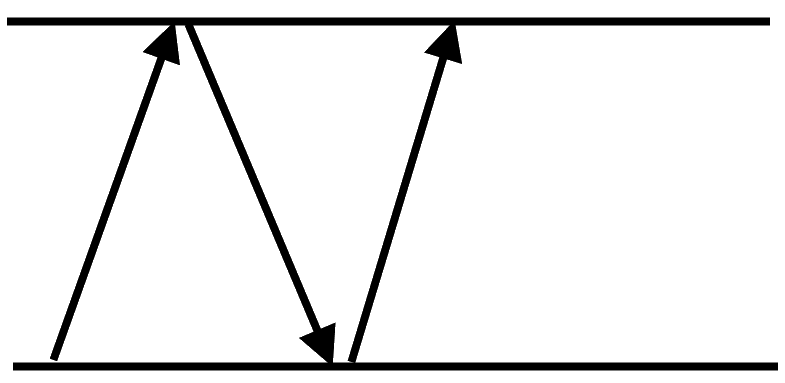
Let’s say market made a fast and strong bullish or bearish move, that’s what I call a strong momentum.
That’s where I’ll like to fade the move as it it’s more likely to reverse back into the range.
2. Avoid stair-stepping price action.
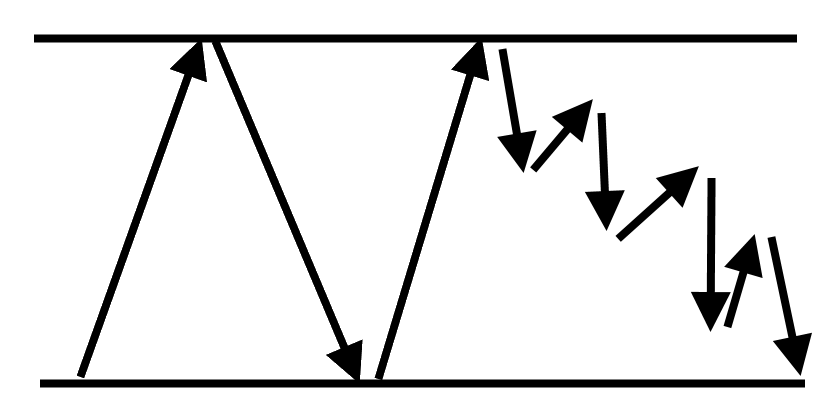
If the price is like walking down the stairs, slowly creeping into support, I'm not looking to buy at this point.
And the reason why I avoid the stair-stepping price action is because all these swing highs are potential selling pressure:
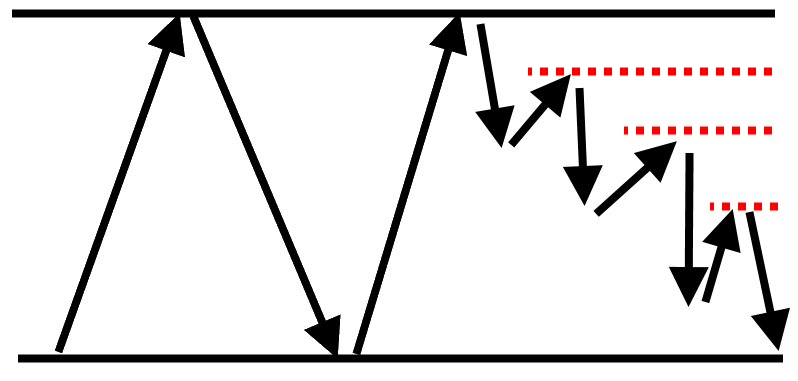
These are places where traders will look to potentially short the markets, which means there is not much room for your trade to run up higher.
Compared to a trade where you have a sudden momentum lower, the nearest selling pressure is the previous swing high, which is near the resistance of the range.
Your target profit could be near that resistance too, so there's much more room for the trade to run.
Buildup
A buildup is when a tight consolidation forms prior to the breakout, or sometimes it can be after the breakout as well.
Since you've just learned that you don't want to be buying breakouts when a market makes a strong move into resistance, what you want to look for instead – is a buildup.
And let me just briefly illustrate what a buildup looks like. Instead of a strong move into a level, it forms a tight consolidation like this:

When you have this tight consolidation, only then you want to buy the breakout. Why is that?
Because you’ll have a logical place to set your stop loss. You can now set your stop loss just below the lows of this buildup.
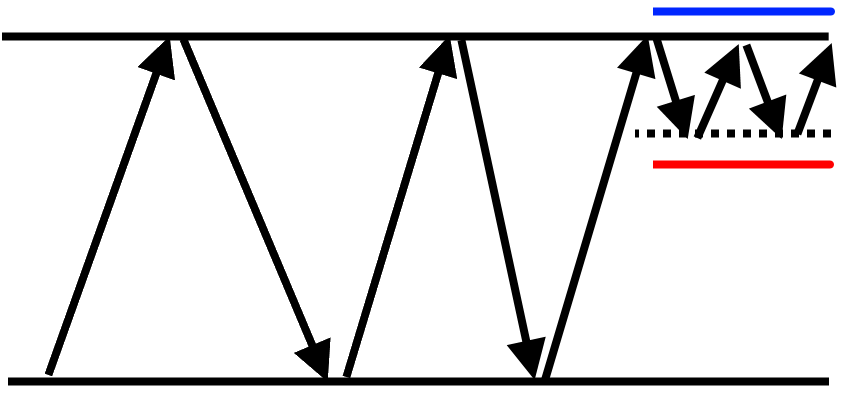
Now you’ll have a much tighter stop loss compared to setting at the lows of the range. Do you agree?
Understand that the market moves from a period of high volatility to low volatility. At this point when the market is forming a buildup, it’s in a low volatility environment.
If the price were to break out higher, this is where volatility would pick up. This is where the market can move really fast and furious. And that's to your advantage if you buy the breakout in the right direction.
There's no guarantee the market will break out higher, it could just swing down lower. That's possible. But the key thing is volatility. An expansion could really work in your favour.
Example #1 (Bitcoin):
Bitcoin is a market filled with volatility, contraction, and expansion. If you look at this over here: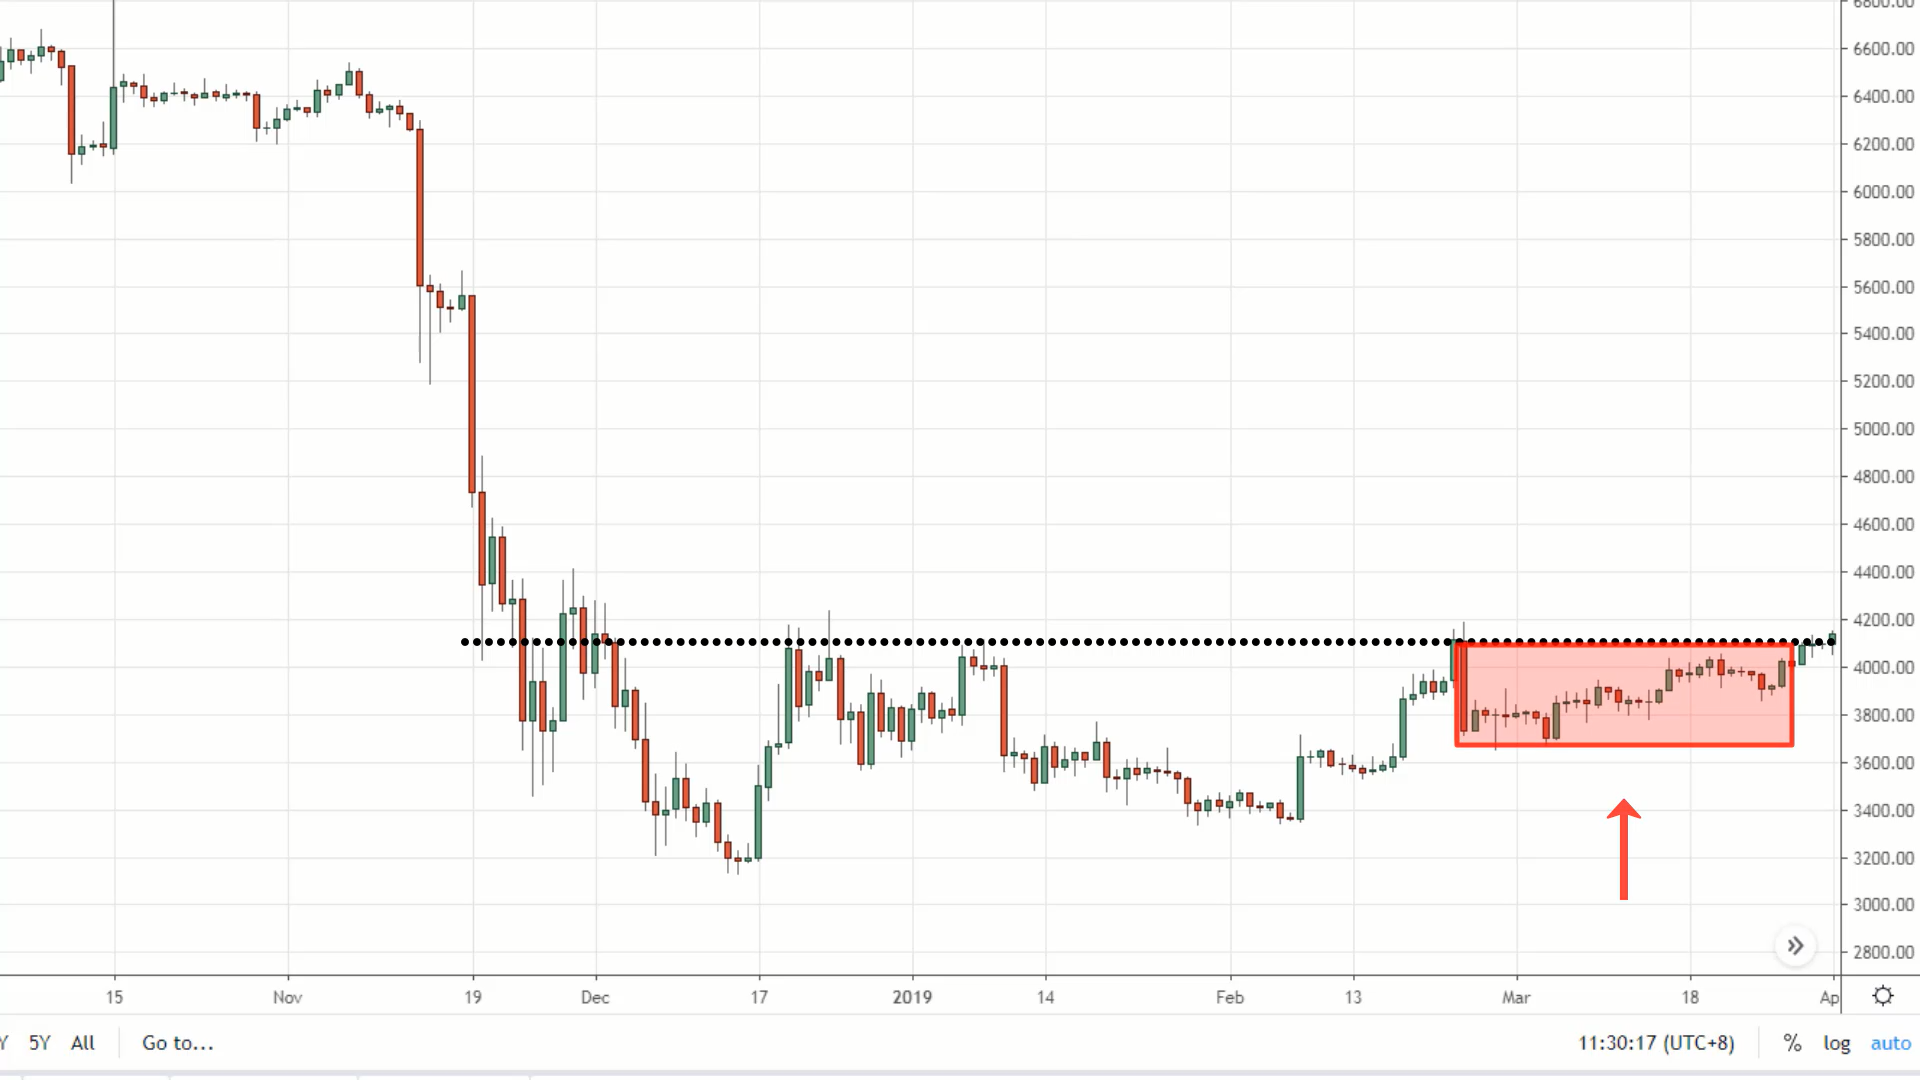
You can see a series of higher lows into the area of resistance, and there’s a buildup over here, nice and tight.
This range of the candles is getting smaller compared to the previous range of the candles on the left when volatility expanded.
You can see that I'm showing two concepts over here. The first concept is volatility expansion leads to volatility contraction. Then contraction leads to expansion.
And if you were to buy the breakout of this high after the buildup has been formed, your risk to reward on this trade is favourable.
I get it sometimes you're wondering, “Man, how do I know when it is time to enter a trade?”
Pro tip:
You can use the 20 MA to serve as a guideline. You'll notice that the 20 MA starts to touch the lows of the buildup.
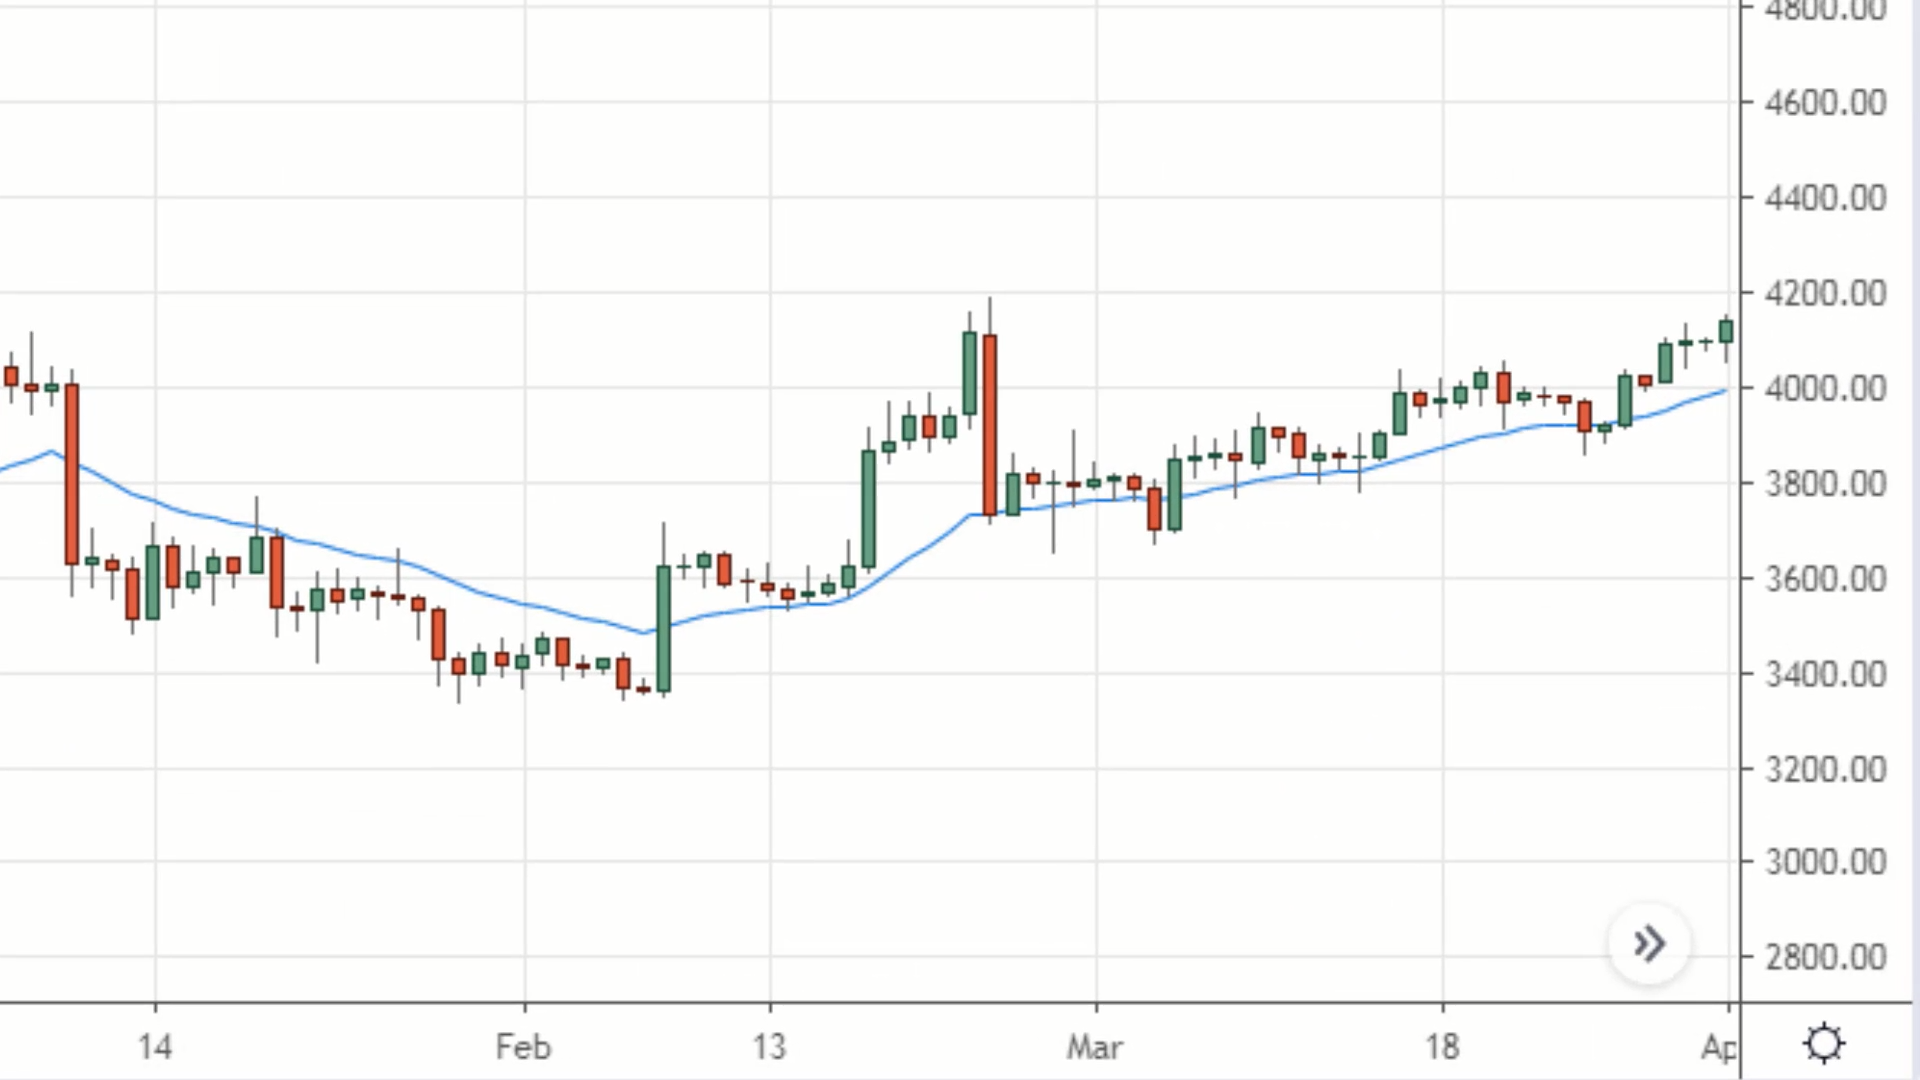
You can see over here, the 20 MA has touched the lows of the buildup. That’s when you can look to enter long. Does it make sense?
Example #2 (NZD/CAD):
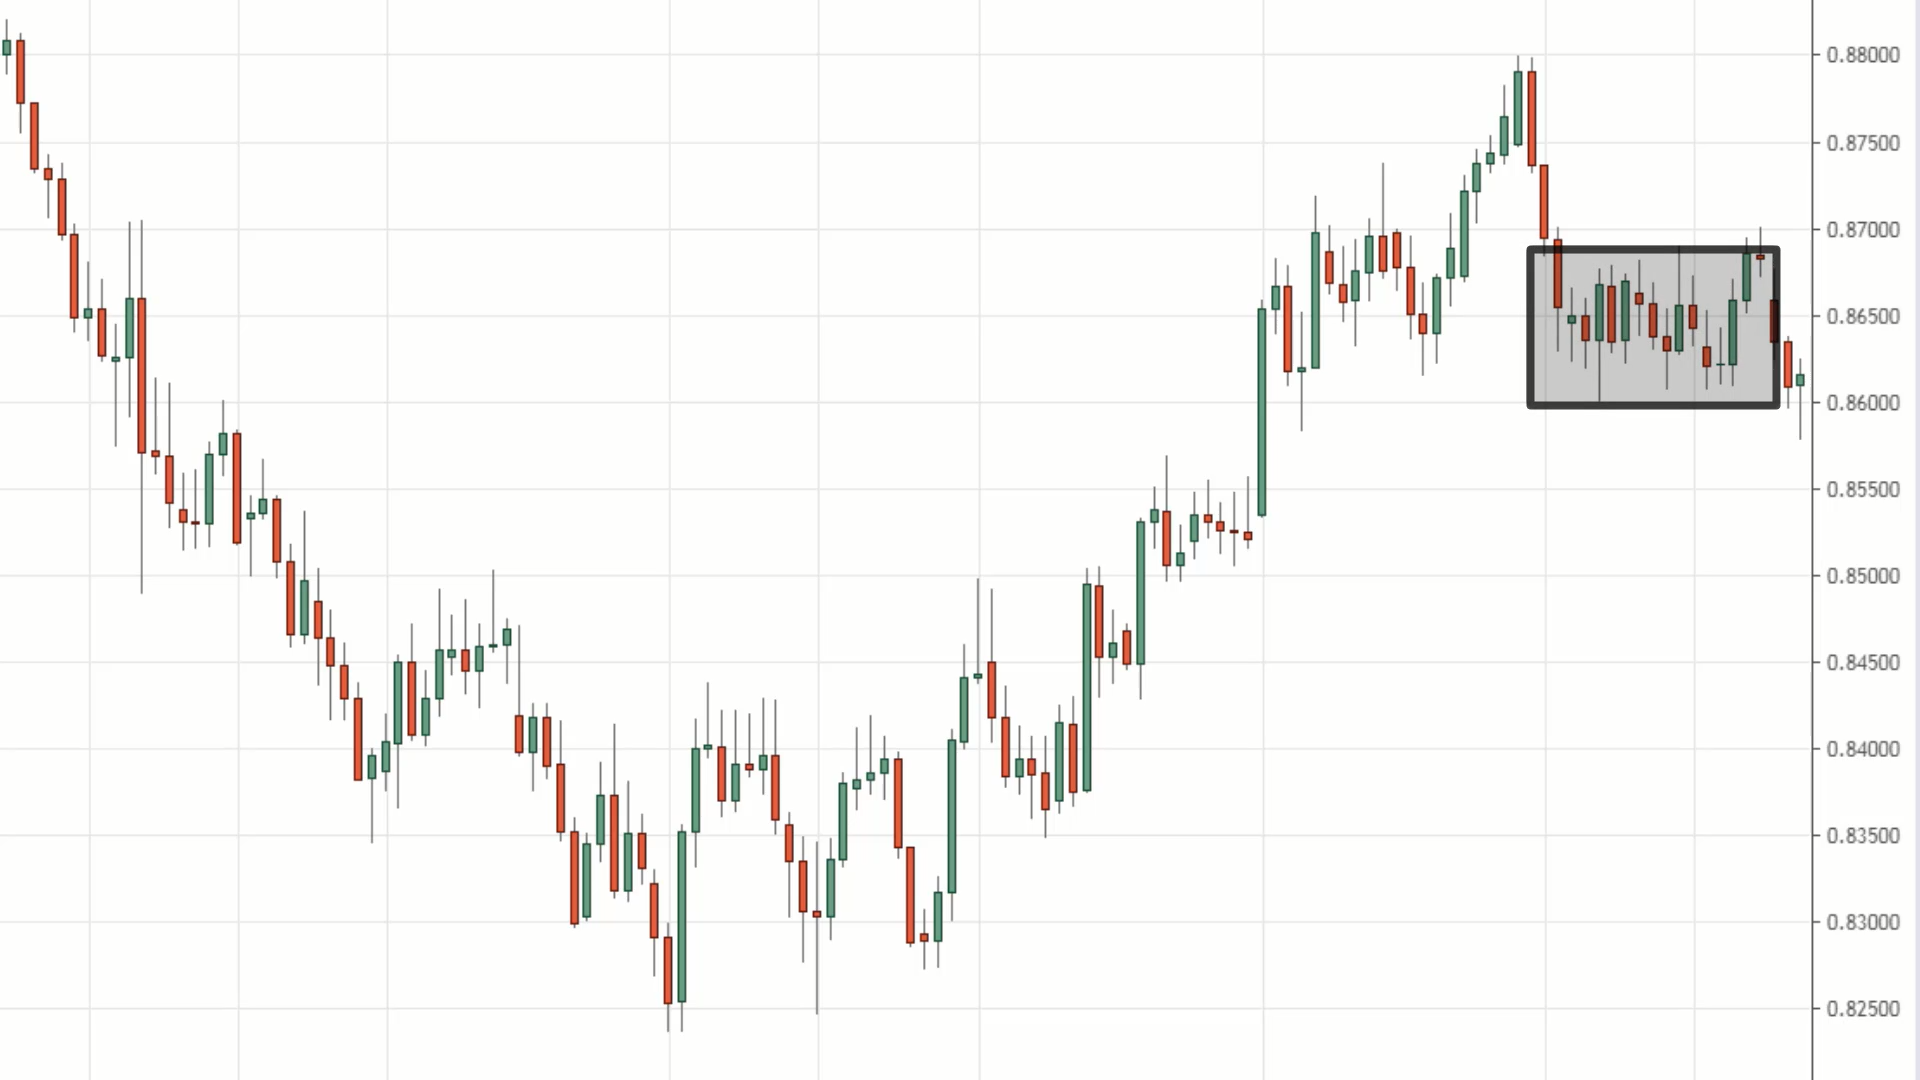
You can see a nice, tight buildup. Then the price collapses lower.
If you just pull out the 20 MA, you can see that the 20 MA is starting to hit the highs of the buildup.
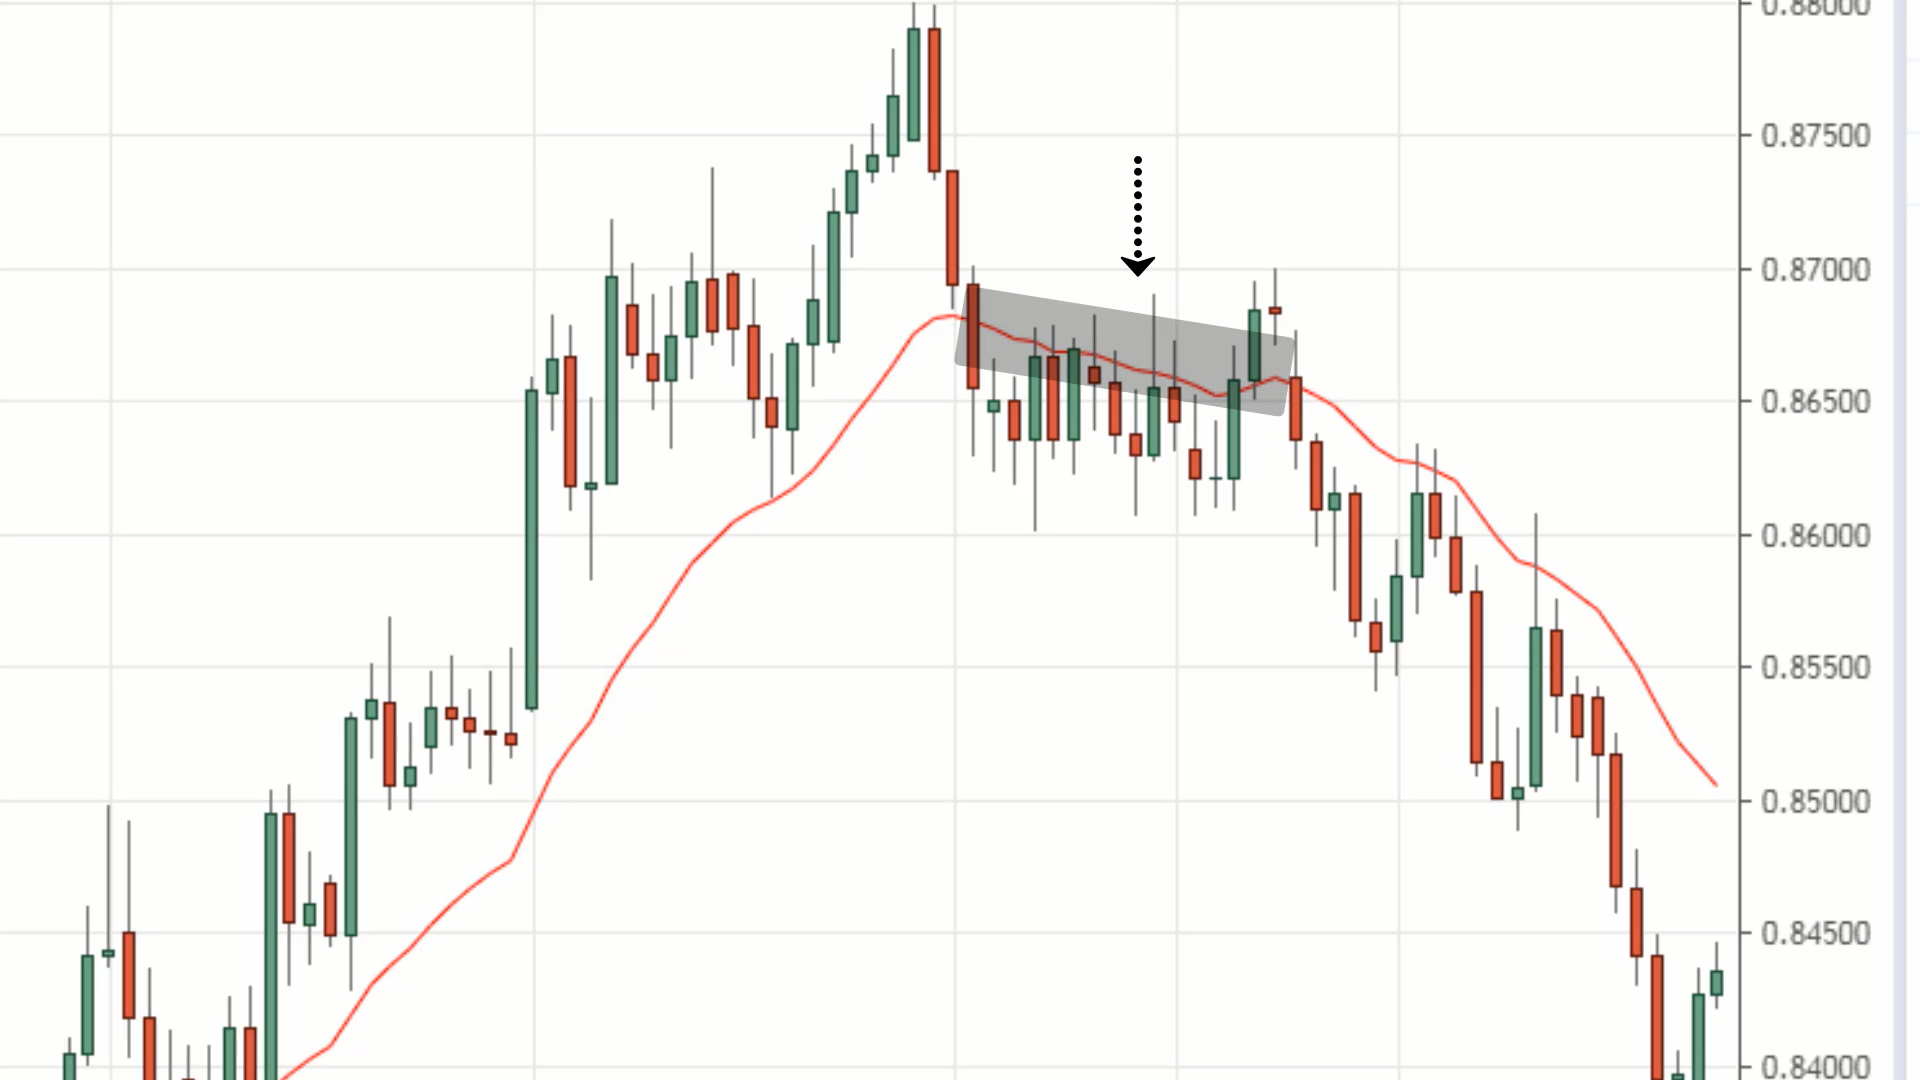
This tells you that the market rate is now ready to make a move, there’s no guarantee if it's going to break out higher or lower, but you can expect something decent coming soon.
The longer the buildup is formed, the more explosive the move will tend to be.
Example #3:
For this example, I want to share with you is the buildup forms after the breakout. Because sometimes the market might break out of the range and then it forms a buildup.
So you've got to be versatile. You cannot just think that only one situation will happen.
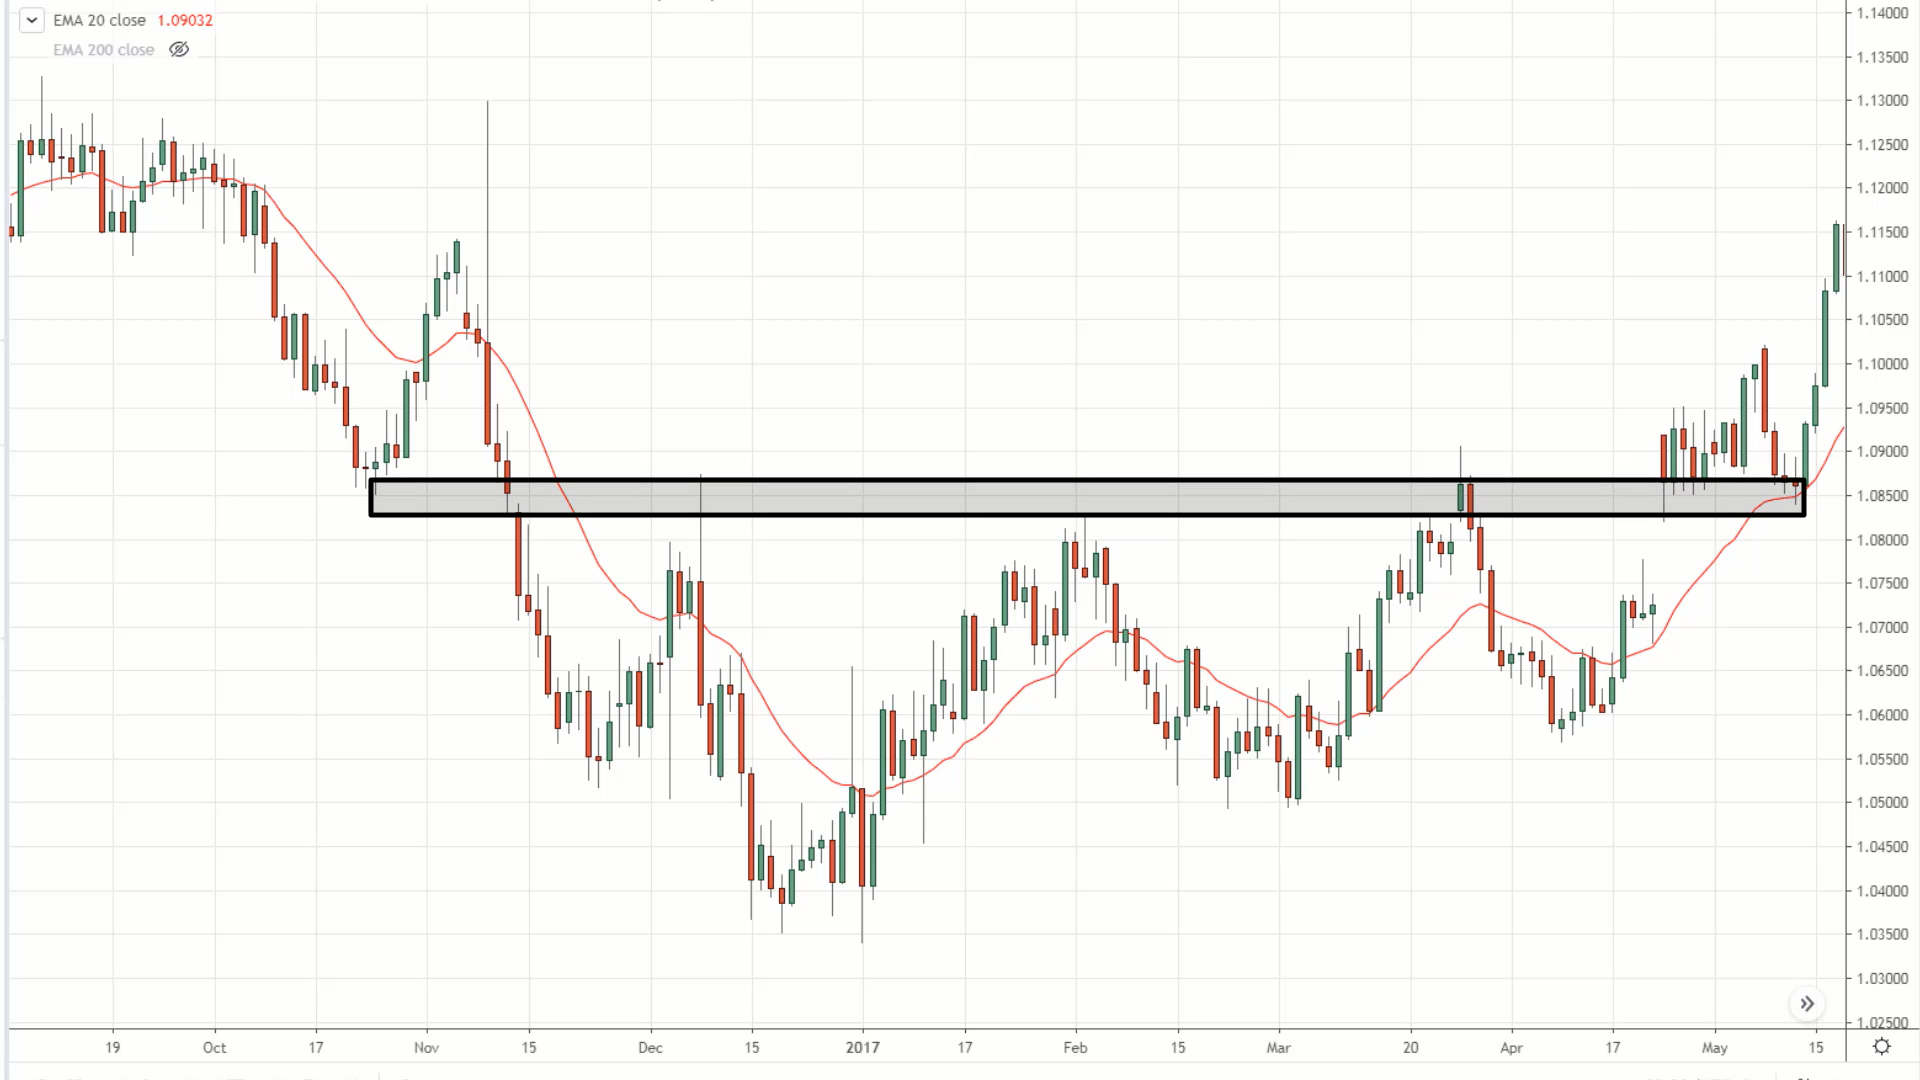
You can see that the price gapped up into resistance, and then forms a buildup slightly above resistance before it breaks out higher again. Does it make sense?
Pre-breakout technique
So how do you trade a breakout before it occurs? How do you position yourself into a trade before the breakout occurs?
There are 2 things to look for:
- Identify a buildup on the daily timeframe
- Look for a false break on the 4-hour timeframe
So now I’m starting to combine a few concepts. If all these don’t make sense, please go back to the start of the video and watch the earlier concepts.
If you don't get your foundation right, these will be very confusing for you. Make sure your foundation is there.
Let’s revisit the examples I’ve shared earlier.
Example #1 (NZD/CAD):
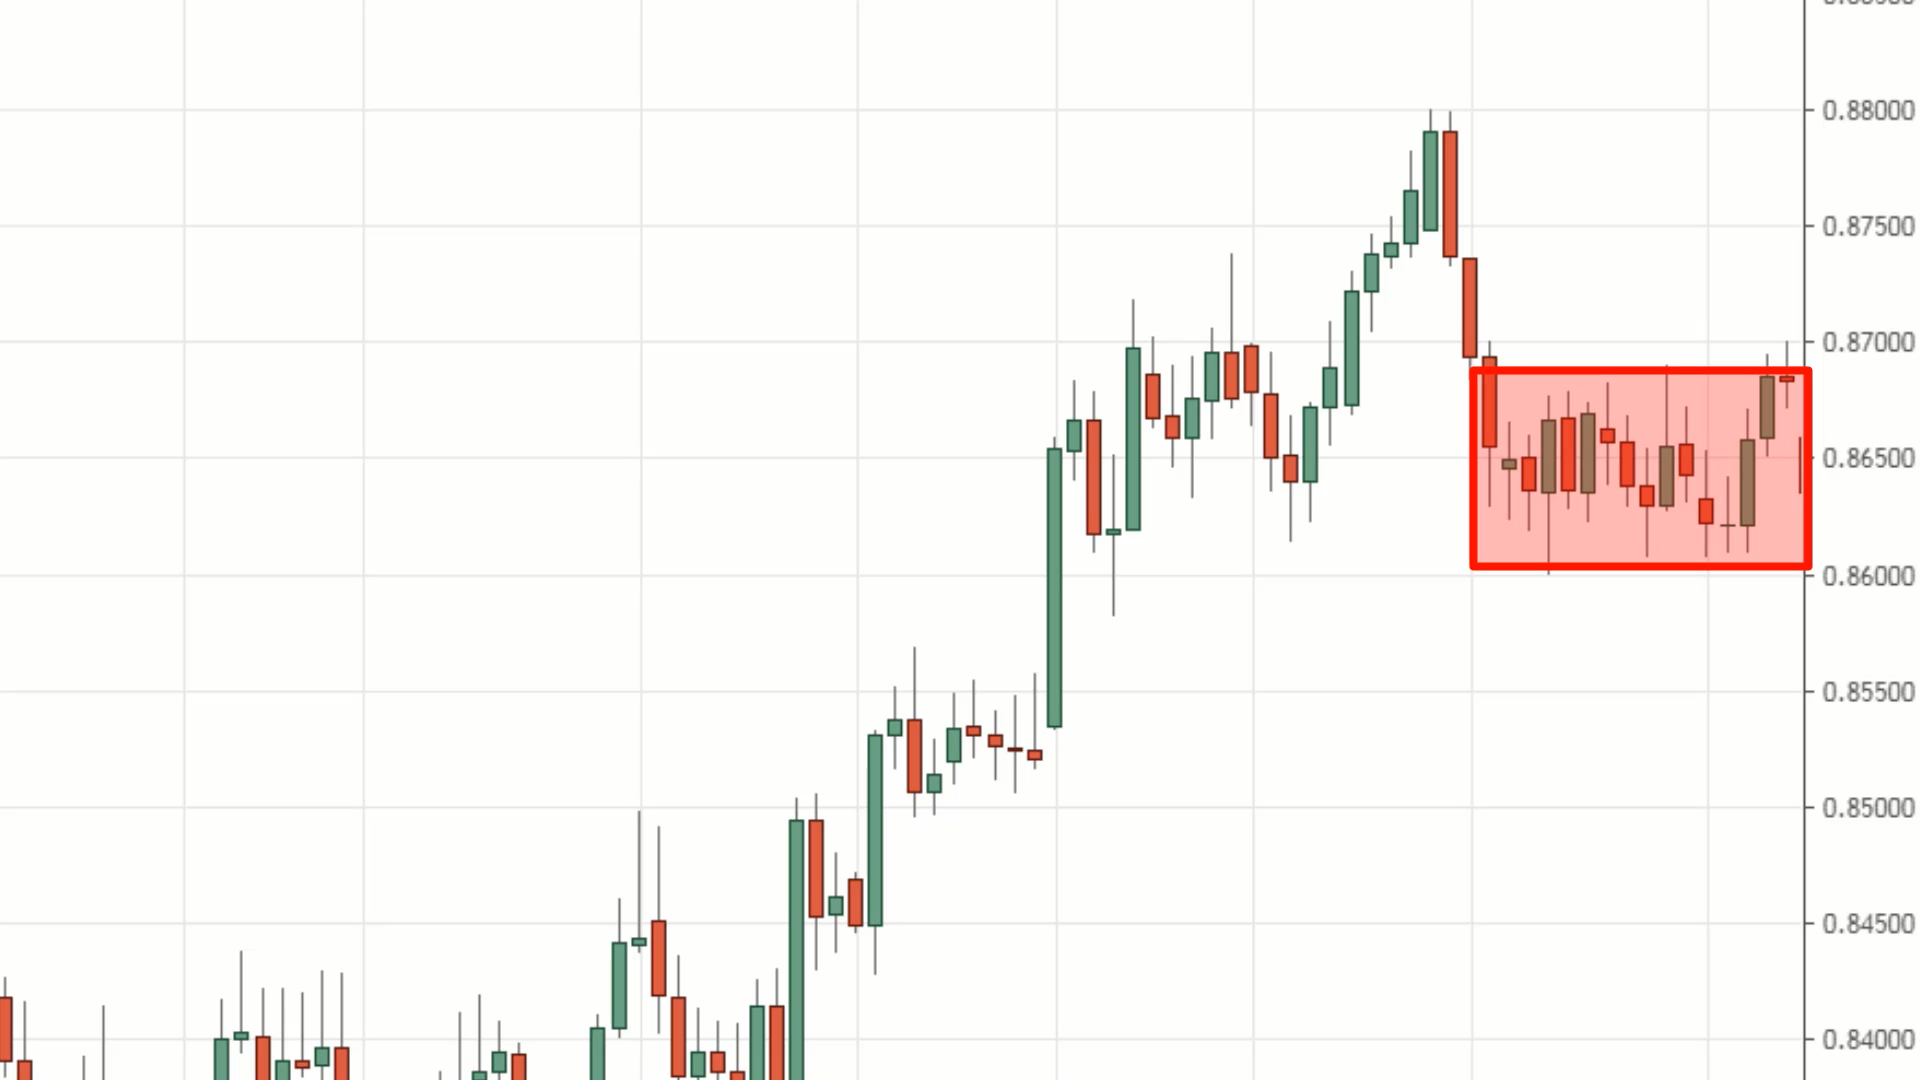
There was this buildup formed over here. Now let's go down to a lower timeframe, like the 4-hour timeframe and see if there’s any false break trading opportunity that allows us to short at the highs.
You can see the corresponding section side by side over here:
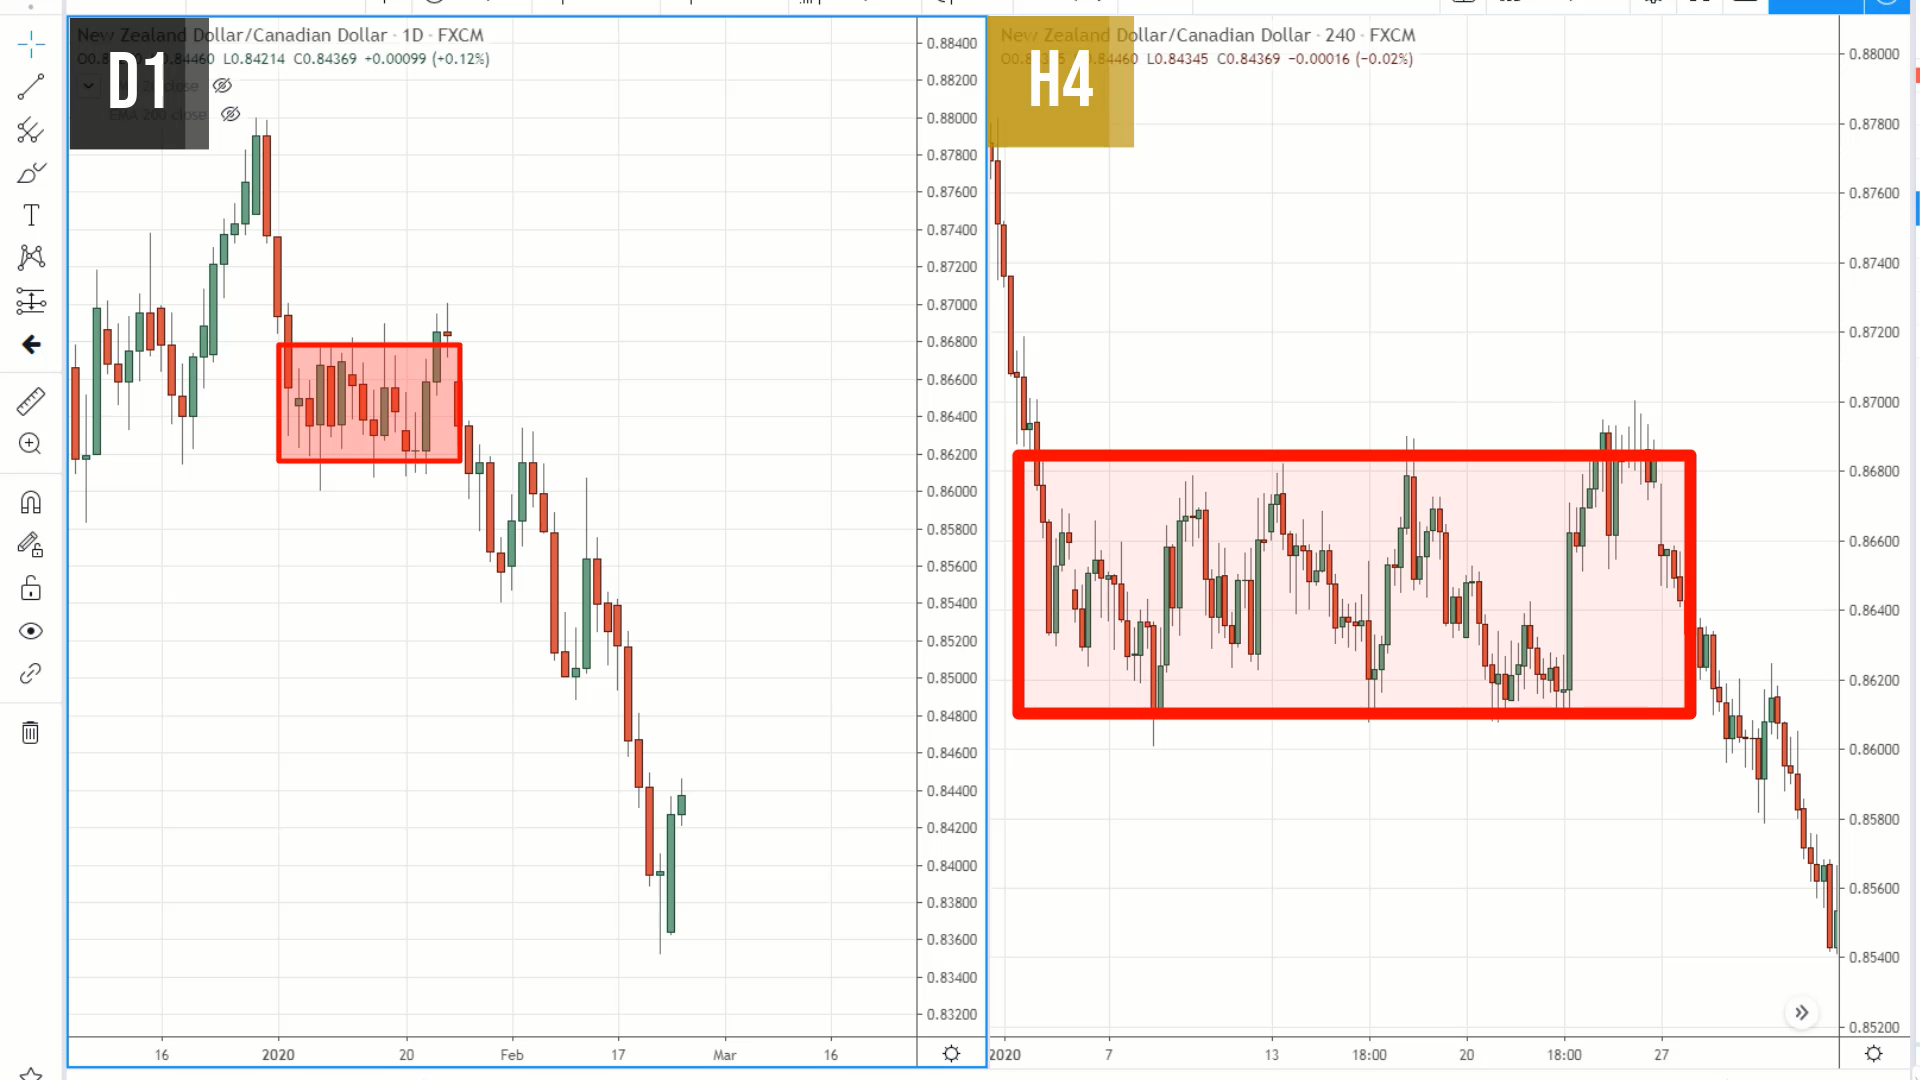
You can see that there is a couple of false breaks at the highs:
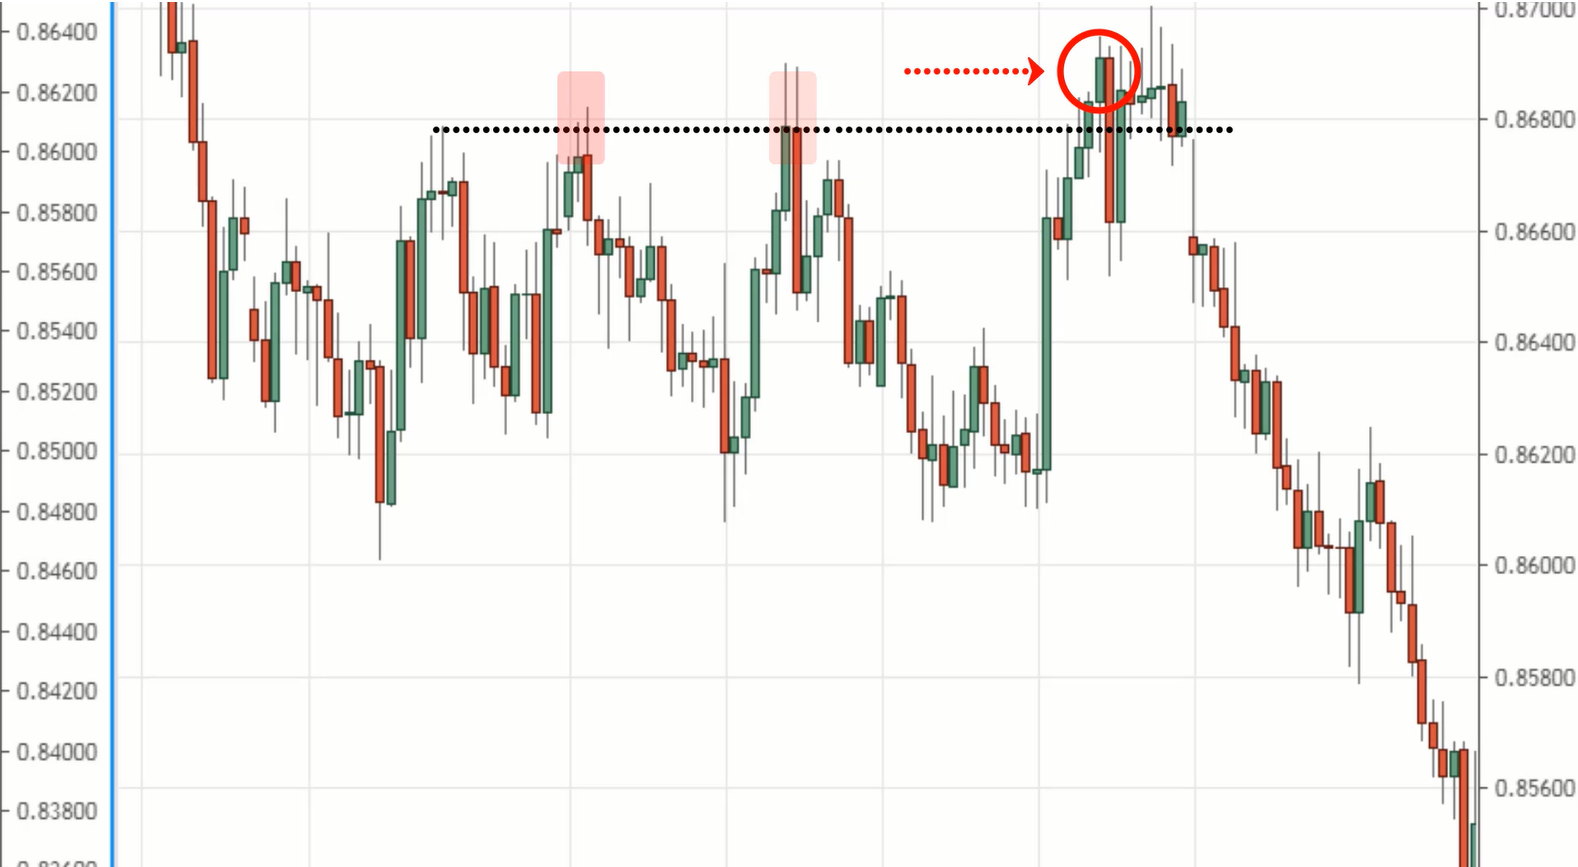
The final false break took out all the previous highs before it reverses lower. Can you see how entering the breakout before the breakout works?
You can see that you might suffer one or two losing trades before you catch the move. So to manage your trade, if you went short on the first false break, you could take profit off a portion of your position once it hits the lows of the buildup.
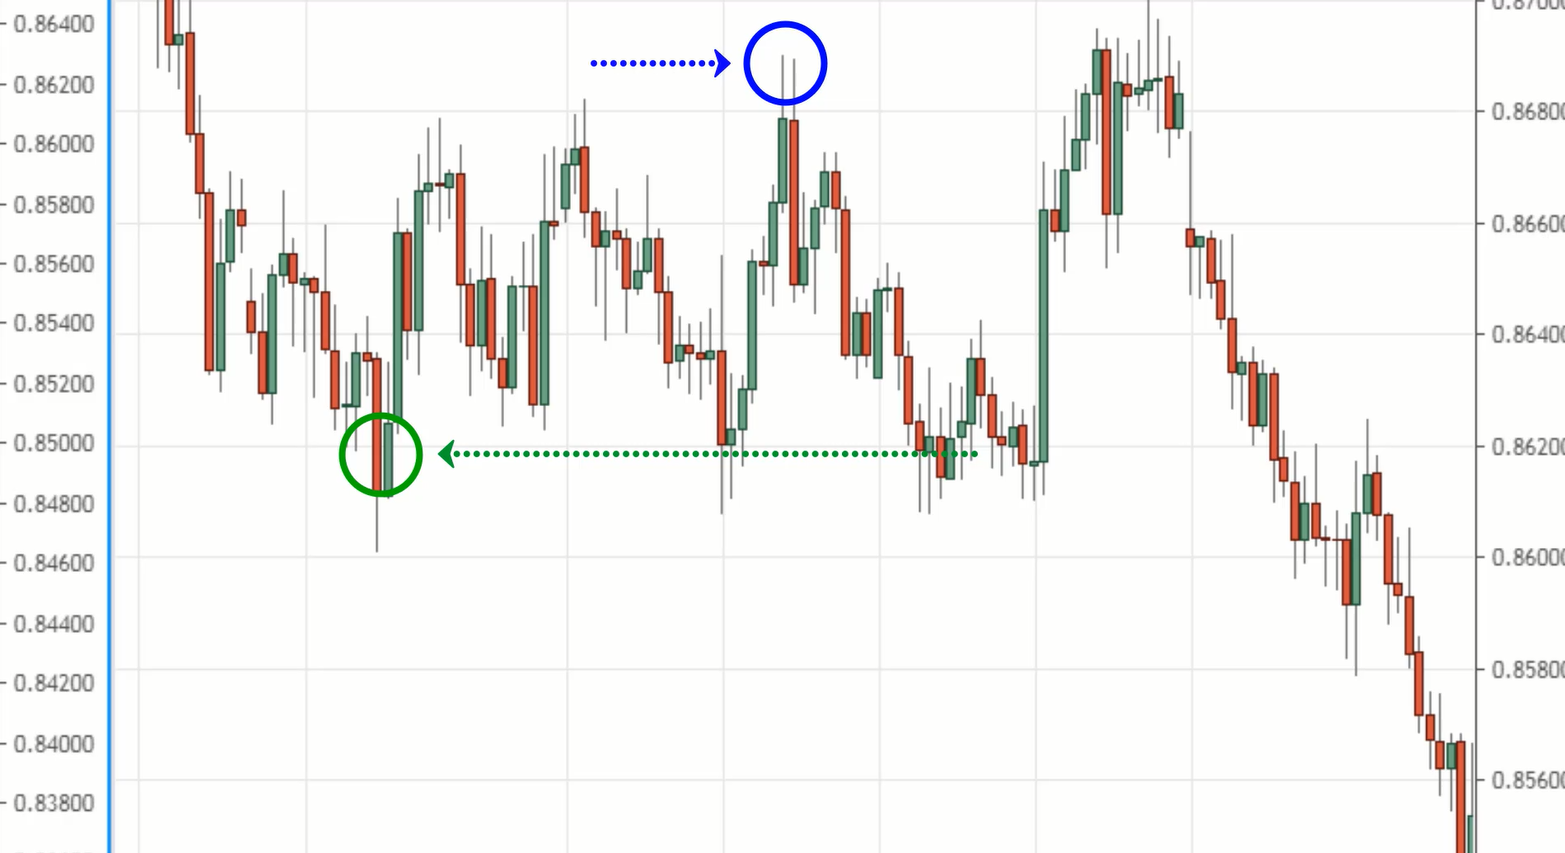
Because there's no guarantee that the price is going to breakdown lower once it hits the lows of the buildup.
You have the remaining position, let's say 50% of your position, to ride the next wave down lower should the market breakdown lower.
And if the market reverses against you, that’s not much of an issue because you already took some profits off, now your losses are much smaller, or you could even exit at breakeven.
Example #2 (GBP/CHF):
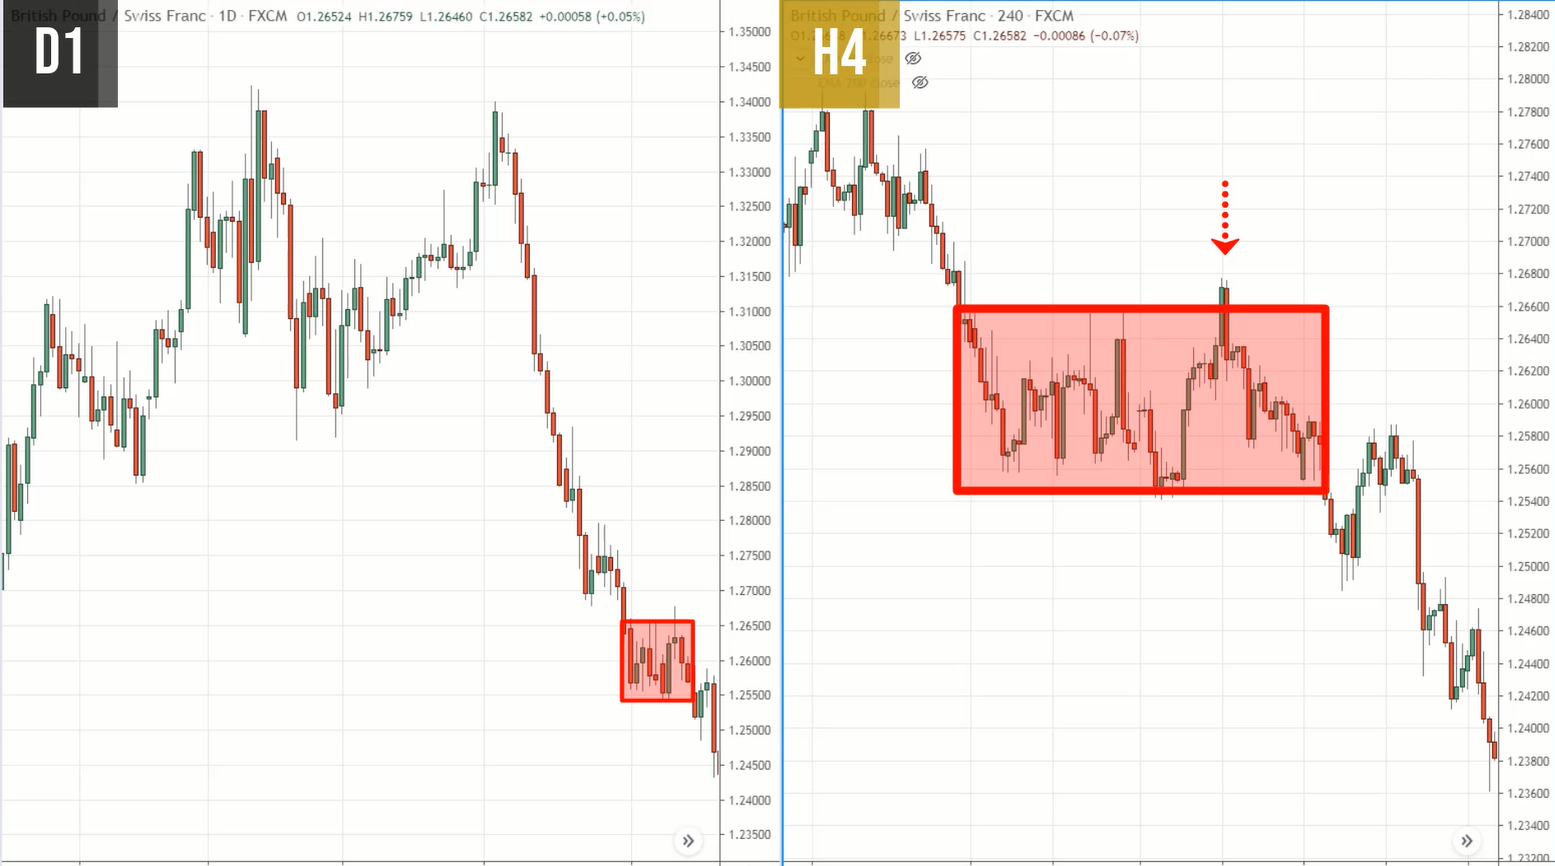
Using the same technique that I've shared, you’ll use multiple time frame analysis.
Now, you can see opportunities to sell in this market. You can see that there’s a false break setup at the highs.
Example #3 (NZD/JPY):
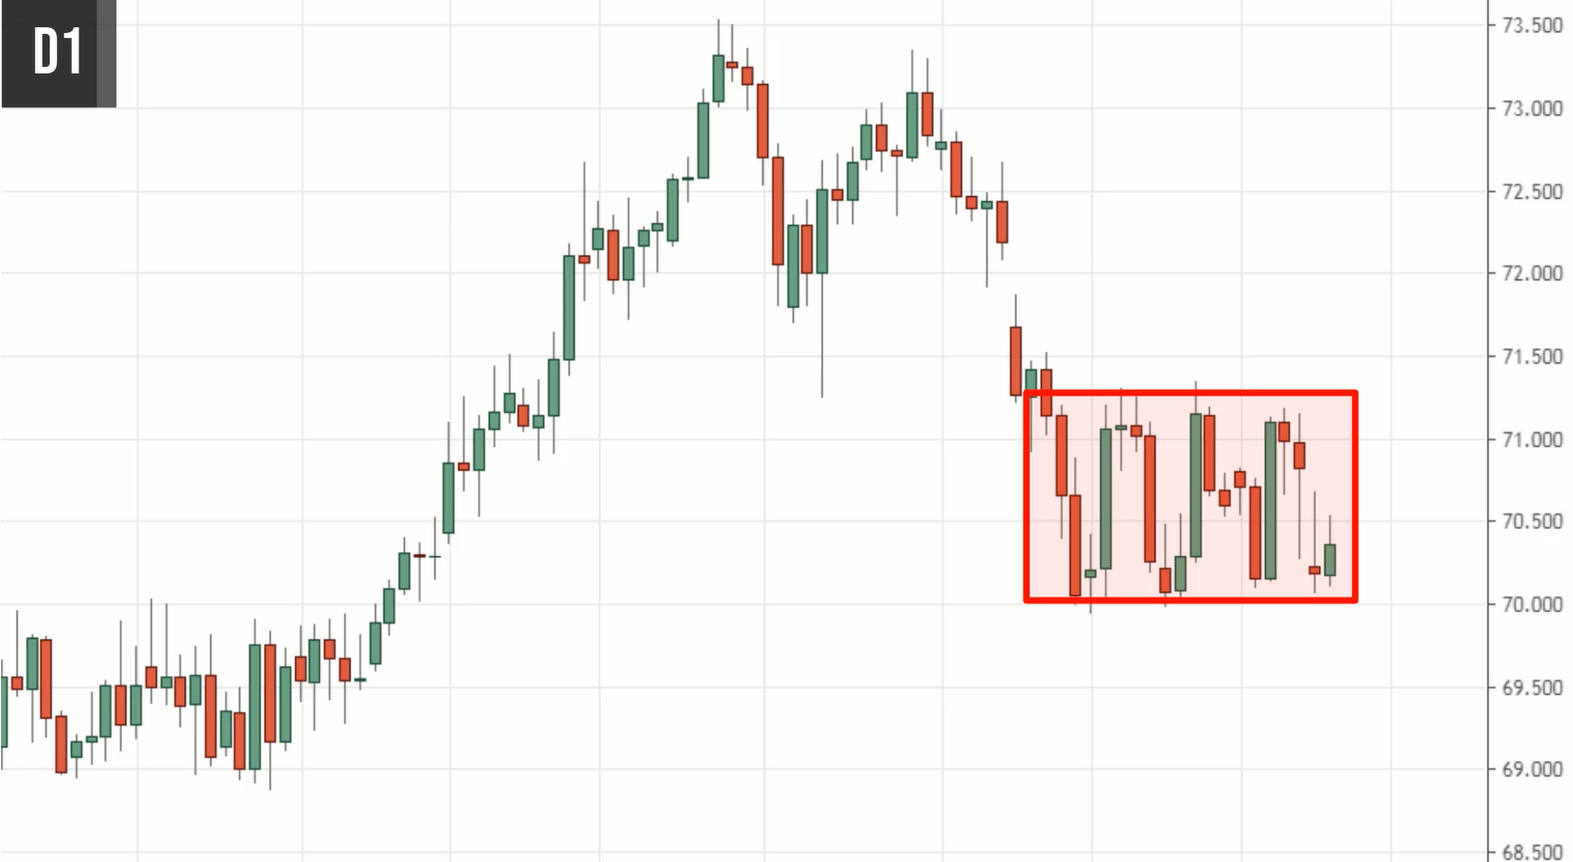
Now you can see that on the daily timeframe, the price is forming somewhat of a buildup.
It's not exactly the nice and tight buildup that you’ve seen earlier, but I would still consider this a buildup.
And if you go down to a lower timeframe, you can find opportunities to enter a trade before the break of the highs or the lows.
Let’s go down to the 4-hour timeframe.
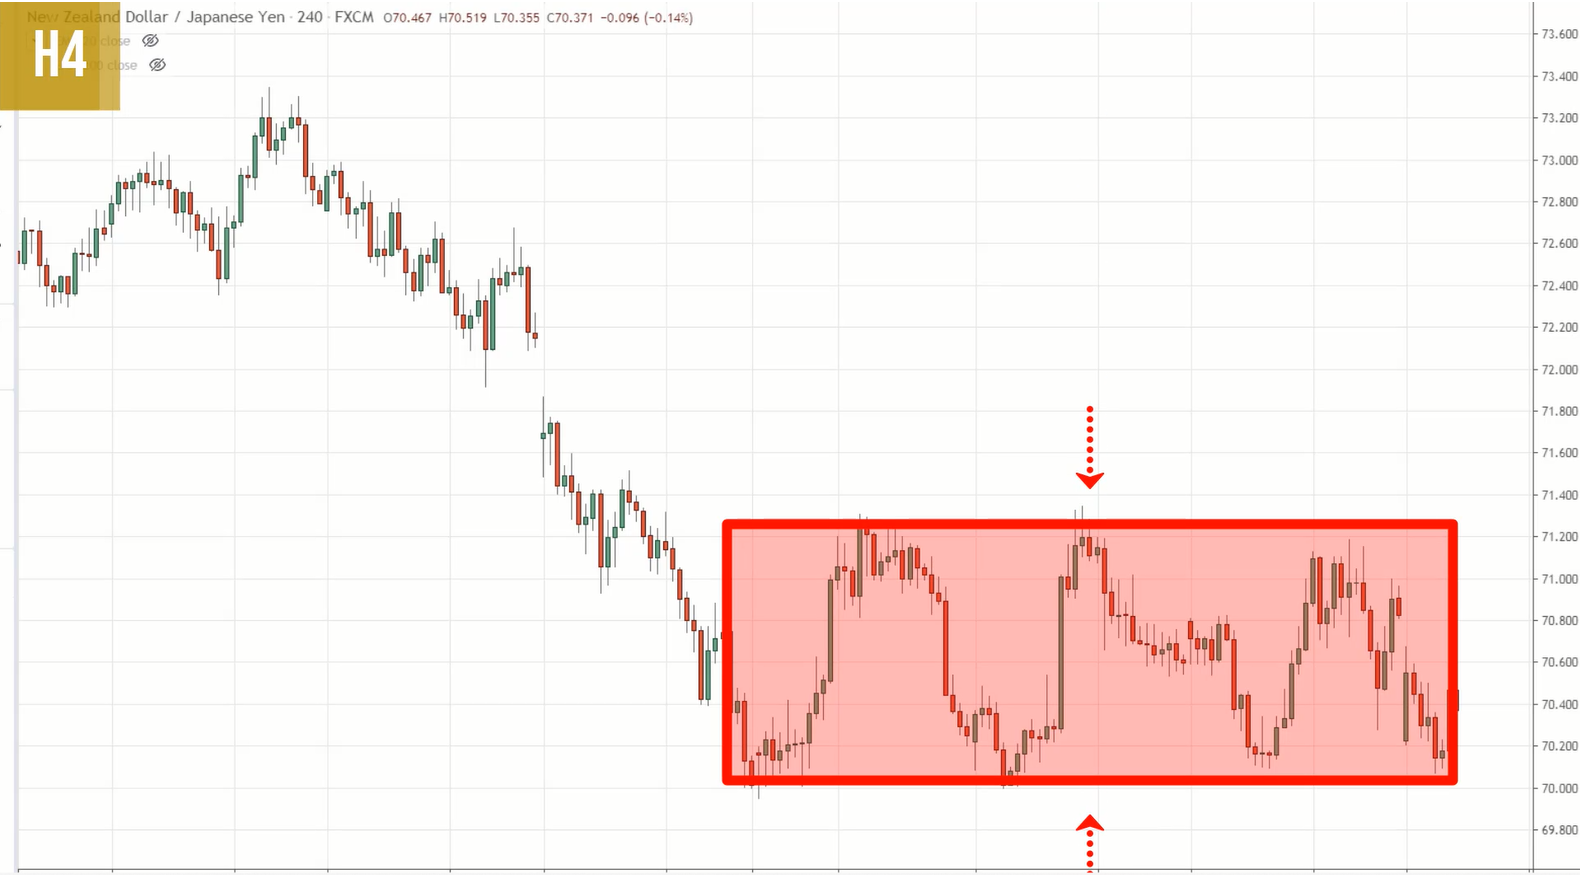
You can look to trade the false break of the highs or the lows, depending on your bias.
If you are having a bearish bias, then, of course, you want to look for a false break set up at the area of resistance.
If you have a bullish bias, then look for a false break setup and the lows of support. Does it make sense?
Moving on…
Rubber band snap
This technique is not about entries, it’s more about knowing when to stay out of the markets.
I want you to stay out of the markets and avoid trading in the direction of the trend when the price is far away from the area of value.
Let me explain what I mean by this…
Example #1 (T-Bond Futures):
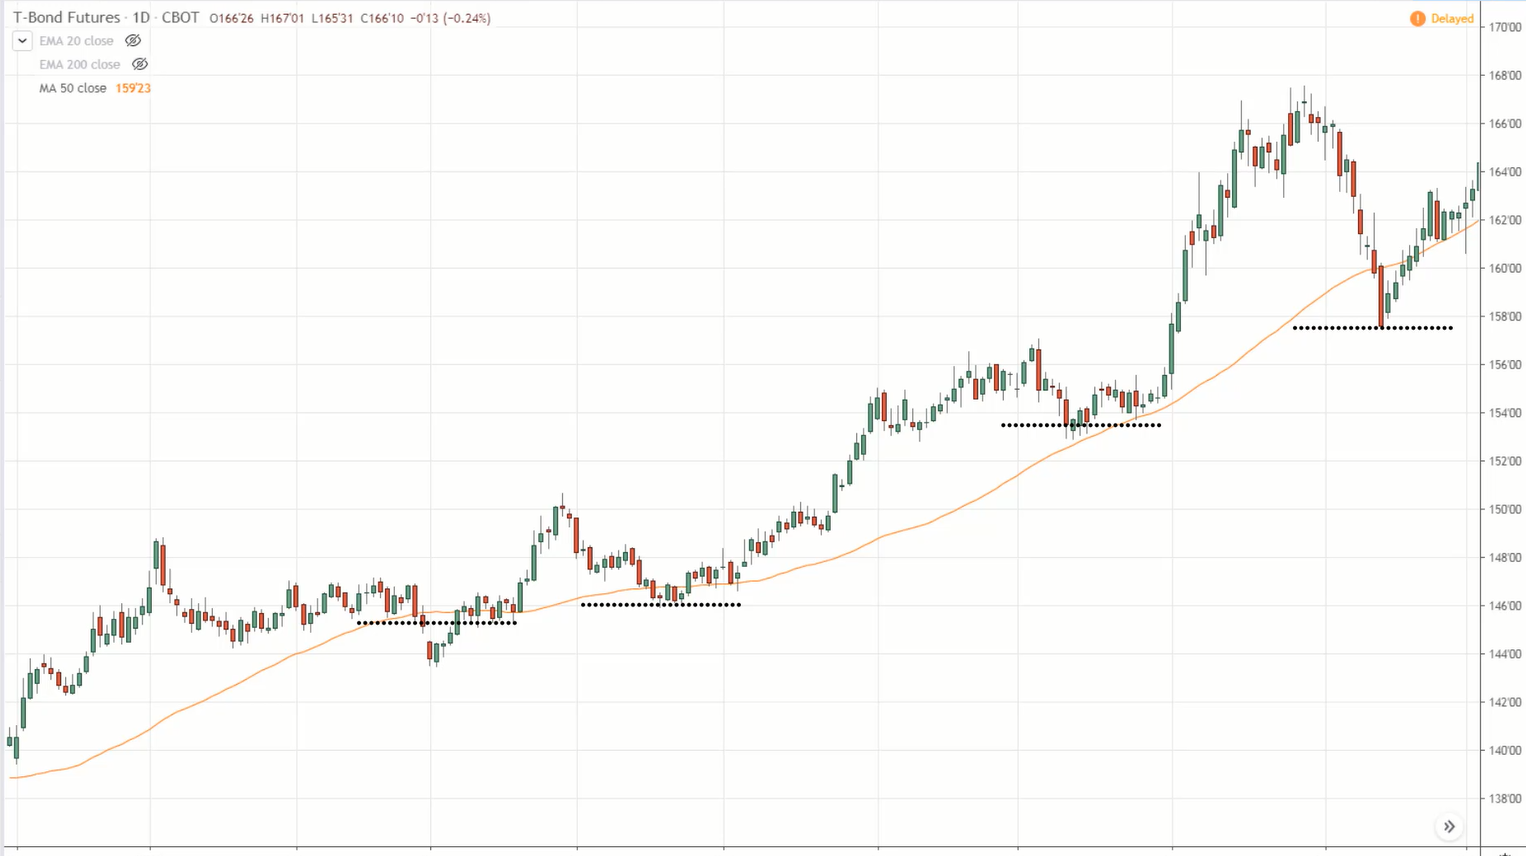
You’ll realize that the area of value is at the 50-period moving average as the price has tested it 4 times.
Now, if the price is far away from the area of value, you want to avoid trading in the direction of the trend.
For example:
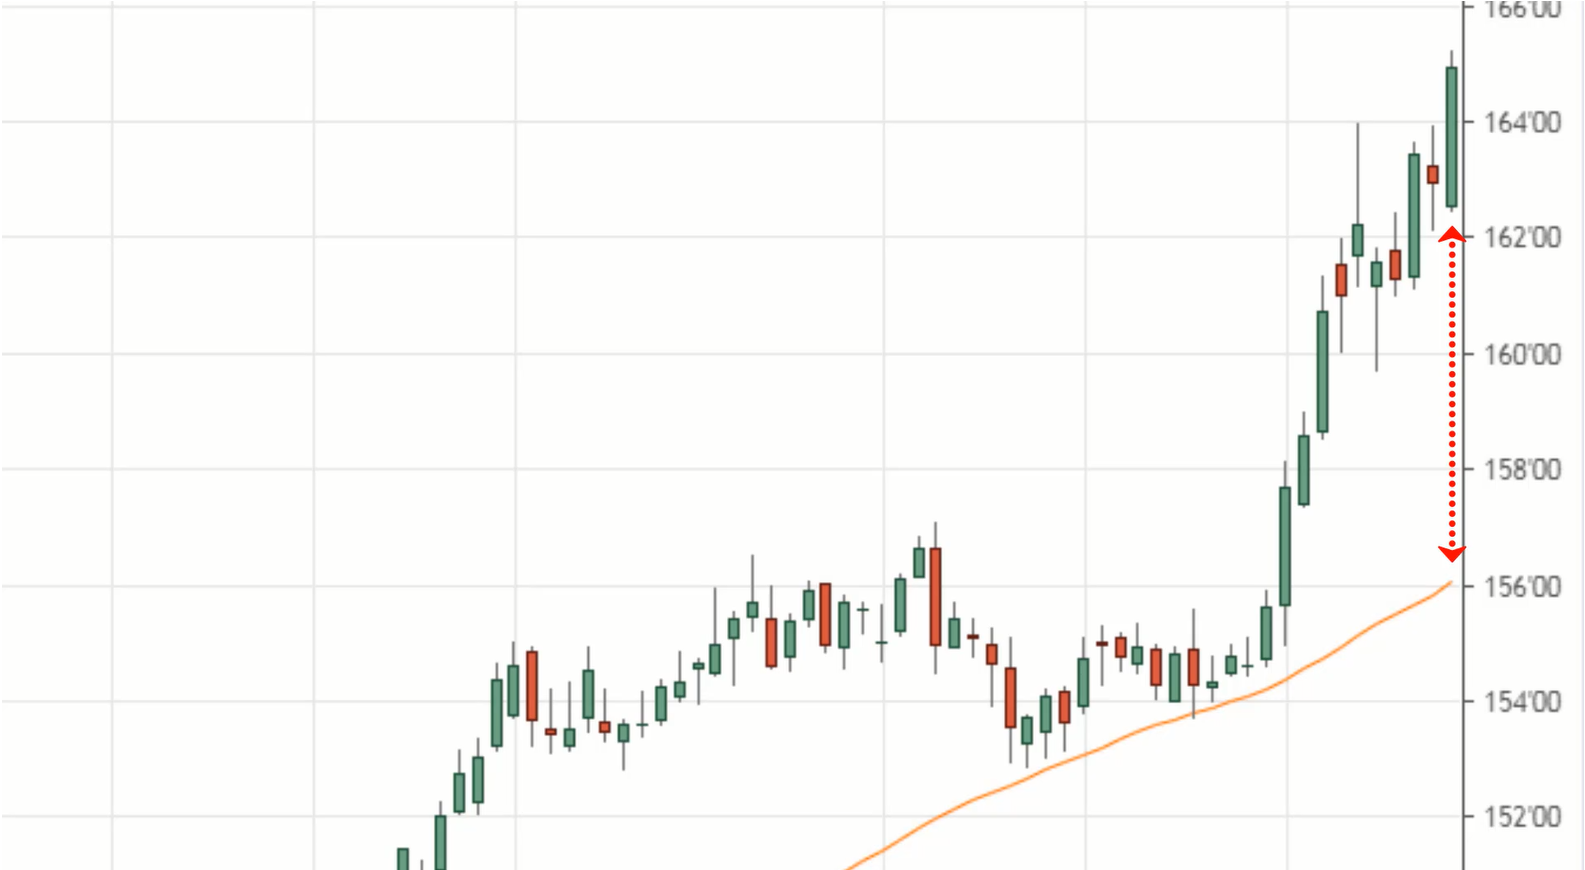
At this point, the price is far away from the area of value. If you want to buy, you can buy.
But bear in mind that if you were to buy, then a proper stop loss has to be below the area of value which is the 50 MA.
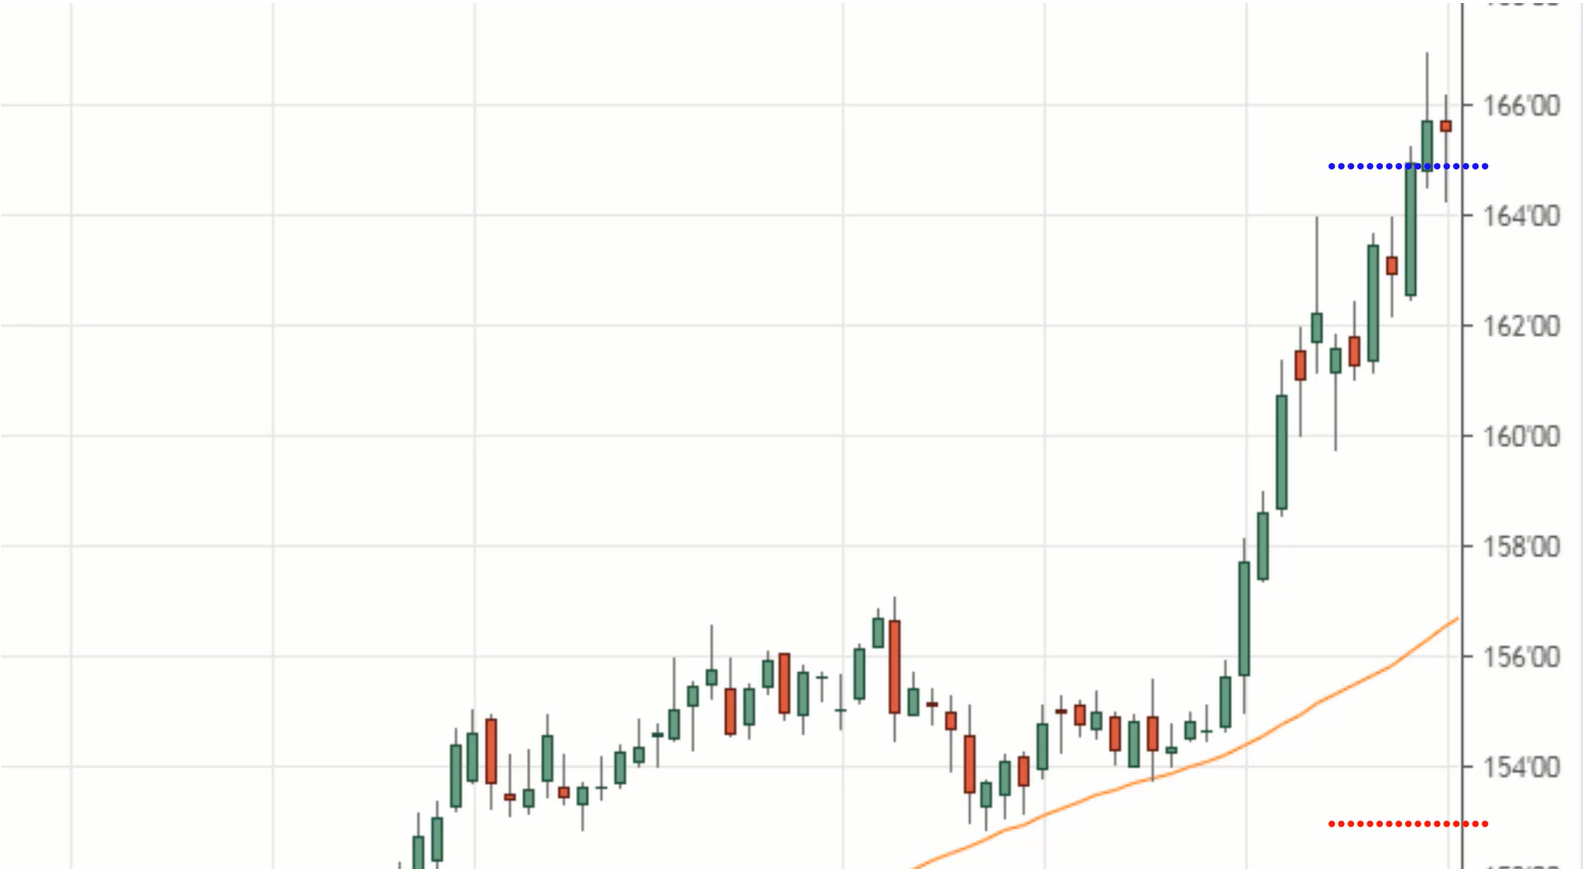
You can see that this is a pretty darn wide stop loss and it greatly reduces your potential R-multiple on the trade.
Of course, if you'd want to put your stop loss above the 50 MA, it's really up to you.
But bear in mind that if you do that, then when the market makes a pullback, you’re likely to get stopped out on the trade.
However, let's think about this. Let's say you are a patient trader. You let the market come to you. You trade near an area of value.
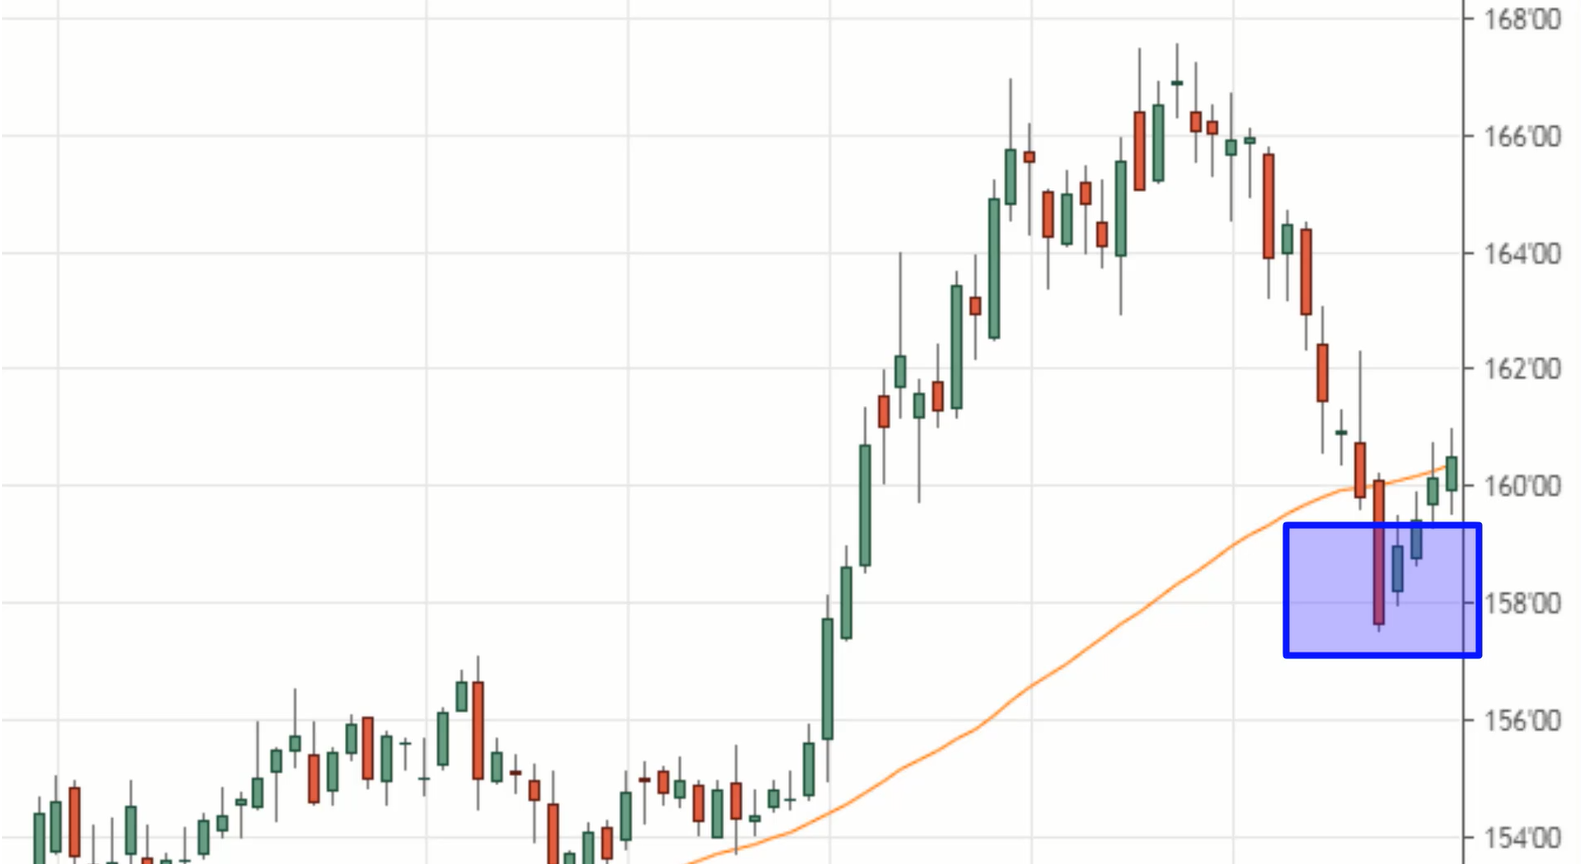
Now, can you see your stop loss is much tighter and it greatly improves your risk to reward? Make sense?
So this is important, not just knowing when to enter a trade, but also knowing when to stay out of the trade, especially when the price is far away from the area of value.
One more example before we wrap things up.
Example #2 (EUR/USD):
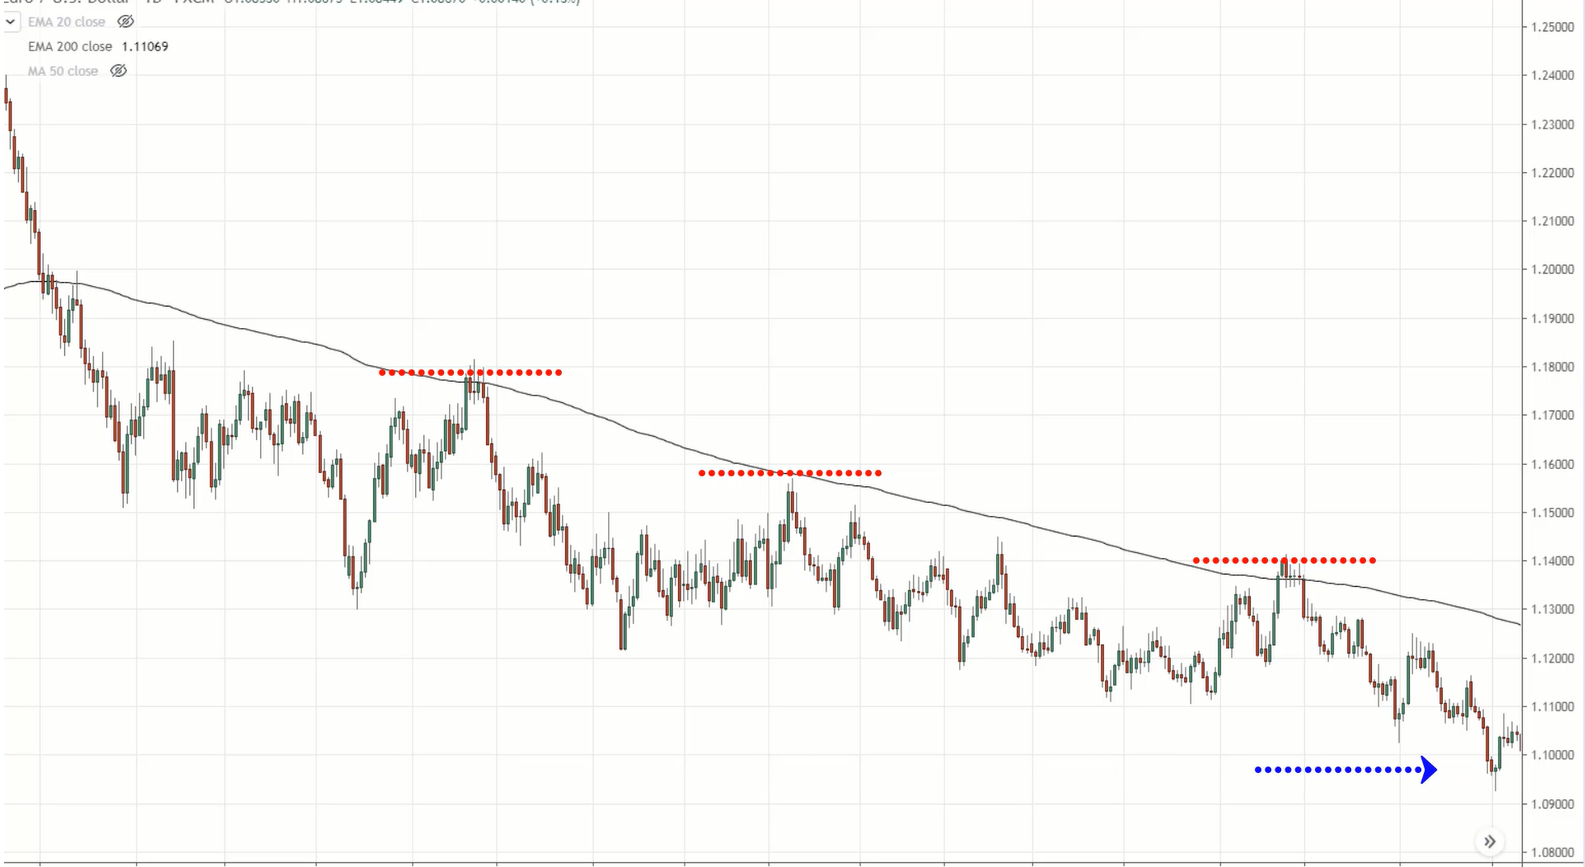
In this case, I would say that the 200 MA is a possible area of value for this market on this timeframe. It tested the 200 MA thrice.
Now if the market now is somewhere near the blue arrow, far away from the area of value, do you want to be selling? I hope not.
Because if you also use trendlines to create a trend channel:
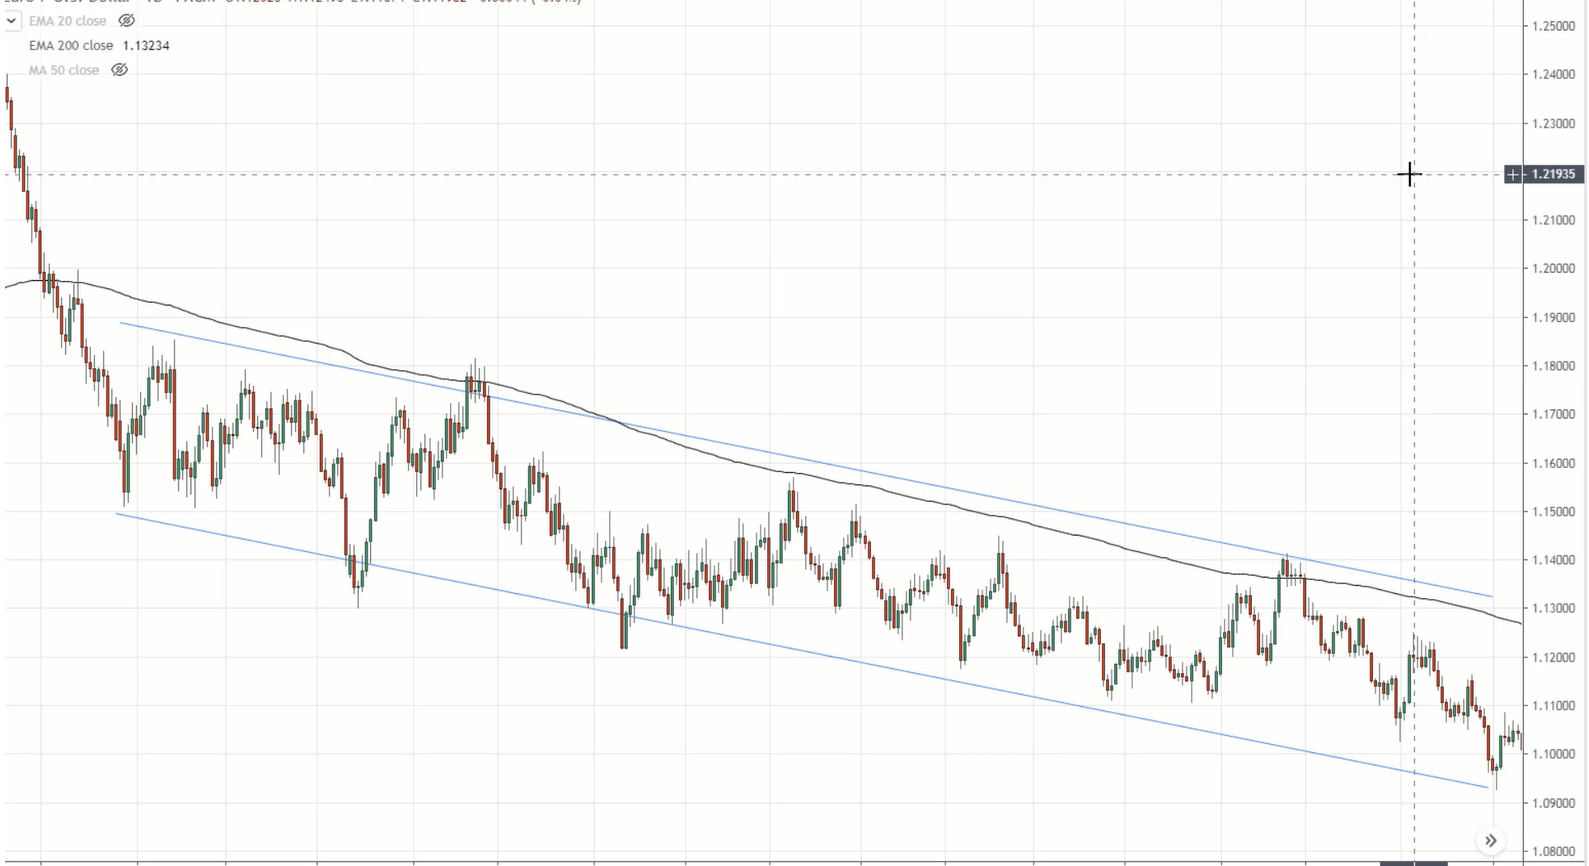
You’ll realize that the price is pretty much near the lows of this trend channel. Why would you want to be selling at the lows of this trend channel where the market would reverse?
You’ll likely get stopped out unless your stop loss is above the highs of the trend channel, which is going to be a pretty darn wide stop loss.
This is the final and important tip that I have for you:
Don't trade far away from an area of value.
As much as possible you want to trade as close as possible towards the area of value. Because it gives you a tighter stop loss which improves your risk to reward on the trade.
Here’s a quick recap…
Recap
- False break technique and how to profit from trapped traders: look for the price to break above the highs only to make a sudden reversal down lower.
- A buildup is a tight consolidation at the highs of resistance or lows of support before we trade the breakout or breakdown.
- Pre-breakout: look for a buildup on the daily timeframe, then go down to a lower timeframe to look for a false break set up.
- The rubber band snap: Don't trade when the price is far away from the area of value. Because when it makes a pullback, you will likely get stopped out of your trades.
With that said, I wish you good luck and good trading. I will talk to you soon.
